
Table 1
Dye leakage results with neat DMPC liposomes
| Peptides | Fluorescence intensity increase (%) |
|---|---|
| Aurein 1.2 –NH2 (wild type) | 30 |
| Aurein 1.2 –COOH | 1 |
| Aurein 1.2 –NH-CH3 | 0 |
Table 2
Results of CD measurements
| Medium | %Helicity | ||
|---|---|---|---|
| aurein1.2-NH2 | aurein1.2-NH-CH3 | aurein1.2-COOH | |
| PBS | 9 | 4 | 9 |
| DMPC | 25 | 5 | 24 |
| DMPC:cholesterol 9:1 | 20 | 5 | 12 |
| DMPC:DMPG 4:1 | 38 | 8 | 32 |
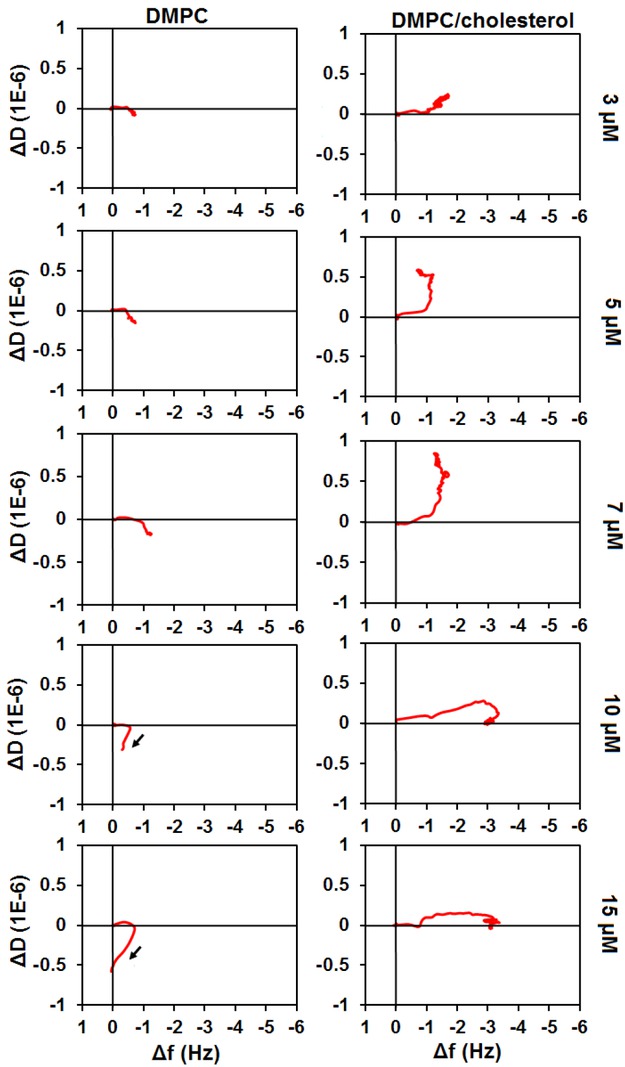
Figure 1
ΔD vs Δf plots of aurein1.2-NH-CH3 interaction with DMPC and DMPC:cholesterol (9:1) membranes at different concentrations. The effect is shown for the seventh harmonic of the fundamental frequency of the sensor chip.
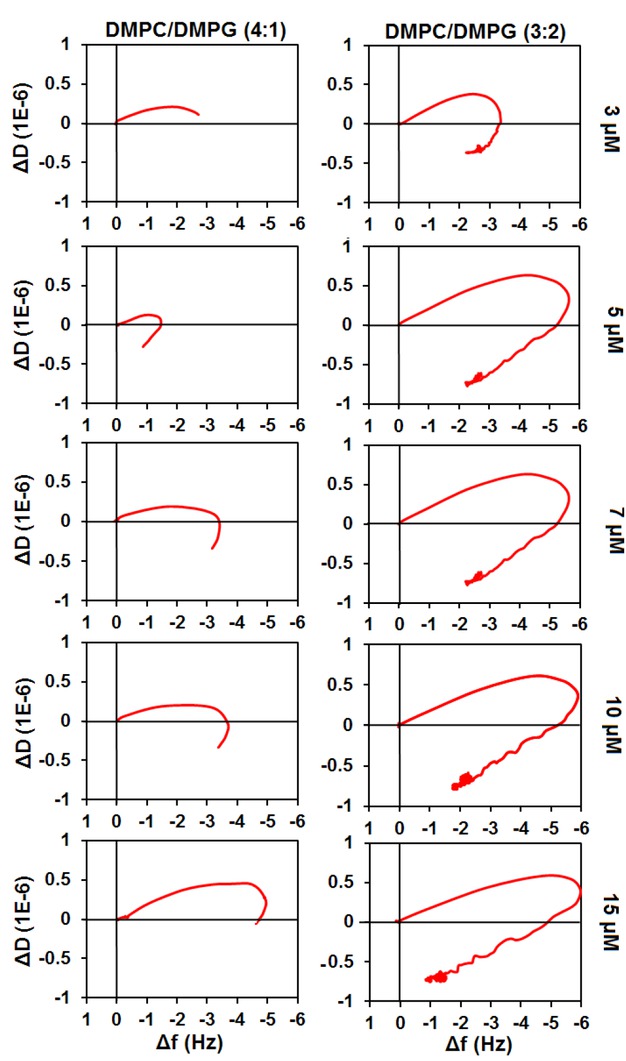
Figure 2
ΔD vs Δf plots of aurein1.2-NH-CH3 interaction with DMPC/DMPG (4:1) and DMPC/DMPG (3:2) at different concentrations. The effect is shown for the seventh harmonic of the fundamental frequency of the sensor chip.
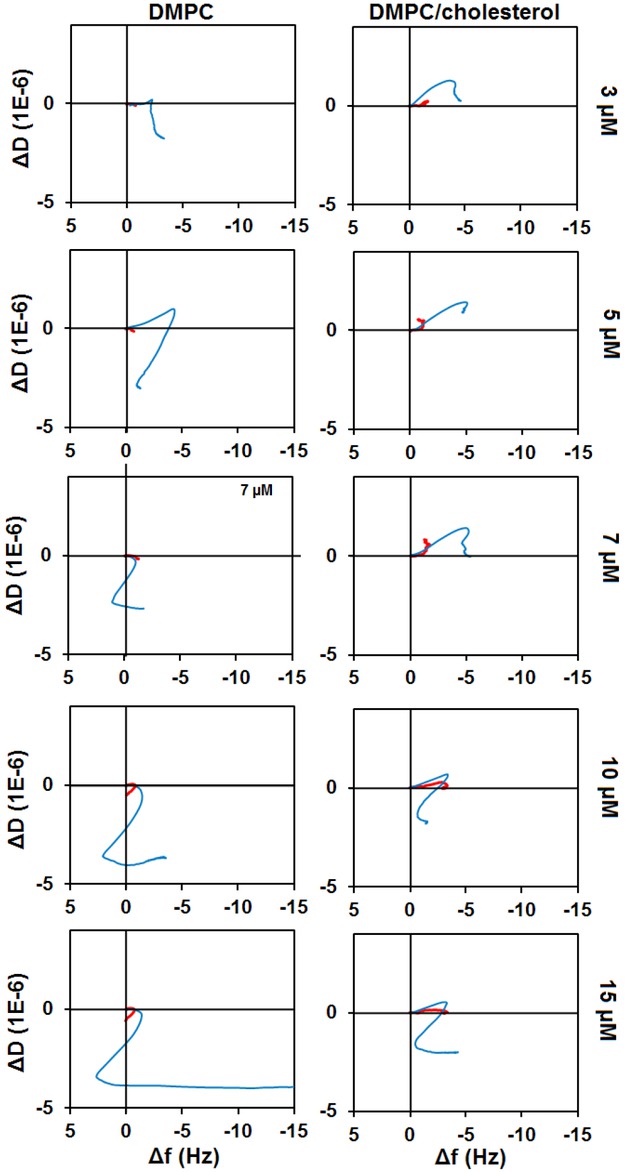
Figure 3
Comparison of the viscoelastic fingerprints of aurein1.2-NH-CH3 (red line) and aurein1.2-NH2 (blue line). The effect is shown for the seventh harmonic of the fundamental frequency of the sensor chip.
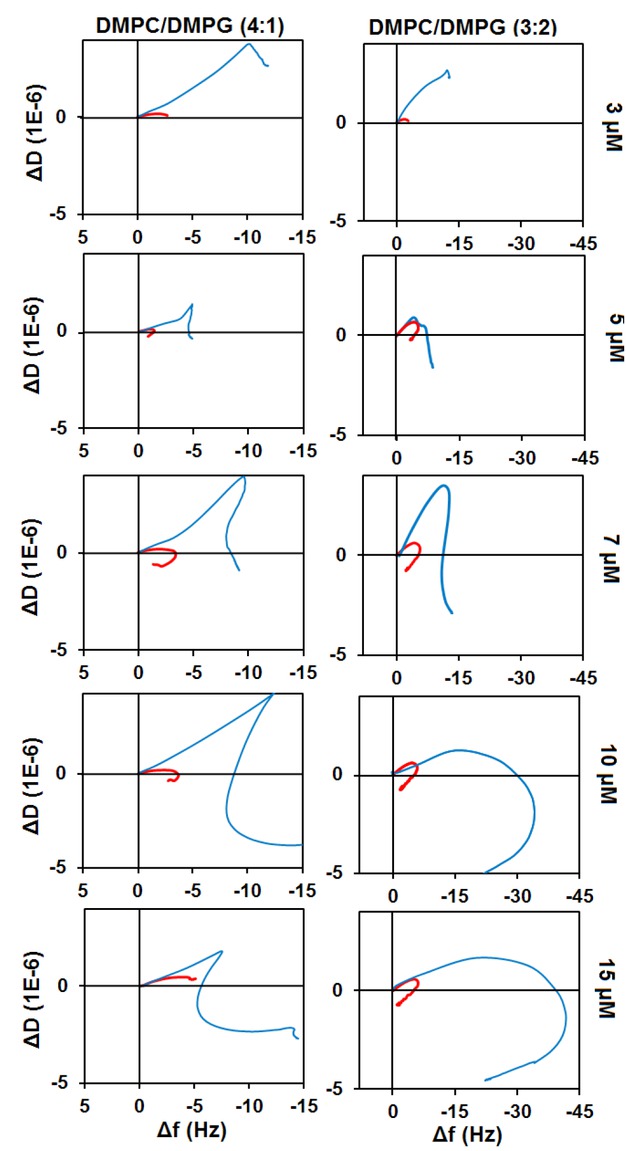
Figure 4
Comparison of the viscoelastic fingerprints of aurein1.2-NH-CH3 (red line) and aurein1.2-NH2 (blue line). The effect is shown for the seventh harmonic of the fundamental frequency of the sensor chip.
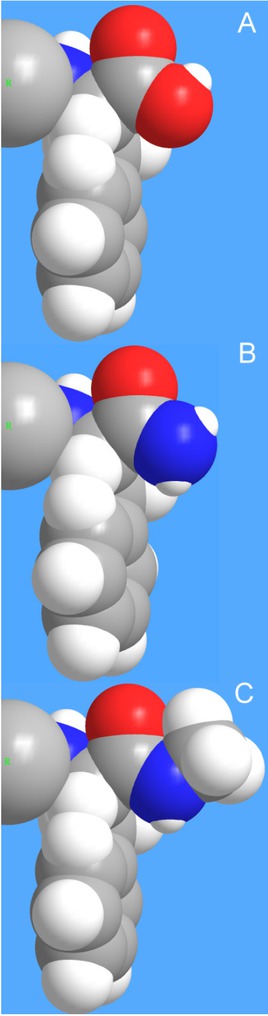
Figure 5
Comparison of the space filling models of the C-terminal region. The last residue (F13) is shown in full; the rest of the peptide is represented with an R group (large sphere in the figure). A) unmodified carboxyl terminus; B) primary amide (wild type) terminus; C) secondary amide with methyl terminus.