
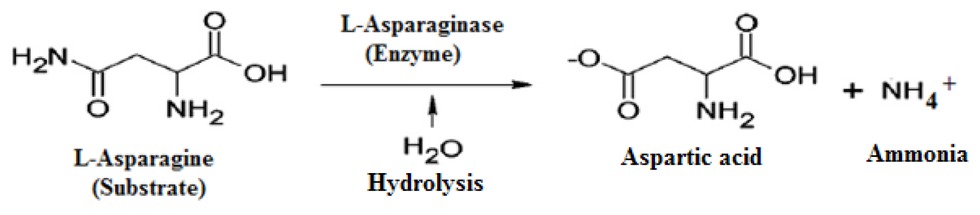
Figure 1
Schematic representation of the reaction mechanism between L-Asparaginase and L-asparagine. The enzyme catalyzes the hydrolysis of L-asparagine into aspartic acid and ammonia depriving the tumour cells to utilize this amino acid and inhibiting tumour growth.
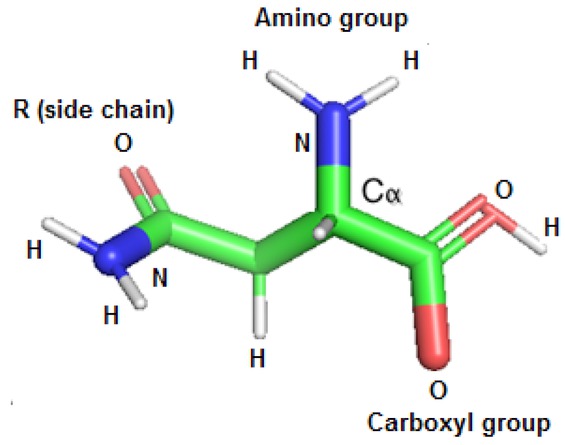
Figure 2
Crystal structure of L-asparagine (L-Asn) amino acid molecule. The L-Asn contains a central α-carbon atom to which both the amino (blue) and carboxyl groups (red) are attached. The other two bonds of the α-carbon atom are satisfied by the hydrogen (white) atom and the R group- side chain (Retrieved from Library of 3D Molecular Structures).
Table 1
Blastp report of amino acid sequences producing significant alignments with L-ASP I of V. campbellii
| PDB ID | Query coverage (%) | Max Identity (%) | E value | Gap (%) | Positive (%) |
|---|---|---|---|---|---|
| 2OCD_A | 100 | 85 | 8e-168 | 0 | 91 |
| 2P2D_A | 99 | 73 | 4e-139 | 0 | 84 |
| 2HIM_A | 99 | 73 | 2e-138 | 0 | 84 |
| 3NTX_A | 99 | 70 | 2e-132 | 0 | 82 |
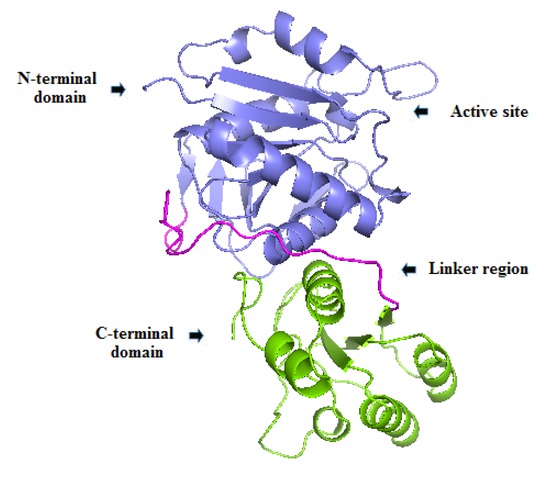
Figure 3
Modeled dimeric structure of L- Asparaginase I from V. campbellii. The two monomers (large and small) are shown in blue and green respectively. The larger and smaller monomers comprising of N-terminal and C-terminal regions.
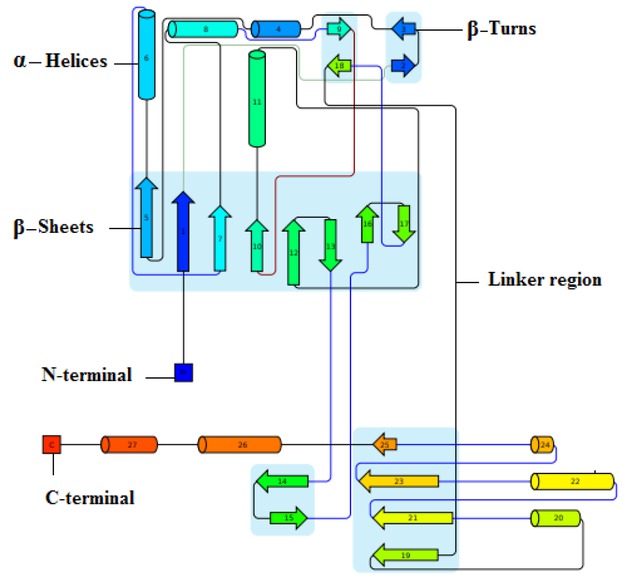
Figure 4
Topology of the L-Asparaginase I from V. campbellii with large arrows showing β-sheets, cylinders representing α-helices and small arrows indicating β-turns on both the N-terminal and C-terminal regions of the dimeric enzyme. The two monomers are connected together by a linker region comprising of coil proteins (cartoon representation using Pro-origami).
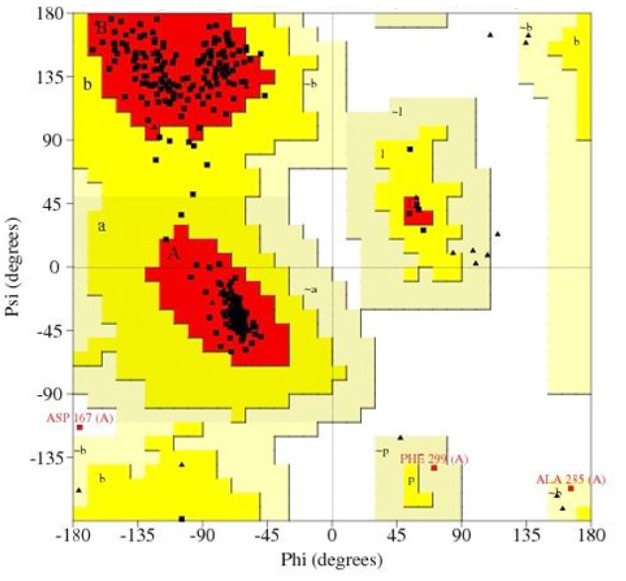
Figure 5
The Ramachandran map for L-Asparaginase I of V. campbellii shows the phi-psi torsion angles for all residues. The shading on the plot represents different regions. The red color corresponds to the core regions representing the most favourable combinations of phi-psi values.
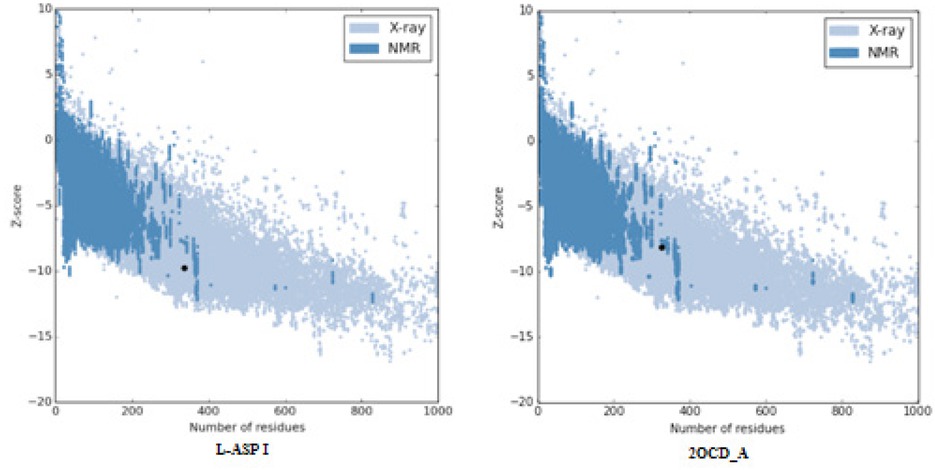
Figure 6
ProSA-web z-scores of all protein chains in PDB determined by X-ray crystallography (light blue) or NMR spectroscopy (dark blue) with respect to their length. The plot shows only chains with less than 1000 residues and a z-score ≤ 10. The z-scores of L-ASP I and 2OCD_A are highlighted as large dots.
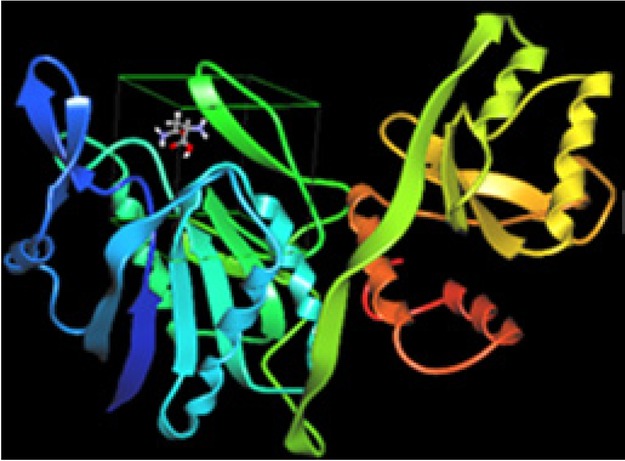
Figure 7
Molecular docking result of L-Asparaginase I and L-asparagine obtained from Argus Lab v.4.0, showing the ligand substrate binding with the enzyme. The ligand substrate is bound to the active site of the larger N-terminal domain of the enzyme.
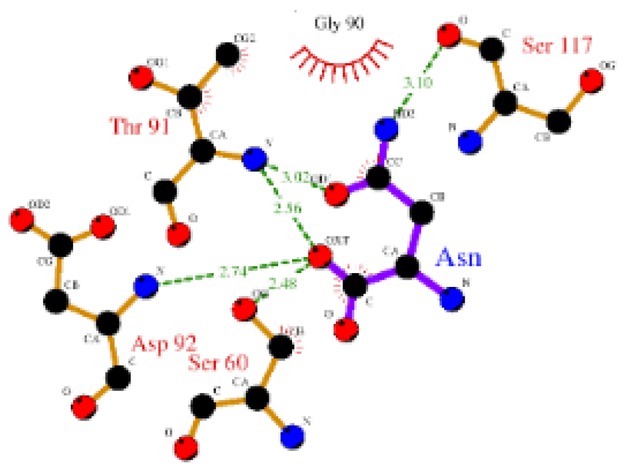
Figure 8
LigPlot showing the docked complex of ligand substrate L-asparagine and enzyme L-Asparaginase. The ligand L-asparagine (Asn) is bound to the enzyme within the sphere of the radius 8 Å. The enzyme residues are close to L-Asn (central residue) along the N and C direction contribute to short and medium range interaction.
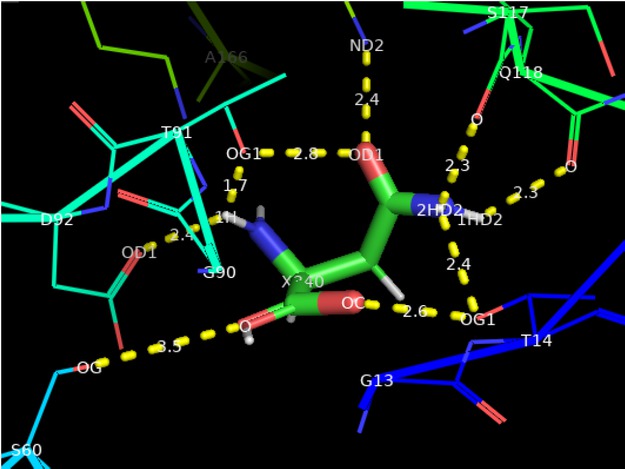
Figure 9
Molecular interactions between L-asparaginase I and ligand substrate L-Asn substrate showing the active site of L-asparaginase I dimer. The side chain carboxyl group of the L-Asn (Central residue) is in close contact with the hydroxyl groups of both candidate nucleophiles, T14 and T91.
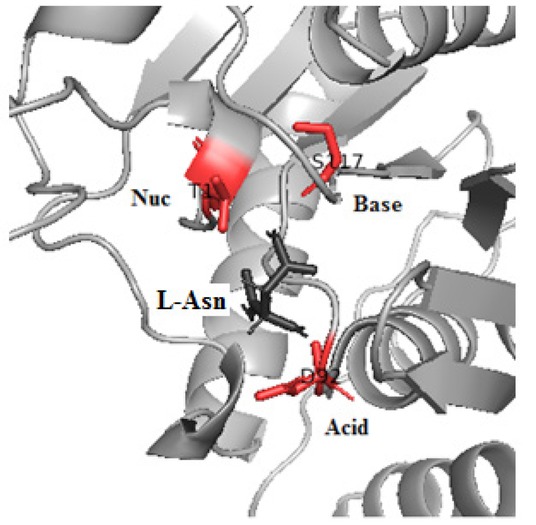
Figure 10
The enzyme L-asparaginase I showing a catalytic triad containing residues (red) in its active site. The triad comprising of residues threonine (nucleophile), serine (base) and aspartic acid (acid). The L-asparagine substrate (black) is bound to the enzyme.