
Figure 1
Figure 2
Figure 3
Figure 4
Figure 5
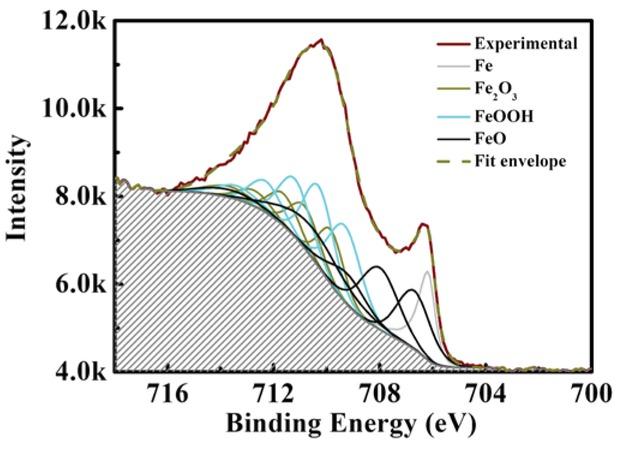
Figure 6
Figure 7
The XPS parameters: peak position (eV), FWHM, and the intensities for fitting the Fe 2p3/2; data from (33)_ Ave is the average value of the respective α and γ components of Fe2O3 and FeOOH_
| Compound | Peak (eV) | FWHM | % |
|---|---|---|---|
| Fe | 706.6 | 0.88 | 100.0 |
| FeO(1) | 708.4 | 1.4 | 24.2 |
| FeO(2) | 709.7 | 1.6 | 30.1 |
| FeO(3) | 710.9 | 1.6 | 14.5 |
| FeO(4) | 712.1 | 2.9 | 25.6 |
| FeO(5) | 715.4 | 2.5 | 5.6 |
| Ave. Fe2O3 (1) | 709.8 | 1.1 | 26.8 |
| Ave. Fe2O3 (2) | 710.8 | 1.3 | 24.7 |
| Ave. Fe2O3 (3) | 711.6 | 1.3 | 18.9 |
| Ave. Fe2O3 (4) | 712.7 | 1.4 | 10.1 |
| Ave. Fe2O3 (5) | 713.7 | 2.0 | 10.0 |
| Ave. FeOOH(1) | 710.3 | 1.4 | 27.0 |
| Ave. FeOOH(2) | 711.3 | 1.3 | 26.5 |
| Ave. FeOOH(3) | 712.2 | 1.4 | 20.6 |
| Ave. FeOOH(4) | 713.3 | 1.4 | 11.3 |
| Ave. FeOOH(5) | 714.1 | 1.9 | 6.3 |