
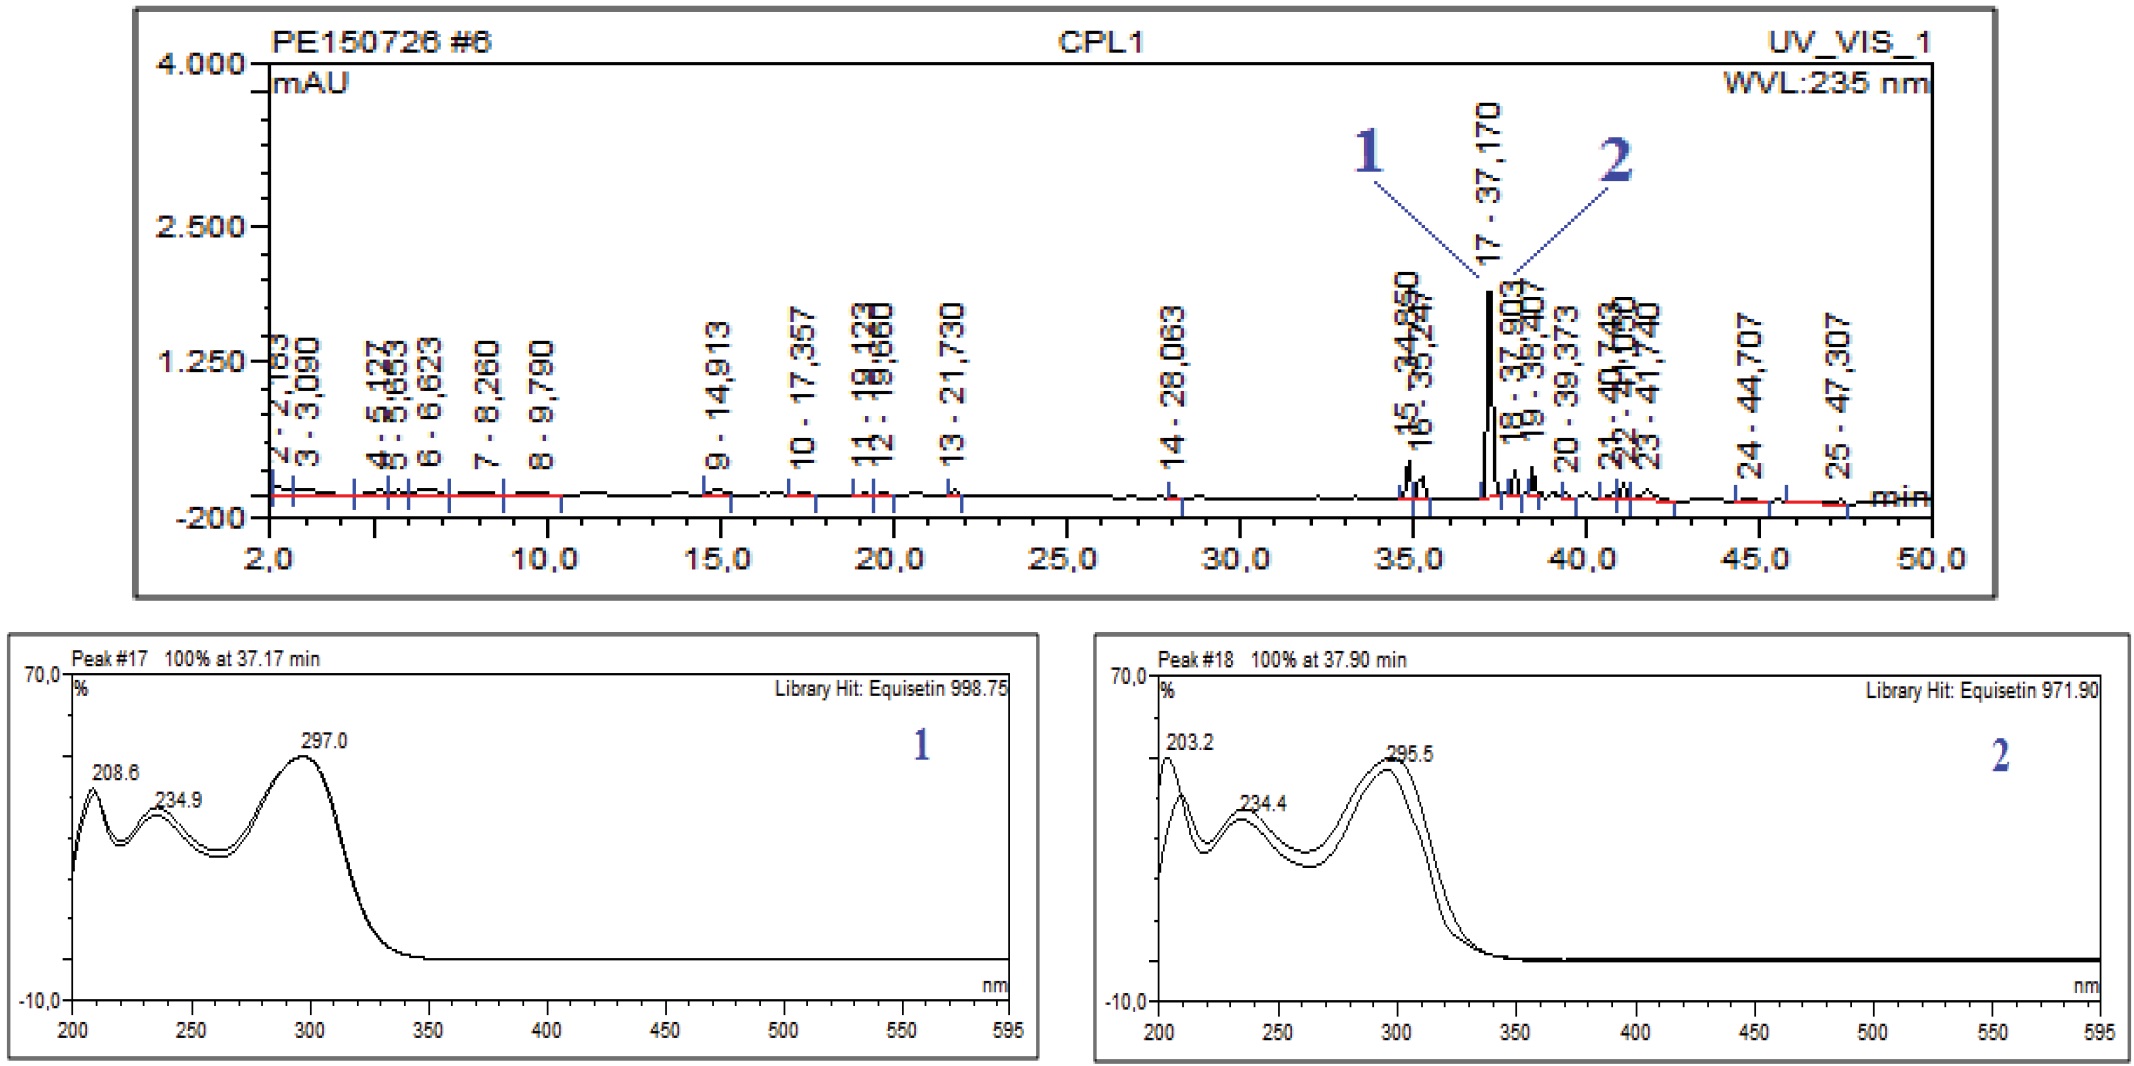
Figure 1
HPLC Chromatogram of Fusarium equiseti’s crude extract (CPL1); and UV-spectra of compounds 1 (Peak 17, RT 37.17 min) and 2 (Peak 18, RT 37.90 min).
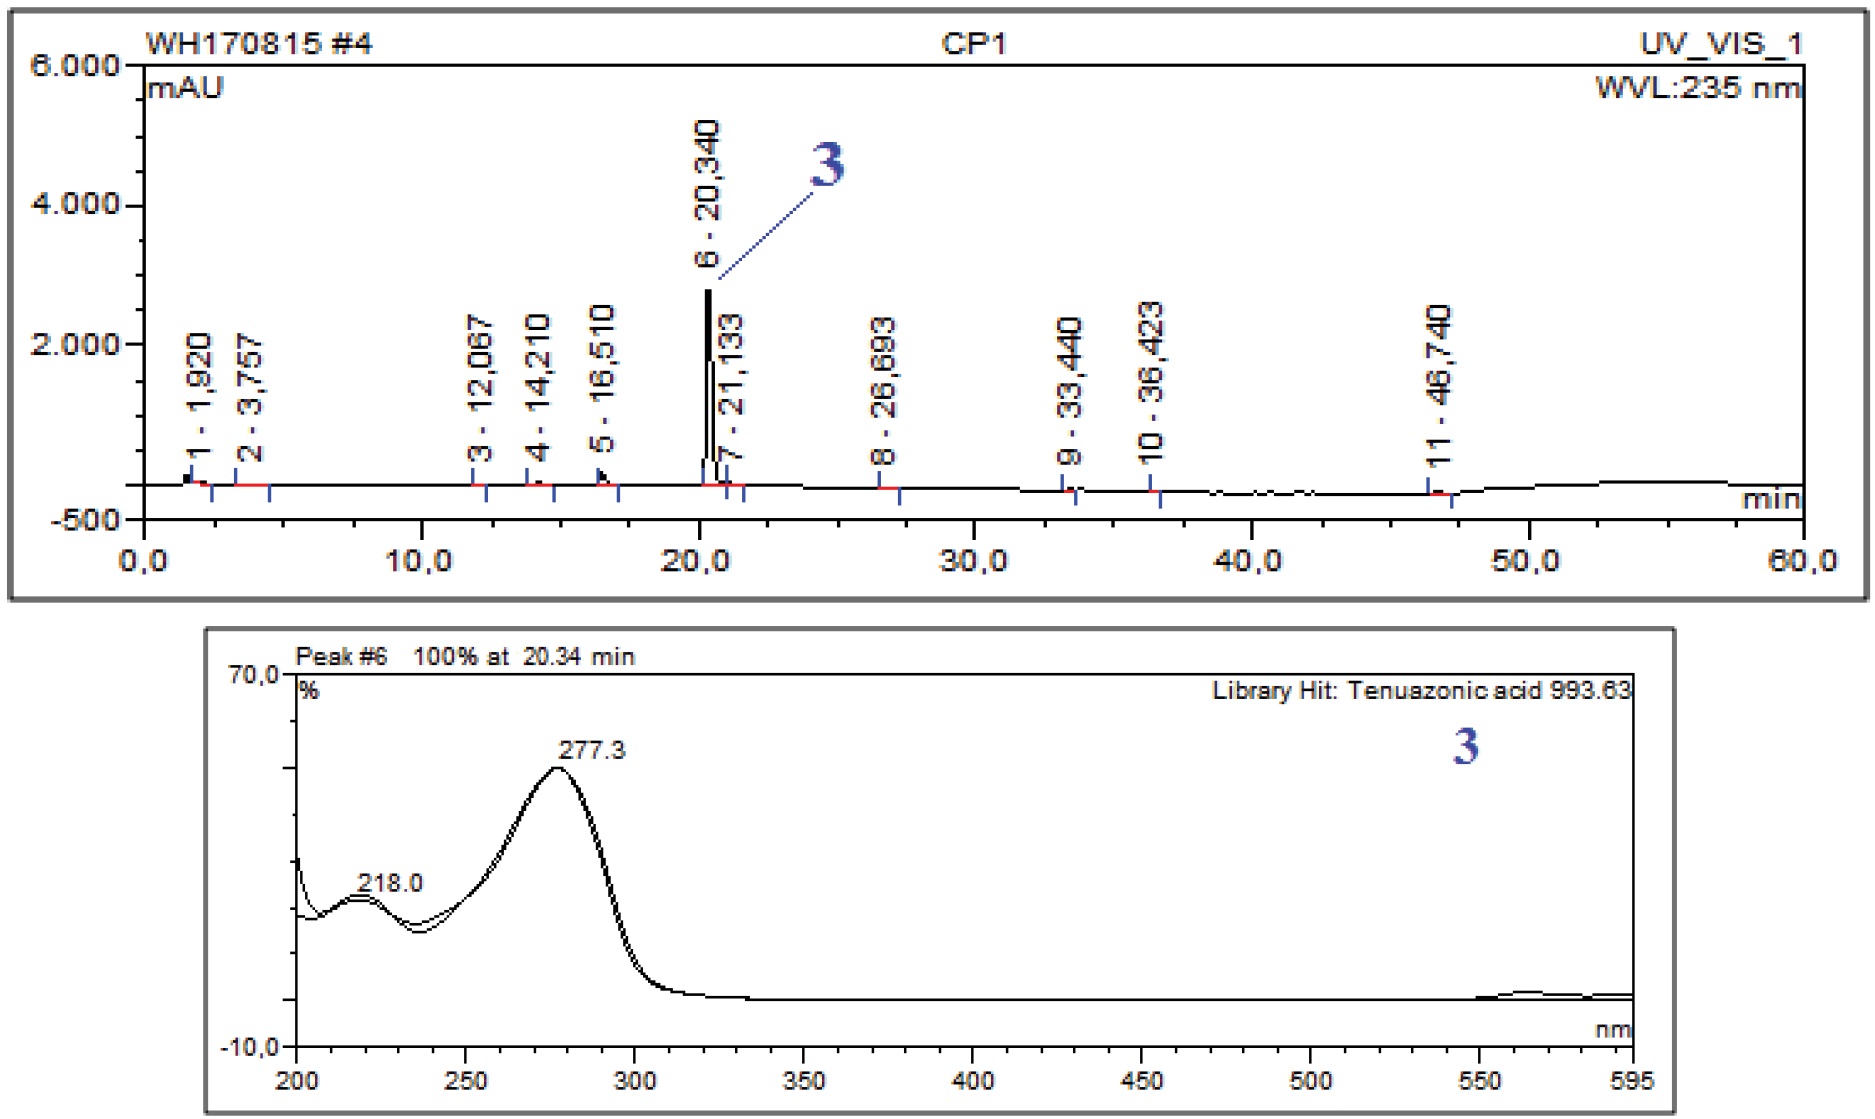
Figure 2
HPLC Chromatogram of Epicoccum sorghinum’s crude extract (CP1); and UV-spectrum of compound 3 (Peak 6, RT 20.34 min).
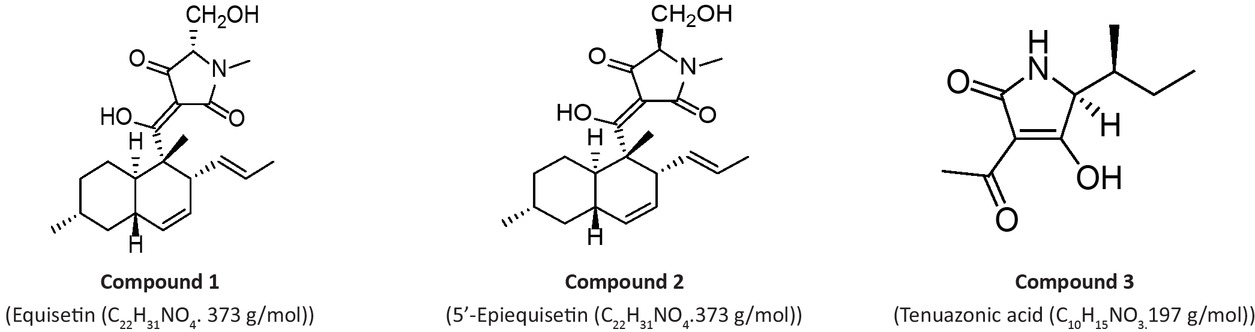
Figure 3
Structures of isolated compounds.