
Table 1
List of the bioluminescence bacteria
| Strain designation | E. coli host strain | Promoter | Stress sensitivity | Inducer used in this study | Concentration | Reference |
|---|---|---|---|---|---|---|
| K802NR | Psb1075 | lasI | Nalidixc acid (gorA) | Nalidixic acid | 100 mg/L | (23) |
| TV1061 | RFM443 | grpE | Heat shock (general stress) | Ethanol | 0.43 M | (24) |
| DPD2794 | RFM443 | recA | SOS (genotoxicity) | Mitomycin C | 8000 ppb | (25) |
| DPD2544 | W3110 | fabA | Faty acid availabilty (general stress) | Phenol | 5.2×10⁻⁴ M | (20) |
| DPD1718 | DPD1692 | recA | SOS (genotoxicity) | Mitomycin C | 8000 ppb | (26) |
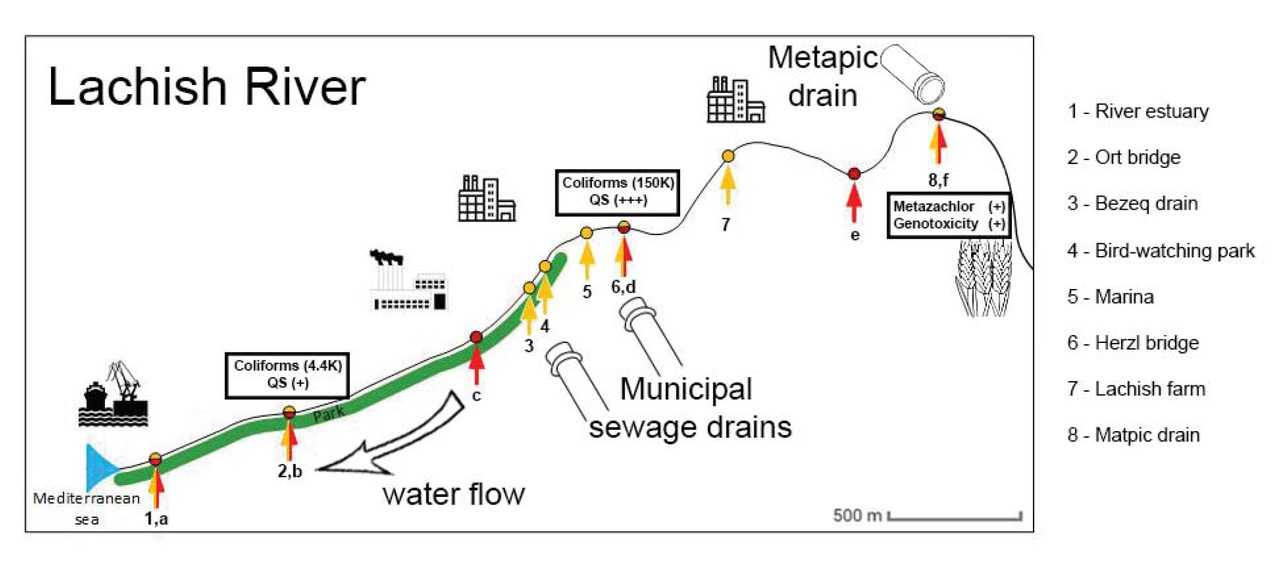
Figure 1
A schematic map of the Lachish River. Letters describe the sites tested using whole cell biosensor, sites numbered were tested using conventional methods. It should be noted that both teams (Ashdod-Yavne cities association for environmental quality control and Ben Gurion University) did not coordinate testing site collections because these collection events were made without each other’s knowledge. However, it became obvious that pooling our data together would be a helpful endeavor. At Site 8,f the bioluminescence whole cell based sensor indicated a genotoxic influence, conventional methods revealed the presence of Metazachlor, that is suspected for being genotoxic; site 6,d high concentrations of coliforms were found, findings from the biosensor suggested the presence of quorum sensing molecules; with the decrease in coliform concentration towards site 2,b and farther at site 1,a, the indication for quorum sensing molecules, by the bioluminescence bacteria biosensor, decreased.
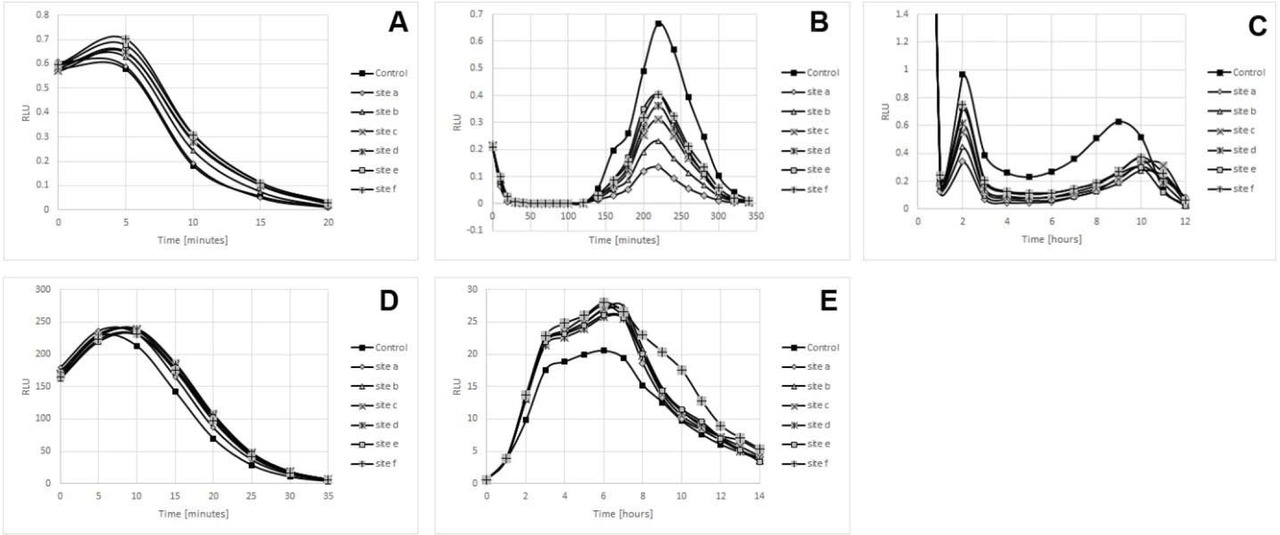
Figure 2
Kinetic luminescence response of bacteria to samples. A is K802NR strain response, B is TV1061 strain response, C is DPD2794 strain response, D is DPD2544 strain response, and E is DPD1718 strain response.
Table 2
Results of the water conventional testing of the water samples collected at the different sampling sites along Lachish River
| units | Sampling site | Environmental guideline | Method performed | ||||||||
|---|---|---|---|---|---|---|---|---|---|---|---|
| 1 | 2 | 3 | 4 | 5 | 6 | 7 | 8 | ||||
| Coliforms | cfu/ml | 870 | 4400 | 5100 | 26000 | 78000 | 150000 | 42000 | not tested | <8 (42) | SM9222D |
| BOD | mg/L | 8.7 | 6.9 | 7.5 | 2.5 | <4 (43) | SM5210B | ||||
| Dissolved oxygen | mg/L | 1.1 | 0.9 | 0.8 | 1 | >3 (42) | SM4500 OC/SM | ||||
| Conductivity | μs/cm | 17130 | 16500 | 12700 | 850 | <1500 (20°)(44) | SM2510B | ||||
| Gravimetric oils and fats | mg/L | <5 | <5 | <5 | <5 | <1.5 (42) | SM5520B | ||||
| Arsenic | mg/L | <0.010 | <0.010 | <0.010 | <0.010 | <0.01 (42) | SM3120B | ||||
| Cadmium | mg/L | <0.005 | <0.005 | <0.005 | <0.005 | <0.025 (42) | SM3120B | ||||
| Lead | mg/L | <0.005 | <0.005 | 0.007 | 0.096 | <0.04 (42) | SM3120B | ||||
| Ammonia (NH3C) | mg/L | 0.6 | 3.7 | 1.5 | 2.9 | <0.233 (45) | SM4500 NHLC | ||||
| Atrazine | mg/L | n.d. | n.d. | n.d. | 0.0005 | <0.002 (42) | |||||
| Diflufenican | mg/L | n.d. | n.d. | n.d. | below LOQ | ||||||
| Metazachlor | mg/L | n.d. | n.d. | n.d. | 0.0013 | <0.0001 (46) | |||||
| pH | pH units | 7.52 | 7.33 | 7.29 | 7.27 | 6-8.5(30) | SM4500 H+B | ||||
| Phosphorus | mg/L | 0.18 | 1.15 | 0.36 | 0.44 | <2 (42) | Kit based in house procedure | ||||
| Total carbon organic | mg/L | 31.66 | 26.6 | 43.5 | 81 | <15 (45) | SM5310B | ||||
| TSS in 103 upto 105 | mg/L | 11.5 | 19.5 | 12 | 14 | <15 (42) | SM2540D | ||||
| TSS in 550 | mg/L | <1 | <1 | <1 | <1 | <15 (42) | SM2540E | ||||
| Turbidity | NTU | 20 | 19.8 | 23.1 | 41.2 | <20 (45) | SM2130B | ||||
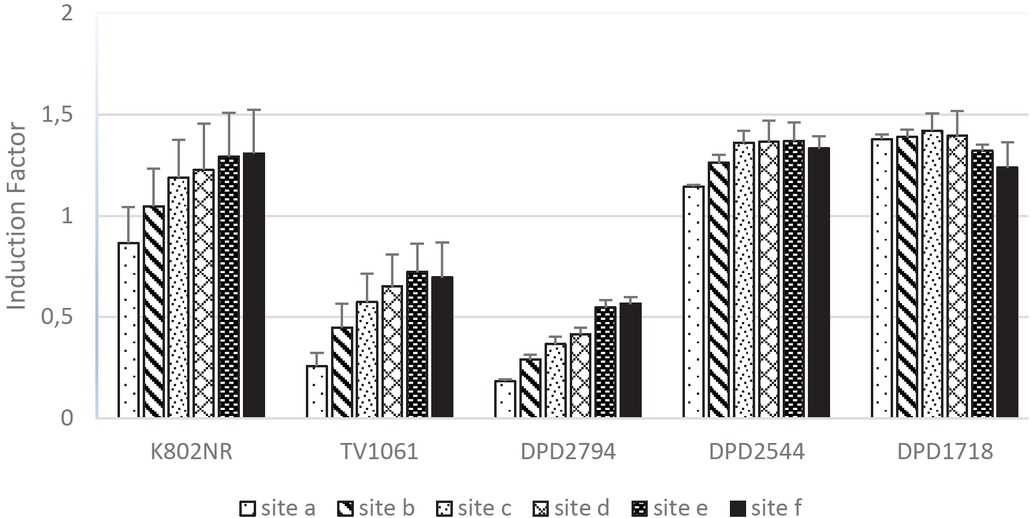
Figure 3
Induction factor of each bacterial indicator as effected by site (n=3).
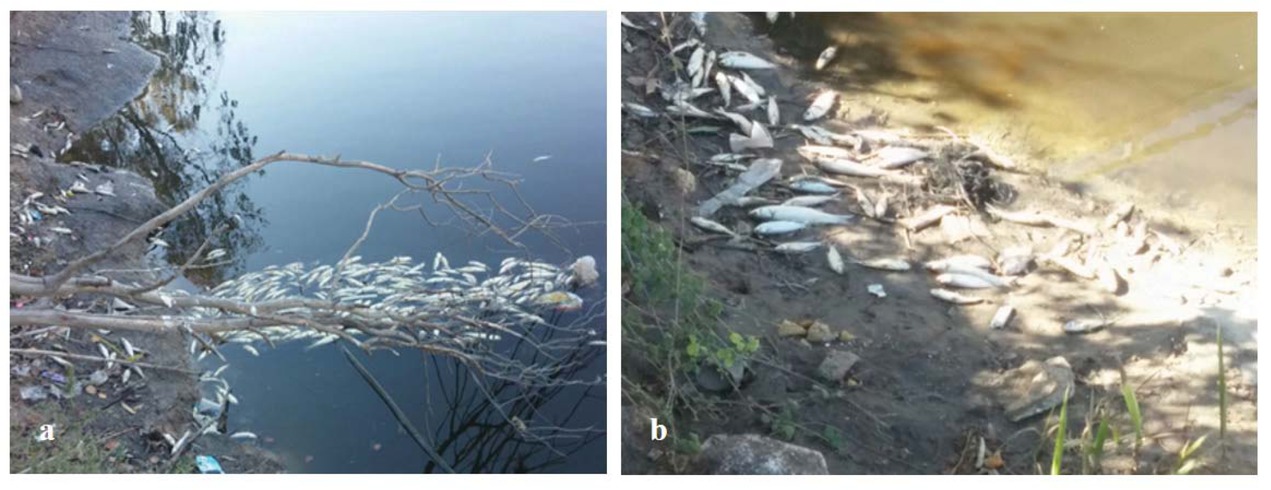
Figure 4
Pictures taken from the Lachish River, on October 13th, 2017. 4a: Dead fish in collection point c, 4b: Dead fish under Herzl Bridge, Collection Point f/8. (T. Axelrod)