
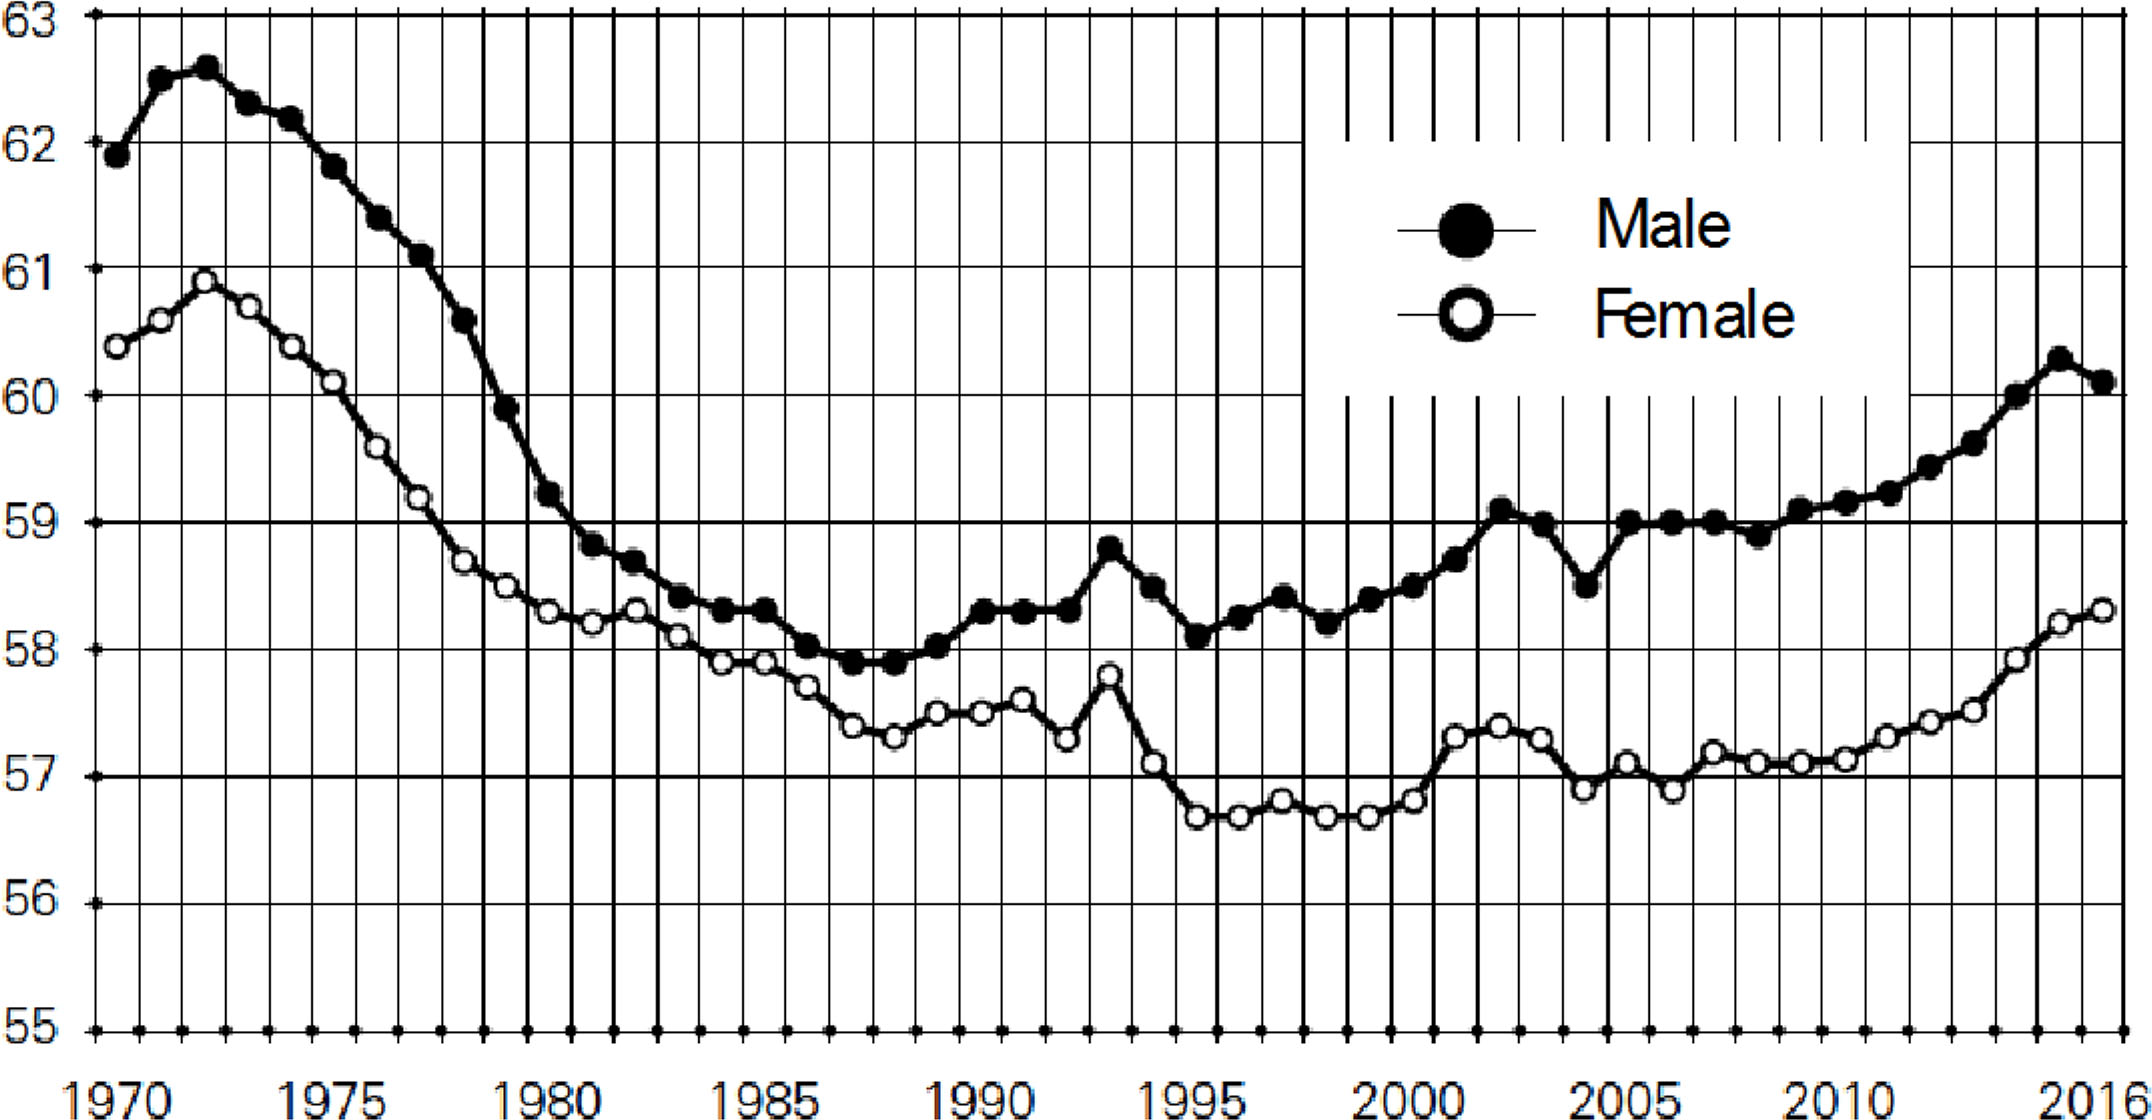
Figure 1
Average pension age in Austria (including rehabilitation)
Source: Main Association of Austrian Social Security Organizations
Table 1
An international comparison of the Austrian Pension System
| Country | Type | Accrual rate (in %) | Earnings Measure | Valorization | Indexation | Link to life exp. |
|---|---|---|---|---|---|---|
| Austria | DB | 1.78 | 28–40 | w | d | |
| Belgium | DB | 1.33 | L | p | p | |
| Denmark | DC | x | ||||
| Finland | DB | 1.5 | L | 80w/20p | 20w/80p | x |
| France | DB/points | 1.12 | b25/L | p/p | p/p | x |
| Germany | Points | 1.00 | L | w [c] | w [c] | x |
| Italy | NDC | 1.46 | L | GDP | p | x |
| Netherlands | DB | 1.85 | L | w [c] | w [c] | x |
| Norway | NDC | 0.94 | L | w | w − 0.75 | x |
| Portugal | DB | 2.3–2 [w] | L | 25w/75p | p/GDP | |
| Spain | DB | 1.82 [y] | f25 | p | 0.25% to p + 0.5% | x |
| Sweden | NDC | 0.95 [w] | L | w | w-1.6 [c] | x |
[i] Source: OECD, Pension at a Glance 2017 and EC 2018 Ageing Report
[ii] Remark: Parameters are for 2016, but include all legislated changes that will take effect in the future: for example, some countries are extending the period of earnings covered for calculating benefits. Empty cells indicate that the parameter is not relevant.
[iii] [a] = varies with age; b = number of best years; [c] = valorization/indexation conditional on financial sustainability; d = discretionary indexation; DB = defined benefit; DC = defined contribution; f = number of final years; fr = fixed rate valorization; GDP = growth of gross domestic product; L = lifetime average; NDC = non-financial accounts; p = valorization/indexation with prices; w = valorization/indexation with average earnings; [w] = varies with earnings; [y] = varies with years of service.
[iv] Austria: Valorization assumed to move to earnings as the averaging period for the earnings measure is extended. Italy: Indexation is fully linked to prices for low pensions and 75% of prices for higher pensions. Portugal: Indexation will be higher, relative to prices for low pensions and vice versa. The higher the GDP growth, the more generous the indexation.
Table 2
Neutral and official deduction rates for one year of early retirement (in %)
| Actuarial neutral | Official | Difference | |
|---|---|---|---|
| Austria | 5.3 | 5.1 (4.2) | 0.2 (1.1) |
| Belgium | 5.5 | 0.0 | 5.5 |
| Czech Republic | 6.4 | 3.6 | 2.8 |
| Slovenia | 5.8 | 3.6 | −2.2 |
| Germany | 4.9 | 3.6 | 1.3 |
| Finland | 1.5 | 0.0 | 1.5 |
| France | 5.0 | 5.0 | 0.0 |
| Portugal | 4.7 | 4.8 | −0.1 |
| Spain | 3.3 | 8.0 | −4.7 |
| Slovakia | 4.3 | 6.0 | −1.7 |
[i] Source: Freudenberg et al. (2018)
[ii] Remark: The Austrian deduction changed to 5.1% in 2017.
Table 3
Income tax rates in Austria
| Tax base | Tax rate |
|---|---|
| 0 EUR − 11,000 EUR | 0% |
| 11,000 EUR − 18,000 EUR | 25% |
| 18,000 EUR − 31,000 EUR | 35% |
| 31,000 EUR − 60,000 EUR | 42% |
| 60,000 EUR − 90,000 EUR | 48% |
| 90,000 EUR − 1,000,000 EUR | 50% |
| >1,000,000 EUR | 55% |
[i] Remark: The tax system changed in recent years due to a tax reform. See e.g. Christl et al. (2018). The difference between pension income and labour income however remained.
Table 4
Actuarially neutral deductions at age 64 (in %)
| Age | Wage | Pension account | ||
|---|---|---|---|---|
| (Low) | (Medium) | (High) | ||
| 64 | Low | 5.25% (± 0.15%) | 7.12% (± 0.23%) | 7.76% (± 0.24%) |
| Medium | 0.50% (± 0.14%) | 4.76% (± 0.19%) | 6.18% (± 0.22%) | |
| High | −1.37% (± 0.13%) | 3.86% (± 0.20%) | 5.56% (± 0.24%) | |
[i] Remark: The values in brackets are the differences based on the assumption that the mortality rate changes, according to a 10-year increase or decrease in the mortality tables.
Table 5
Incentive-neutral deductions at age 64 (in %)
| Age | Wage | Pension account | ||
|---|---|---|---|---|
| (Low) | (Medium) | (High) | ||
| 64 | Low | 5.40% (± 0.28%) | 9.50% (± 0.25%) | 9.59% (± 0.26%) |
| Medium | 1.06% (± 0.14%) | 6.45% (± 0.18%) | 7.58% (± 0.27%) | |
| High | −0.64% (± 0.23%) | 5.03% (± 0.31%) | 6.78% (± 0.21%) | |
[i] Remark: The values in brackets are the differences based on the assumption that the mortality rate changes, according to a 10-year increase or decrease in the mortality tables.
Table 6
Actuarially neutral decrements (in %) according age, sex and mortality table
| Sex | Mortality Table 2017 | Mortality Table 2007 | ||||
|---|---|---|---|---|---|---|
| Age | Age | |||||
| 62 | 63 | 64 | 62 | 63 | 64 | |
| Male | 4.35% | 4.87% | 5.29% | 4.58% | 5.05% | 5.55% |
| Female | 3.50% | 3.86% | 4.24% | 3.62% | 3.92% | 4.30% |
| Unisex | 3.93% | 4.35% | 4.76% | 4.12% | 4.51% | 4.95% |
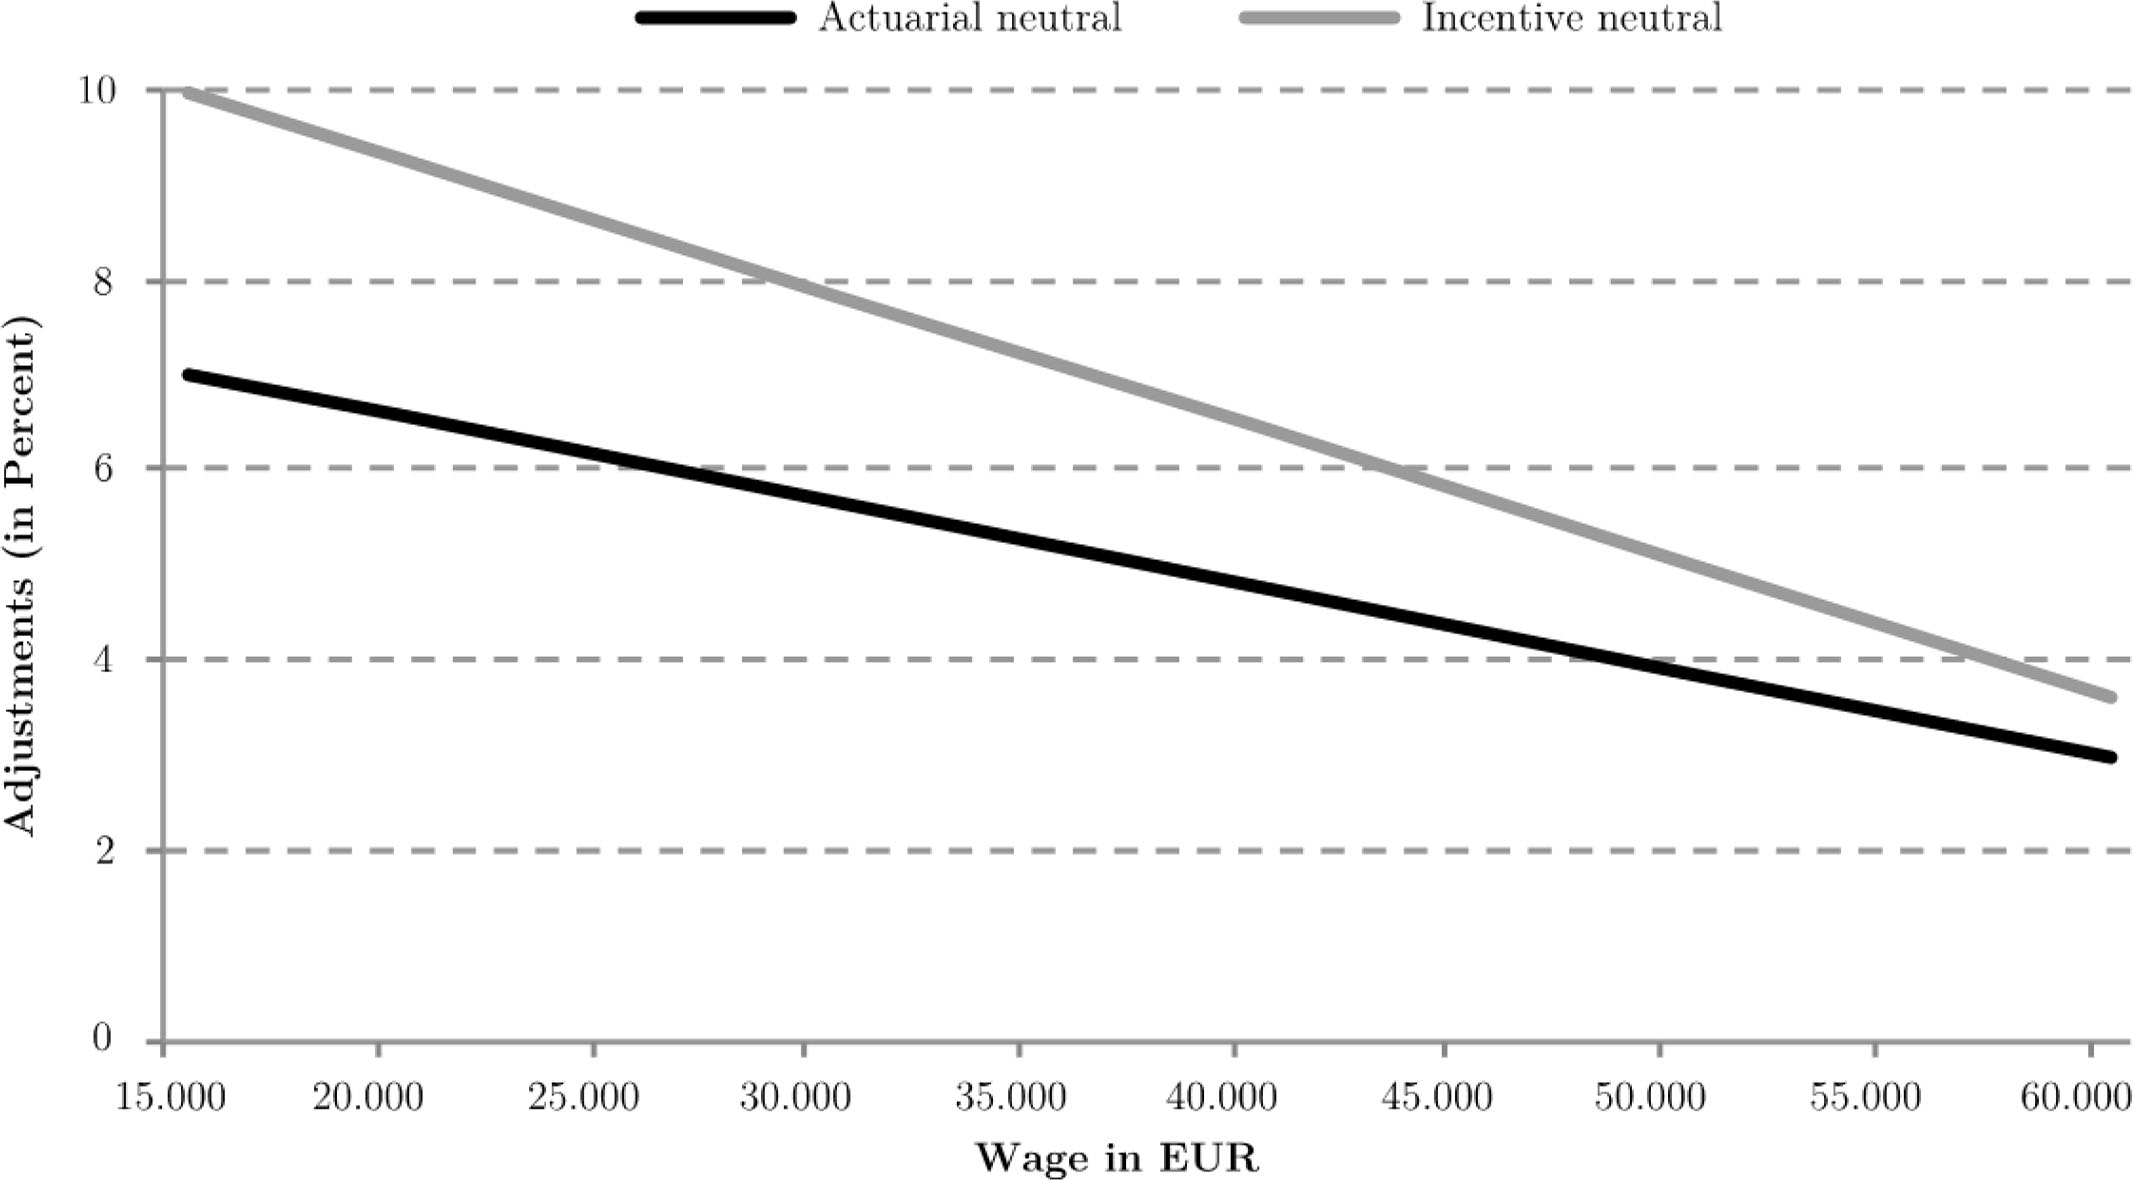
Figure 2
The effect of additional earnings on actuarially neutral and incentive-neutral adjustments
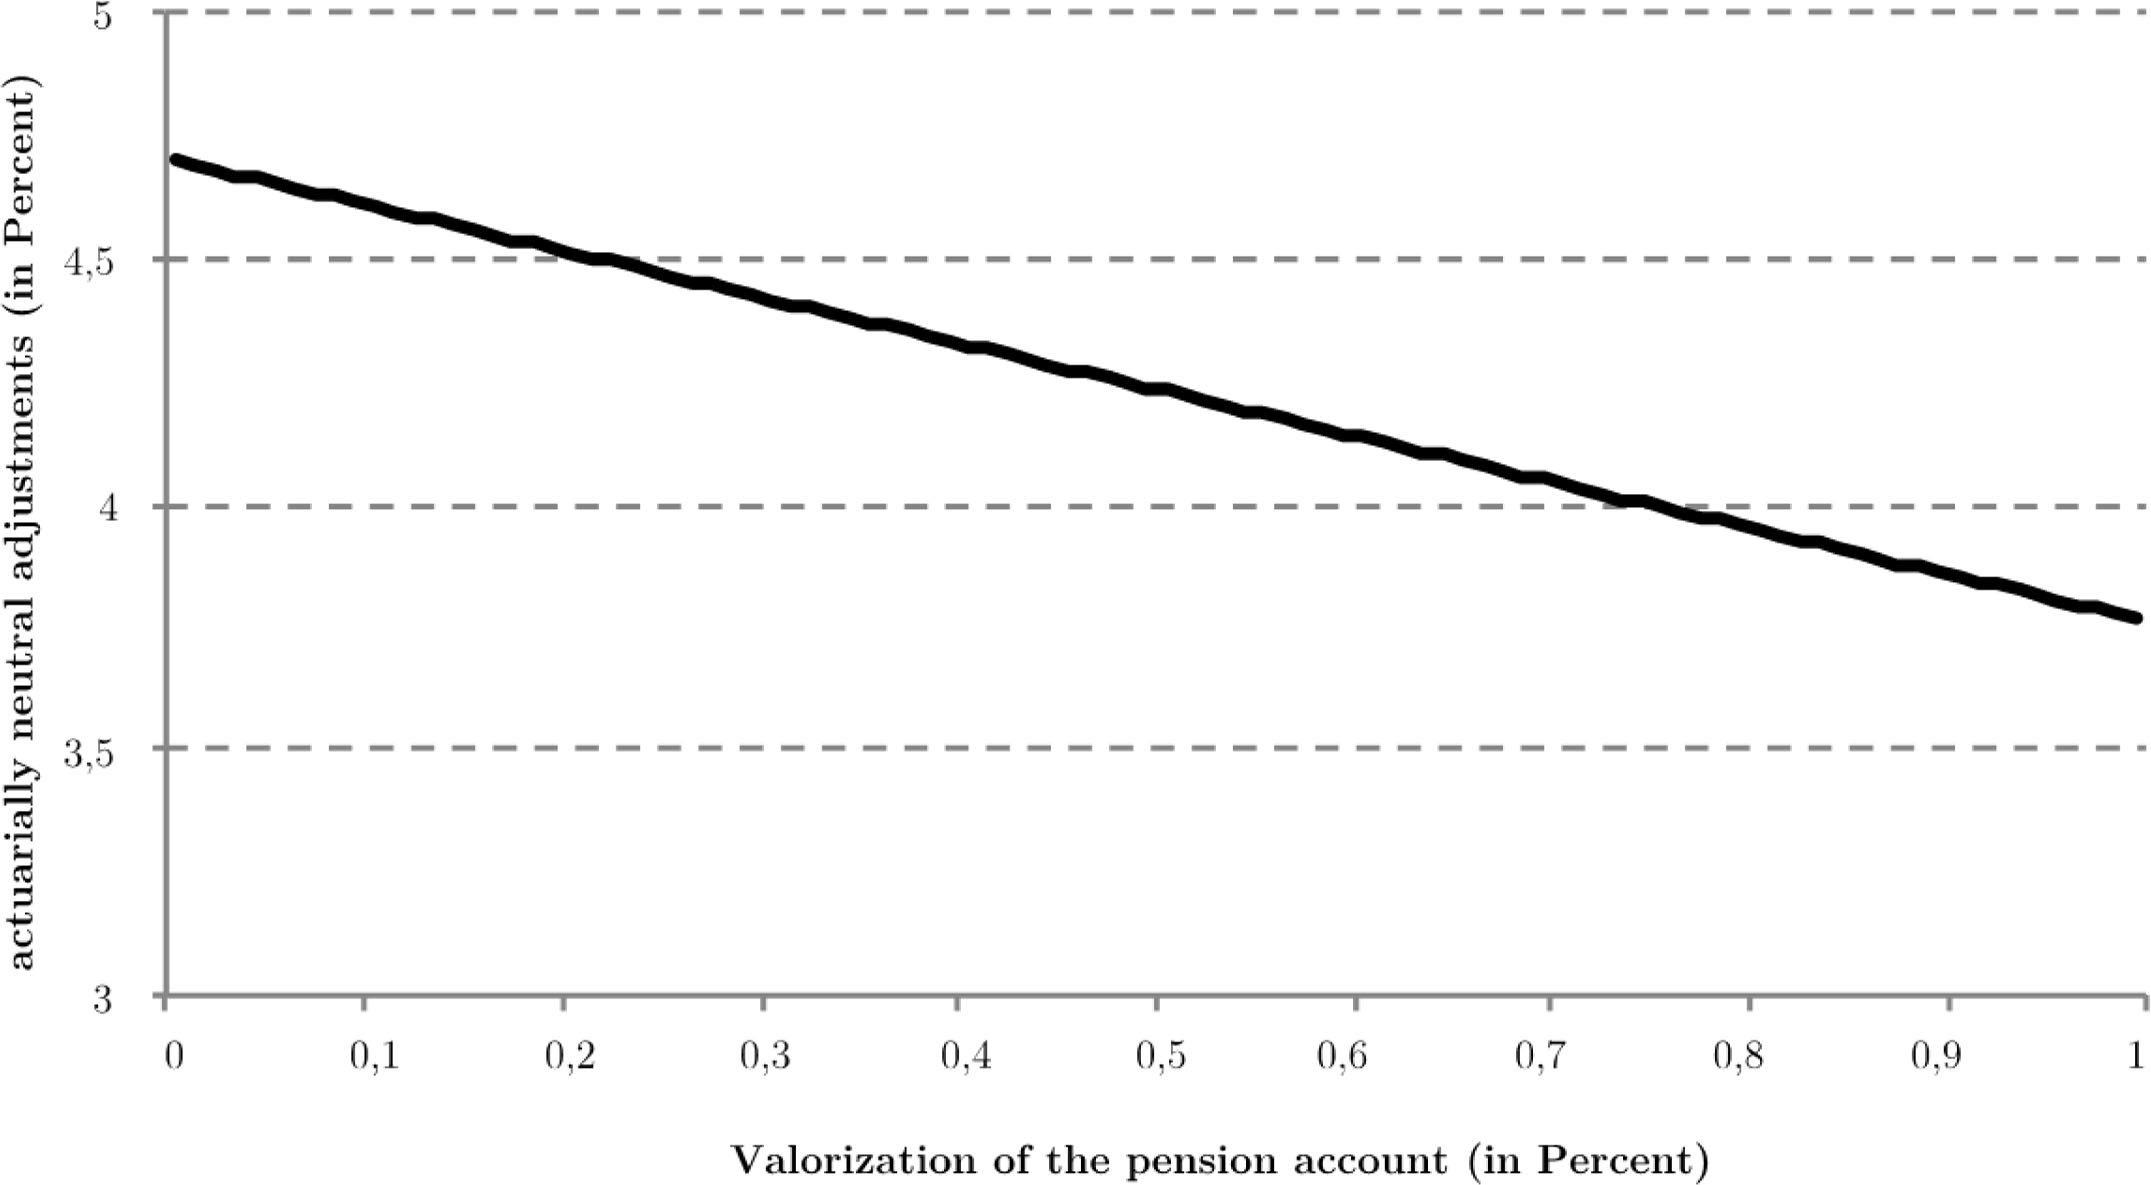
Figure 3
The effect of the valorization of the pension account on actuarially neutral adjustments
Table 7
The effect of the riskless interest rate on actuarially neutral decrements for baseline parametrization (in %)
| Riskless interest Rate | Age | ||
|---|---|---|---|
| 62 | 63 | 64 | |
| 1% | 3.58% | 3.94% | 4.30% |
| 1.5% | 3.93% | 4.35% | 4.76% |
| 2% | 4.22% | 4.68% | 5.14% |
Table A
Actuarially neutral deductions (based on gross pension entitlement) at different retirement ages (in %)
| Age | Wage | Pension account | ||
|---|---|---|---|---|
| (Low) | (Medium) | (High) | ||
| 62 | Low | 4.31% (± 0.21%) | 5.84% (± 0.22%) | 6.35% (± 0.22%) |
| Medium | 0.29% (± 0.16%) | 3.93% (± 0.19%) | 5.09% (± 0.21%) | |
| High | −1.40% (± 0.11%) | 3.15% (± 0.22%) | 4.58% (± 0.17%) | |
| 63 | Low | 4.74% (± 0.24%) | 6.46% (± 0.20%) | 7.02% (± 0.20%) |
| Medium | 0.43% (± 0.12%) | 4.35% (± 0.16%) | 5.62% (± 0.18%) | |
| High | −1.36% (± 0.10%) | 3.53% (± 0.18%) | 5.07% (± 0.18%) | |
| 64 | Low | 5.25% (± 0.15%) | 7.12% (± 0.23%) | 7.76% (± 0.24%) |
| Medium | 0.50% (± 0.14%) | 4.76% (± 0.19%) | 6.18% (± 0.22%) | |
| High | −1.37% (± 0.13%) | 3.86% (± 0.20%) | 5.56% (± 0.24%) | |
[i] Remark: The values in brackets are the differences based on the assumption that the mortality rate changes, according to a 10-year increase or decrease in the mortality tables.
Table B
Incentive-neutral deductions (based on net pension entitlement) at different retirement ages (in %)
| Age | Wage | Pension account | ||
|---|---|---|---|---|
| (Low) | (Medium) | (High) | ||
| 62 | Low | 4.32% (± 0.06%) | 7.82% (± 0.25%) | 7.29% (± 0.26%) |
| Medium | 0.60% (± 0.09%) | 5.39% (± 0.13%) | 5.97% (± 0.16%) | |
| High | −0.70% (± 0.20%) | 4.32% (± 0.23%) | 5.47% (± 0.22%) | |
| 63 | Low | 4.62% (± 0.17%) | 8.65% (± 0.22%) | 8.65% (± 0.13%) |
| Medium | 0.82% (± 0.15%) | 5.84% (± 0.20%) | 6.93% (± 0.21%) | |
| High | −0.56% (± 0.13%) | 4.74% (± 0.27%) | 6.21% (± 0.14%) | |
| 64 | Low | 5.40% (± 0.28%) | 9.50% (± 0.25%) | 9.59% (± 0.26%) |
| Medium | 1.06% (± 0.14%) | 6.45% (± 0.18%) | 7.58% (± 0.27%) | |
| High | −0.64% (± 0.23%) | 5.03% (± 0.31%) | 6.78% (± 0.21%) | |
[i] Remark: The values in brackets are the differences based on the assumption that the mortality rate changes, according to a 10-year increase or decrease in the mortality tables.