Figure 1.
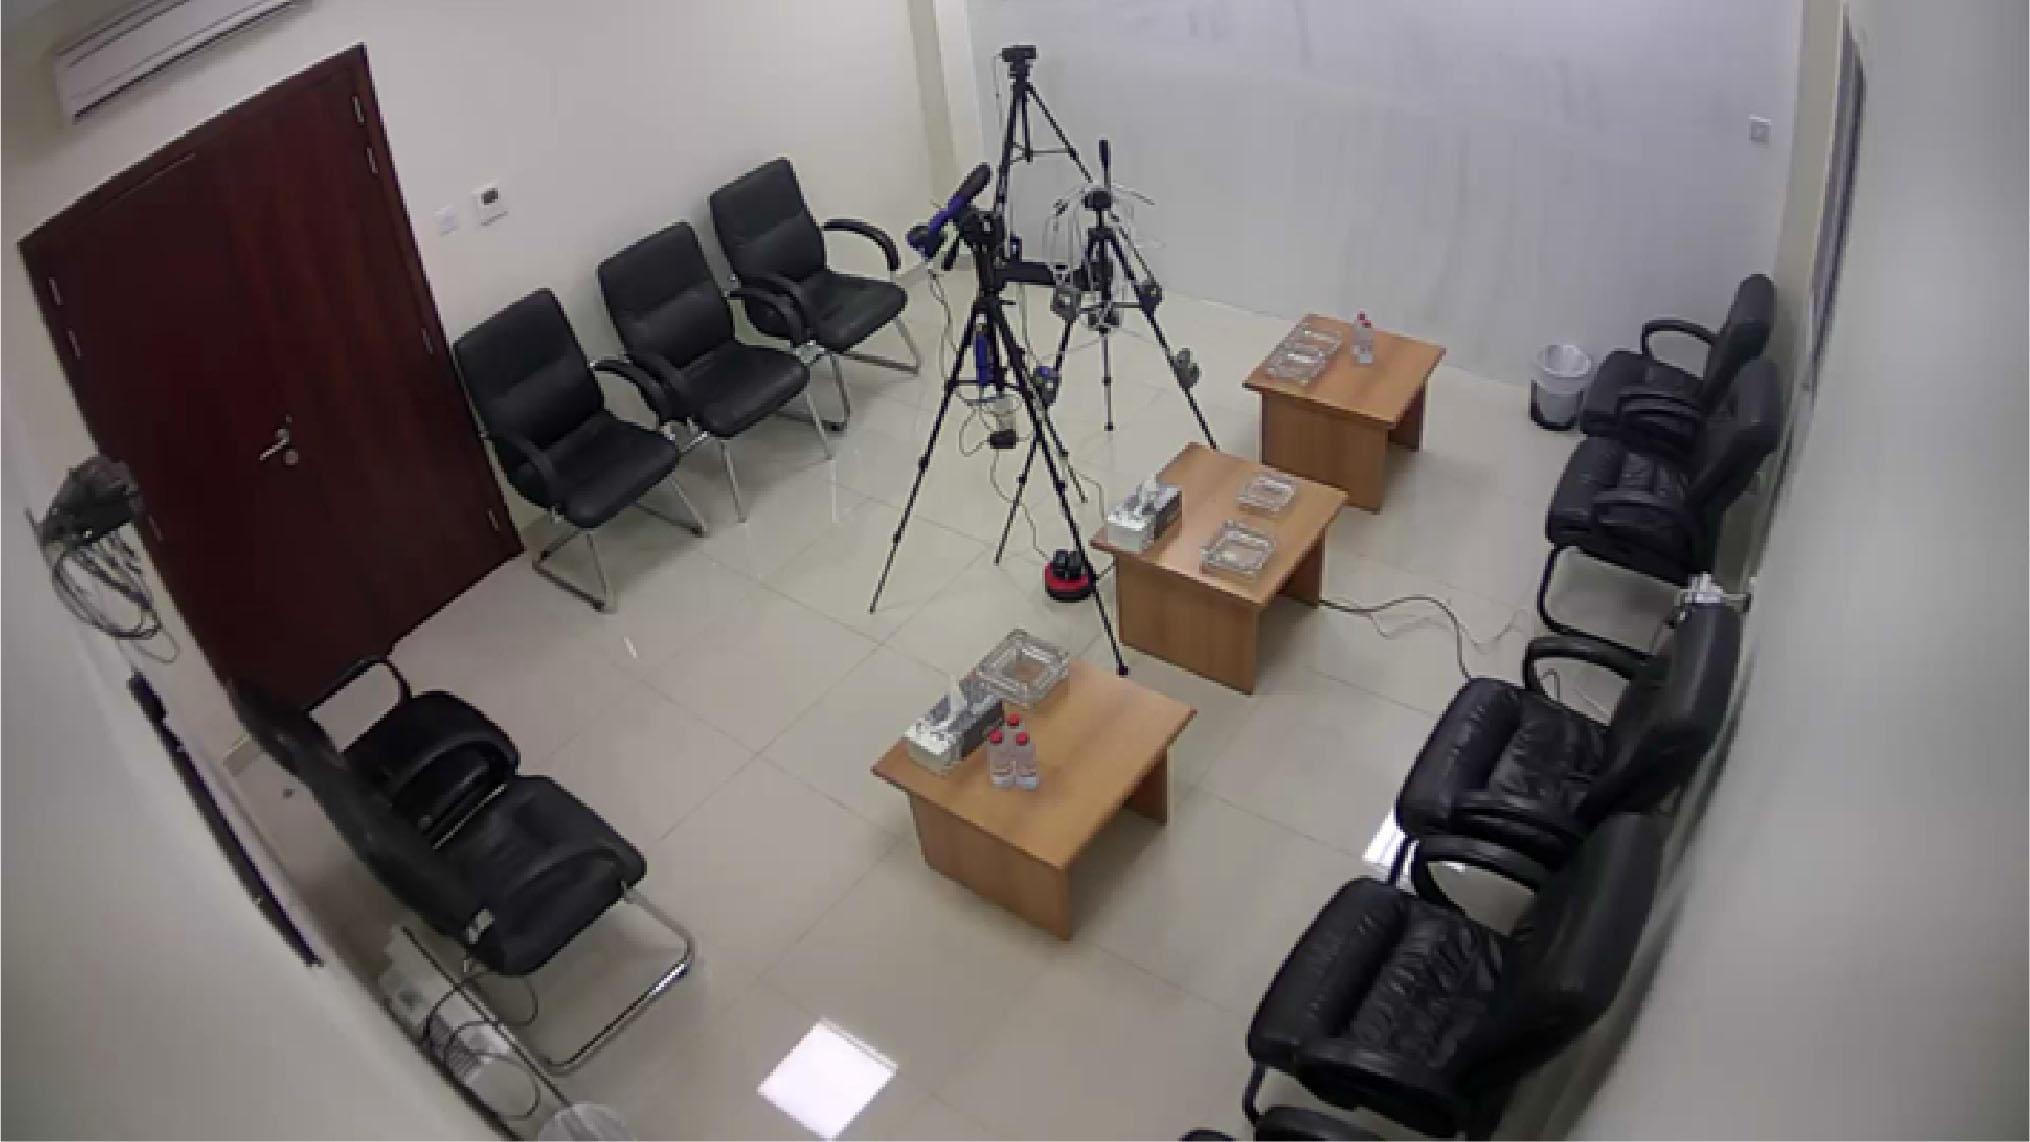
Levels of selected analytes in indoor air for the ten occupant scenarios_ Analytes shown are those assessed which were above the lower limit of quantification in at least one testing scenario_ For full raw and baseline-adjusted data for all analytes, refer to Supplementary Tables 3 and 5, respectively_ Analytes in bold are those mandated for lowering in cigarette smoke in the World Health Organization Study Group on Tobacco Product Regulation (TobReg) proposal (22)_ Data for the unoccupied baseline and ten-occupant baseline measurements are raw data_ For the scenarios in which ten occupants were in the testing room using the OOKA electronic waterpipe, using EVPs, or smoking cigarettes, data were normalised to the baseline analyte levels when ten occupants were in the testing room but refraining from the use of tobacco and nicotine products_ Data for the ten unattended waterpipes scenario, in which no participants were in the testing room, were normalised to the analyte levels during the unoccupied baseline measurement_
| Analyte/parameter (units) | LLOQ | Baseline-adjusted | |||||
|---|---|---|---|---|---|---|---|
| Unoccupied baseline | Baseline ten occupants | Ten occupants OOKA | Ten occupants EVPs | Ten unattended waterpipes | Ten occupants cigarettes | ||
| PM10 (μg/m3) | NA | 9.1 | 31.6 | 826.2 | 920.5 | 78.8 | 499.2 |
| PM2.5 (μg/m3) | NA | 5.6 | 8.3 | 803.5 | 886.8 | 78.8 | 497.6 |
| CO (ppm) | 0.3 | 2.2 | 2.2 | 1.2 | 0.2 | 160.0 | 25.8 |
| CO2 (ppm) | 1 | 717.7 | 2116.6 | 1480.7 | 225.7 | 3128.5 | 719.2 |
| Formaldehyde (μg/m3) | 0.1 | 6.7 | 20.0 | 7.0 | -7.0 | 1293.3 | 140.0 |
| Glycerol (μg/m3) | 0.1 | <0.1 | <0.1 | 5.1 | 7.0 | 10.9 | 1.2 |
| Metals | |||||||
| Copper (μg/m3) | 0.4 | <0.4 | 1.1 | -0.6 | -0.1 | 7.6 | 0.1 |
| Manganese (μg/m3) | 0.4 | <0.4 | 0.8 | -0.4 | -0.3 | 0.0 | 5.2 |
| VOCs | |||||||
| Dichloromethane (μg/m3) | 1.7 | <1.7 | <1.7 | 0.0 | 0.0 | 0.1 | 1.1 |
| Carbon disulphide (μg/m3) | 1.7 | 2.4 | 5.5 | -2.5 | 114.5 | 3.8 | 9.5 |
| Benzene (μg/m3) | 0.83 | <0.83 | <0.83 | 0.47 | 0.00 | 46.2 | 129.2 |
| Toluene (μg/m3) | 0.83 | 2.2 | 3.8 | 1.2 | 0.2 | 17.8 | 176.2 |
| Ethylbenzene (μg/m3) | 0.17 | 0.67 | 1.0 | 0.50 | 0.00 | 1.1 | 27.0 |
| Styrene (μg/m3) | 0.83 | 2.9 | 7.8 | -5.6 | -4.1 | -0.1 | 25.2 |
| Naphthalene (μg/m3) | 0.51 | 6.3 | 13.0 | 5.0 | 5.0 | 11.7 | 2.0 |
| n-Hexane (μg/m3) | 0.83 | 0.75 | 1.3 | -0.30 | 0.20 | 0.08 | 8.7 |
| Isopropanol (μg/m3) | 1.7 | 2.5 | 3.0 | 0.7 | 0.5 | 4.0 | 7.0 |
| Phenol (μg/m3) | 1.7 | <1.7 | <1.7 | 0.1 | 0.0 | 3.1 | 26.3 |
| Propylene glycol monomethyl ether (μg/m3) | 1.7 | <1.7 | <1.7 | 5.5 | 3.0 | 0.0 | 0.0 |
| Xylene (μg/m3) | 0.51 | 2.9 | 4.7 | 1.5 | -0.7 | 29.1 | 88.3 |
| PAHs | |||||||
| Acenaphthylene (μg/m3) | 0.083 | <0.083 | <0.083 | 0.00 | 0.00 | 0.00 | 0.25 |
| Acenaphthene (μg/m3) | 0.083 | <0.083 | <0.083 | 0.00 | 0.00 | 0.00 | 0.10 |
| Fluorene (μg/m3) | 0.083 | <0.083 | <0.083 | 0.00 | 0.00 | 0.00 | 0.15 |
| Phenanthrene (μg/m3) | 0.083 | <0.083 | <0.083 | 0.00 | 0.00 | 0.09 | 0.15 |
| TSNAs | |||||||
| NNN (μg/m3) | 0.009 | <0.009 | <0.009 | 0.00 | 0.00 | 0.00 | 0.058 |
| NAT (μg/m3) | 0.009 | <0.009 | <0.009 | 0.00 | 0.00 | 0.00 | 0.033 |
| NAB (μg/m3) | 0.009 | <0.009 | <0.009 | 0.00 | 0.00 | 0.00 | 0.005 |
| NNK (μg/m3) | 0.009 | <0.009 | <0.009 | 0.00 | 0.00 | 0.00 | 0.599 |
Levels of selected analytes in indoor air for the one occupant scenarios_ Analytes shown are those assessed which were above the lower limit of quantification in at least one testing scenario_ For full raw and baseline-adjusted data for all analytes, refer to Supplementary Tables 2 and 4, respectively_ Analytes in bold are those mandated for lowering in cigarette smoke in the World Health Organization Study Group on Tobacco Product Regulation (TobReg) proposal (22)_ Data for the unoccupied baseline and one occupant baseline measurements are raw data_ For the scenarios in which one occupant was in the testing room using the OOKA electronic waterpipe, using an EVP, or smoking cigarettes, data were normalised to the baseline analyte levels when one occupant was in the testing room but refraining from the use of tobacco and nicotine products_
| Analyte (units) | LLOQ | Baseline-adjusted | ||||
|---|---|---|---|---|---|---|
| Unoccupied baseline | Baseline one occupant | One occupant OOKA | One occupant EVP | One occupant waterpipe | ||
| PM10 (μg/m3) | NA | 9.1 | 12.1 | 313.4 | 24.1 | 500.4 |
| PM2.5 (μg/m3) | NA | 5.6 | 5.5 | 311.2 | 26.1 | 486.8 |
| CO (ppm) | 0.3 | 2.2 | 2.0 | 0.1 | 0.8 | 17.4 |
| CO2 (ppm) | 1 | 717.7 | 868.4 | 220.4 | 507.3 | 700.7 |
| Formaldehyde (μg/m3) | 0.1 | 6.7 | 6.7 | 6.3 | 0.0 | 26.3 |
| Glycerol (μg/m3) | 0.1 | <0.1 | <0.1 | 0.25 | 0.00 | 3.40 |
| Metals | ||||||
| Chromium (μg/m3) | 0.4 | <0.4 | 0.6 | 0.1 | 0.1 | 0.2 |
| Copper (μg/m3) | 0.4 | <0.4 | 0.9 | 0.2 | -0.1 | 0.4 |
| Manganese (μg/m3) | 0.4 | <0.4 | 0.6 | 0.2 | -0.2 | 0.1 |
| VOCs | ||||||
| Dichloromethane (μg/m3) | 1.7 | <1.7 | 3.0 | 2.3 | 0.3 | 5.3 |
| Carbon disulphide (μg/m3) | 1.7 | 2.4 | 25.0 | -20.0 | -21.7 | -11.0 |
| Chloroform (μg/m3) | 0.83 | <0.83 | <0.83 | 7.5 | 0.0 | 0.0 |
| Benzene (μg/m3) | 0.83 | <0.83 | <0.83 | 0.0 | 0.37 | 0.30 |
| Toluene (μg/m3) | 0.83 | 2.2 | 3.7 | 1.3 | 4.6 | 6.3 |
| Ethylbenzene (μg/m3) | 0.17 | 0.67 | 0.83 | 0.67 | 1.7 | 2.0 |
| Styrene (μg/m3) | 0.83 | 2.9 | 2.5 | 0.3 | -0.2 | 1.3 |
| Naphthalene (μg/m3) | 0.51 | 6.3 | 5.3 | 4.7 | 10.7 | 10.7 |
| n-Hexane (μg/m3) | 0.83 | 0.75 | 1.0 | 0.00 | 0.30 | 1.2 |
| Isopropanol (μg/m3) | 1.7 | 2.5 | 1.8 | 0.2 | 6.5 | 9.2 |
| Propylene glycol monomethyl ether (μg/m3) | 1.7 | <1.7 | 9.5 | 33.5 | -6.7 | 23.5 |
| Xylene (μg/m3) | 0.51 | 2.9 | 3.0 | 3.1 | 7.8 | 8.8 |