Figure 1.
Figure 2.
Figure 3.
Figure 5.
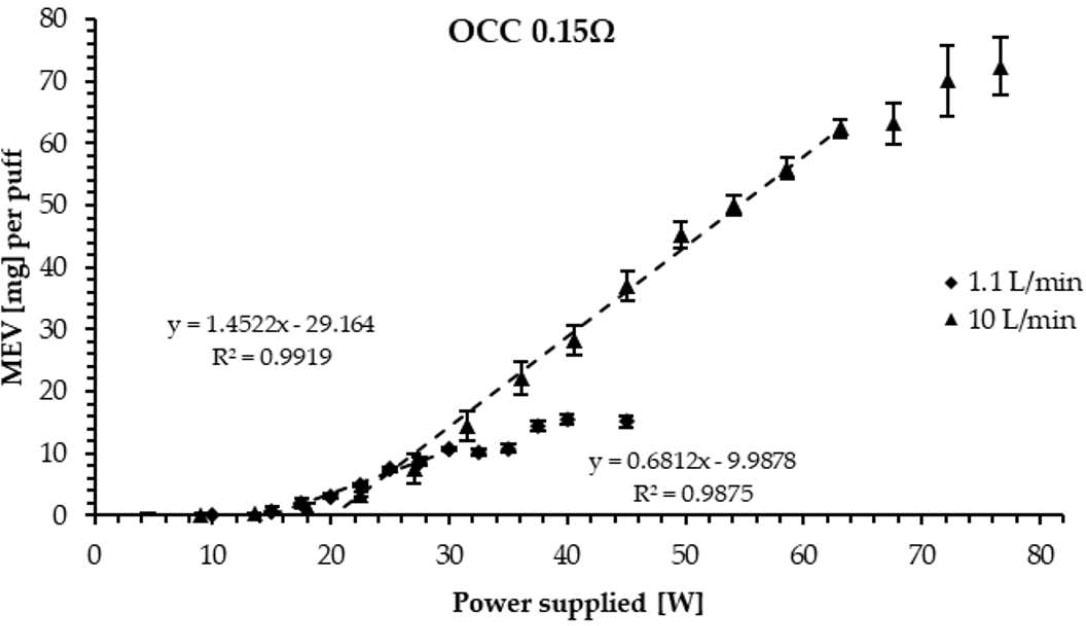
Figure 6
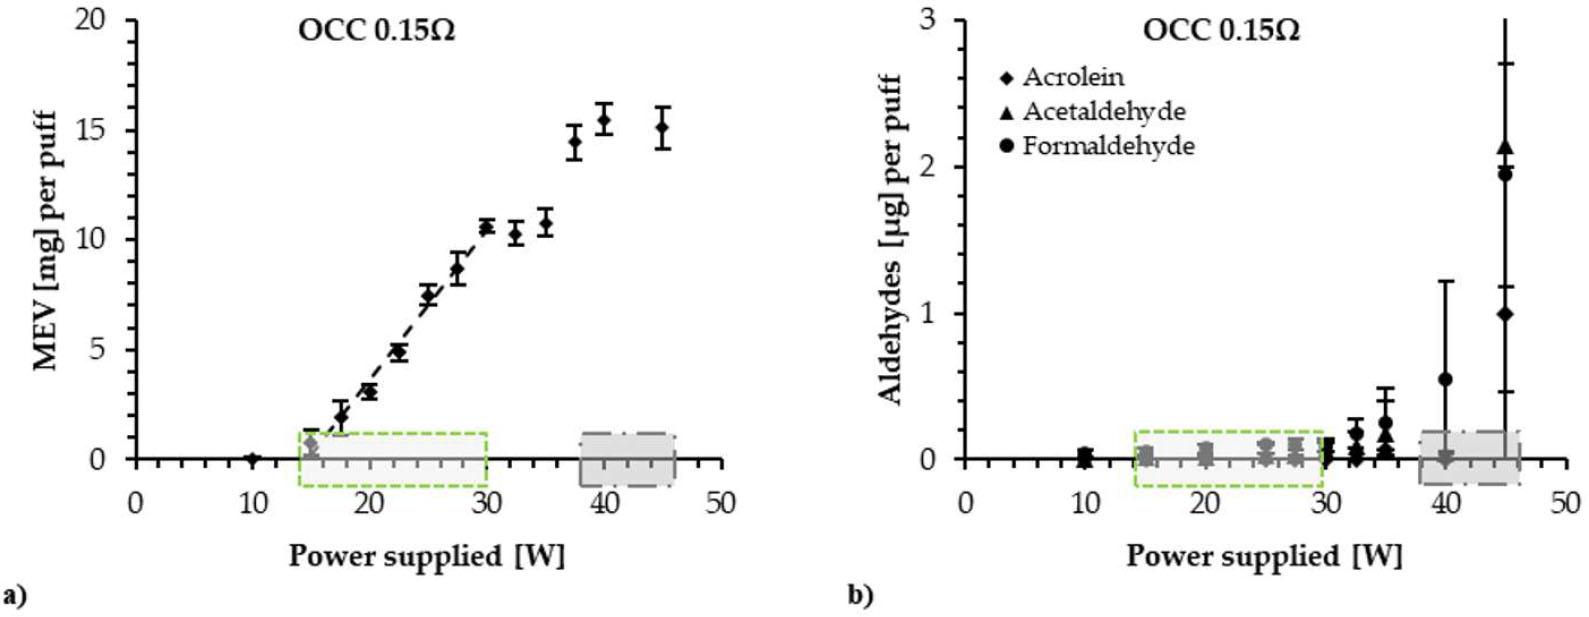
Figure 7.
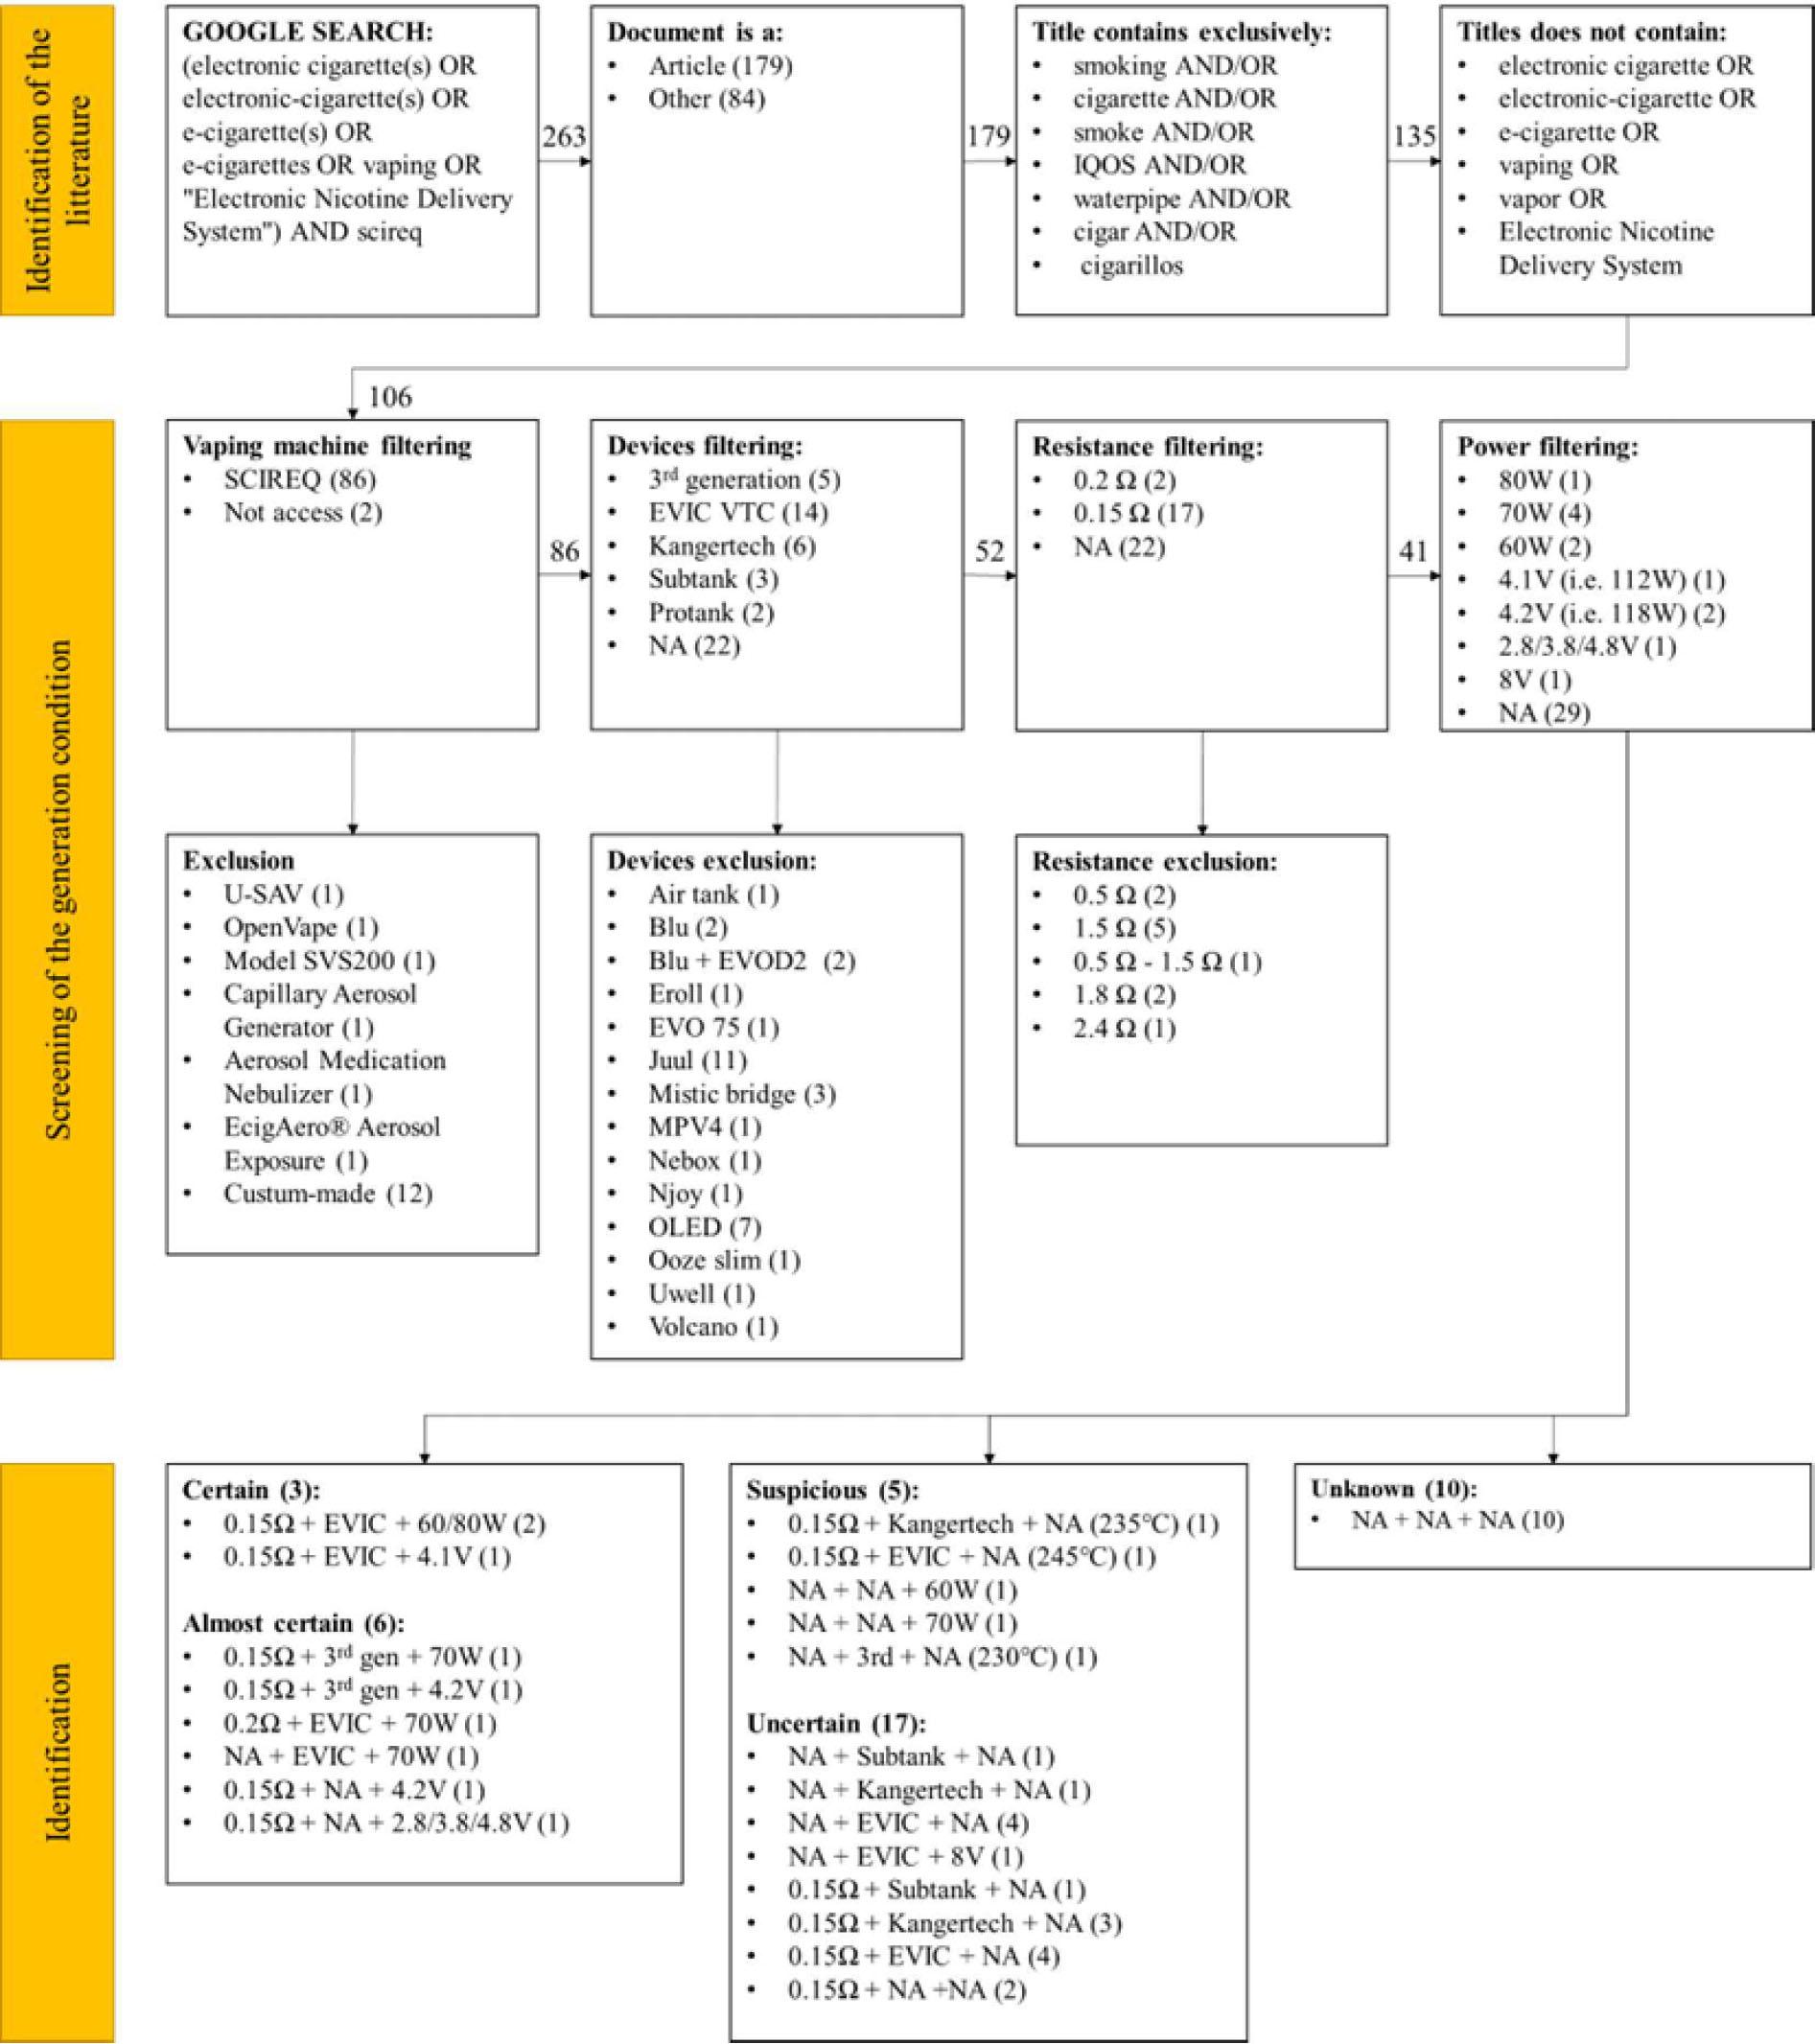
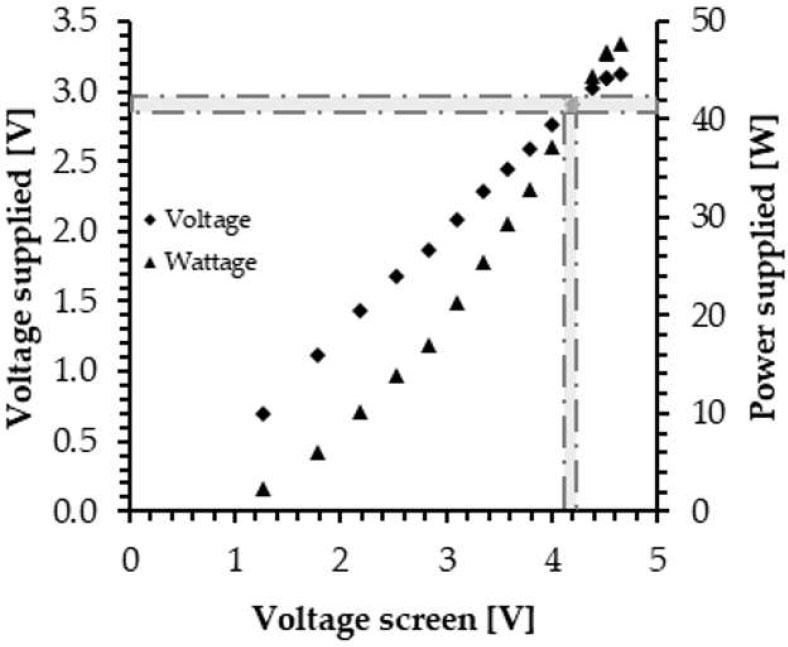
Figure 4.
Summary of the aldehydes quantified in the five articles reviewed_ Values were graphically determined_ Numbers in parentheses denote number of tests per flavor_
| Reference | Conditions | Aldehyde [μg] / puff | ||
|---|---|---|---|---|
| Acrolein | Acetaldehyde | Formaldehyde | ||
| But(1) (2.8 V) | 0.05 | 0.05 | 0.08 | |
| But(1) (3.8 V) | 3.5 | 15 | 3.5 | |
| (35) | But(1) (4.8 V) | 9.5 | 16 | 8 |
| Cin(2) (2.8 V) | NA | 0.17 | 0.10 | |
| Cin(2) (3.8 V) | NA | 0.33 | 0.18 | |
| Cin(2) (4.8 V) | NA | 0.39 | 0.02 | |
| (31) | Cin(2) (4.2 V) | NA | 0.386 | 0.021 |
| (29) | Men(3) (3 V) | 0.02 | 0.1 | 2.5 |
| CB(4) (3 V) | 10 | 4 | 13 | |
| (27) | Tob(5) (80 W) | 3.5 | 3.1 | NA |
| Men(3) (80 W) | 150 | 150 | NA | |
| 30/70 (4.2 V) | 0.8 | 0.7 | 3 | |
| 50/50 (4.2 V) | 0.15 | 3 | 7 | |
| 70/30 (4.2 V) | 0.9 | 2 | 7 | |
| Str(6.12) (4.2 V) | 0.01 | 0.6 | NA | |
| (34) | Str(6.18) (4.2 V) | 0.01 | 0.7 | NA |
| Van(7.12) (4.2 V) | 1.3 | 0.8 | 3.5 | |
| Van(7.18) (4.2 V) | 0.1 | 0.1 | 0.05 | |
| Cat(8.12) (4.2 V) | 0.2 | 0.2 | NA | |
| Cat(8.18) (4.2V) | 0.5 | 2 | 7 | |
Aerosol generation parameters of the 41 revised studies using the InExpose_ Power tested as declared by authors allegedly from display in the instrument screen of the box mod_ Six articles used nicotine concentrations above 30 mg/mL, 14 studies between 20 mg/mL and 30 mg/mL, 9 studies between 10 mg/mL and 20 mg/mL, 12 studies between 3 mg/mL and 10 mg/mL, while 11 studies did not use nicotine_ In 20 articles nicotine concentrations above the Tobacco Product Directive requirement of 20 mg/mL were reported_
| Reference | Nicotine (mg/mL) | PG/VG | Device | Coil (Ω) | Power tested (W) | Airflow (L/min) | |
|---|---|---|---|---|---|---|---|
| (27) | 0 and 6 | 50/50 | EVIC | 0.15 | 80 | 2.00 | |
| Certain | (28) | 0 and 18 | 60/30 10% w | EVIC | 0.15 | 112 (4.1 V) | 3 |
| (29) | 30 and 36 | 30/70 and 40/60 | E-Vic and pods | 0.15 | 60 (3 V) | 1.10 | |
| (30) | 50 | 50/50 | 3rd | 0.15 | 70 | 1.05 | |
| (31) | 36 | 50/50 | 3rd | 0.15 | 118 (4.2 V) | 1.10 | |
| Almost | (32) | 20 | 30/70 | EVIC | 0.2 | 70 | 1.40 |
| certain | (33) | 20 | 50/50 | EVIC | 0.2 | 70 | 2.00 |
| (34) | 12 and 18 | Varied | E-Vic and pods | 0.15 | 118 (4.2V) | 1.00 | |
| (35) | 36 | Varied | E-Vic and pods | 0.15; 0.5; 1.5 | 2.8; 3.8; 4.8 V | 1.10 | |
| (36) | NA | 30/70 | Kangertech | 0.15 | 235 °C | 1.27 | |
| (10) | 24 | 55/45 | EVIC | 0.15 | 245 °C | NA | |
| Suspicious | (37) | 0 | 50/50 | NA | NA | 60 | 1.22 |
| (38) | 24 | 50/50 | NA | NA | 70 | 1.05 | |
| (39) | 24 | 50/50 | 3rd | NA | 230 °C | NA (9 s) | |
| (40) | 24 | 50/50 | Subtank | NA | NA | NA (10 s) | |
| (41) | 0 and 18 | NA | KangerTech | NA | NA | 1.10 | |
| (42) | 50 | NA | EVIC | NA | NA | NA | |
| (43) | 50 | NA | EVIC | NA | NA | NA | |
| (44) | 0 and 25 | 100/0 | EVIC | 0.15 | NA | 1.27 | |
| (45) | 18 | 50/50 | EVIC | NA | NA | 1.10 | |
| (46) | 0 and 6 | 70/30 | Subtank | 0.15 | NA | NA | |
| (47) | 0 and 25 | NA | Kangertech | 0.15 | NA | 1.27 | |
| Uncertain | (48) | NA | 100/0 | EVIC | 0.15 | 70 (230 °C) | 1.00 |
| (49) | 0 and 18 | 55/35 10% w | EVIC | NA | NA | NA | |
| (50) | 0 | 50/50 | KangerTech | 0.15 | NA | 1.02 | |
| (51) | 0, 25, 33 | Varied | Kangertech | 0.15 | NA | 1.27 | |
| (52) | NA | 50/50 | EVIC | 0.15 | NA | 3.06 | |
| (53) | 25 | 100/0 | EVIC | 0.15 | NA | 1.4 | |
| (54) | 25 | 50/50 | NA | 0.15 | NA | 1.27 | |
| (55) | 25 | 50/50 | NA | 0.15 | NA | 1.27 | |
| (56) | 12 | 50/50 | EVIC | NA | NA (8V) | NA (3 s) | |
| (57) | 24 | 50/50 | NA | NA | NA | NA | |
| (58) | 6, 14, 18, 24 | 50/50 80/20 | NA | NA | NA | NA | |
| (59) | NA | 30/70 | NA | NA | NA | NA | |
| (60) | 0 | NA | NA | NA | NA | NA | |
| (61) | 0 | 70/30 | NA | NA | NA | 4.20 | |
| Unknown | (62) | 24 | 50/50 | NA | NA | NA | NA |
| (63) | 20 | 50/50 | NA | NA | NA | NA | |
| (64) | 4% of liquid | Varied | NA | NA | NA | 2.00 | |
| (65) | 0 and 4% mass | 50/50 | NA | NA | NA | 1.10 | |
| (66) | 20 | 30/70 | NA | NA | NA | 1.40 |