Figure 1.
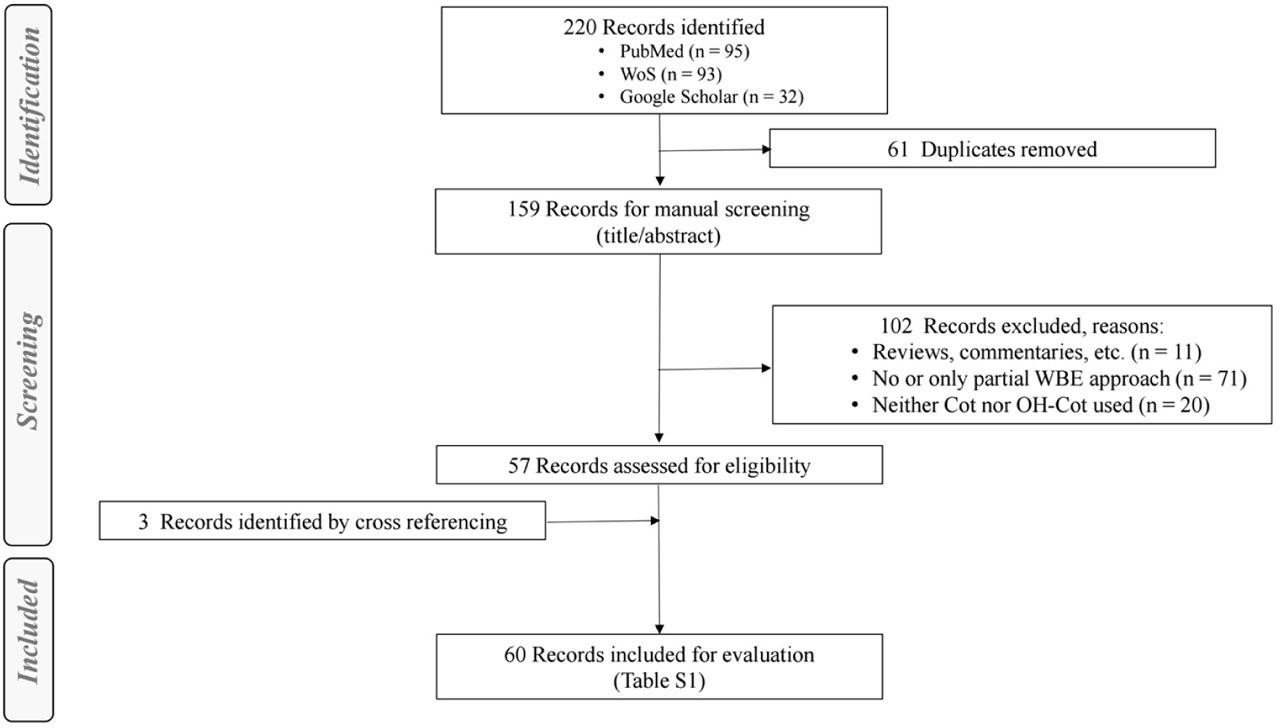
Figure 2.
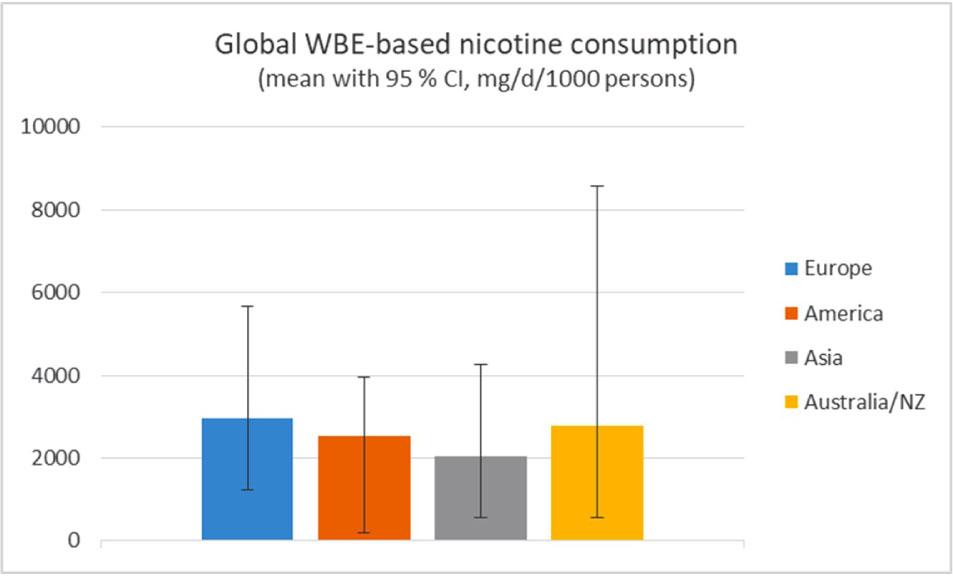
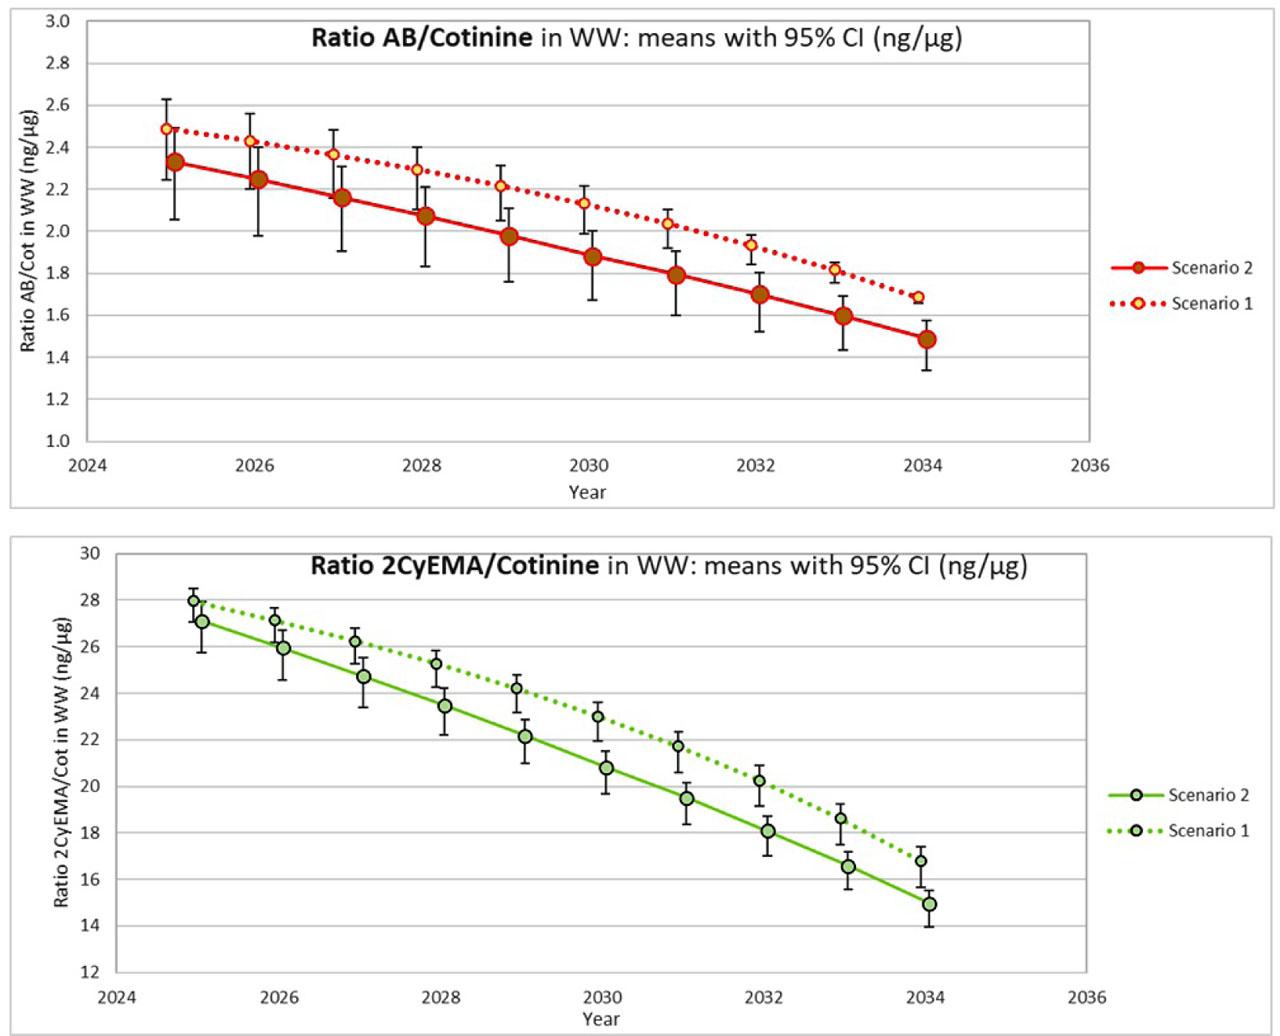
Figure 3.
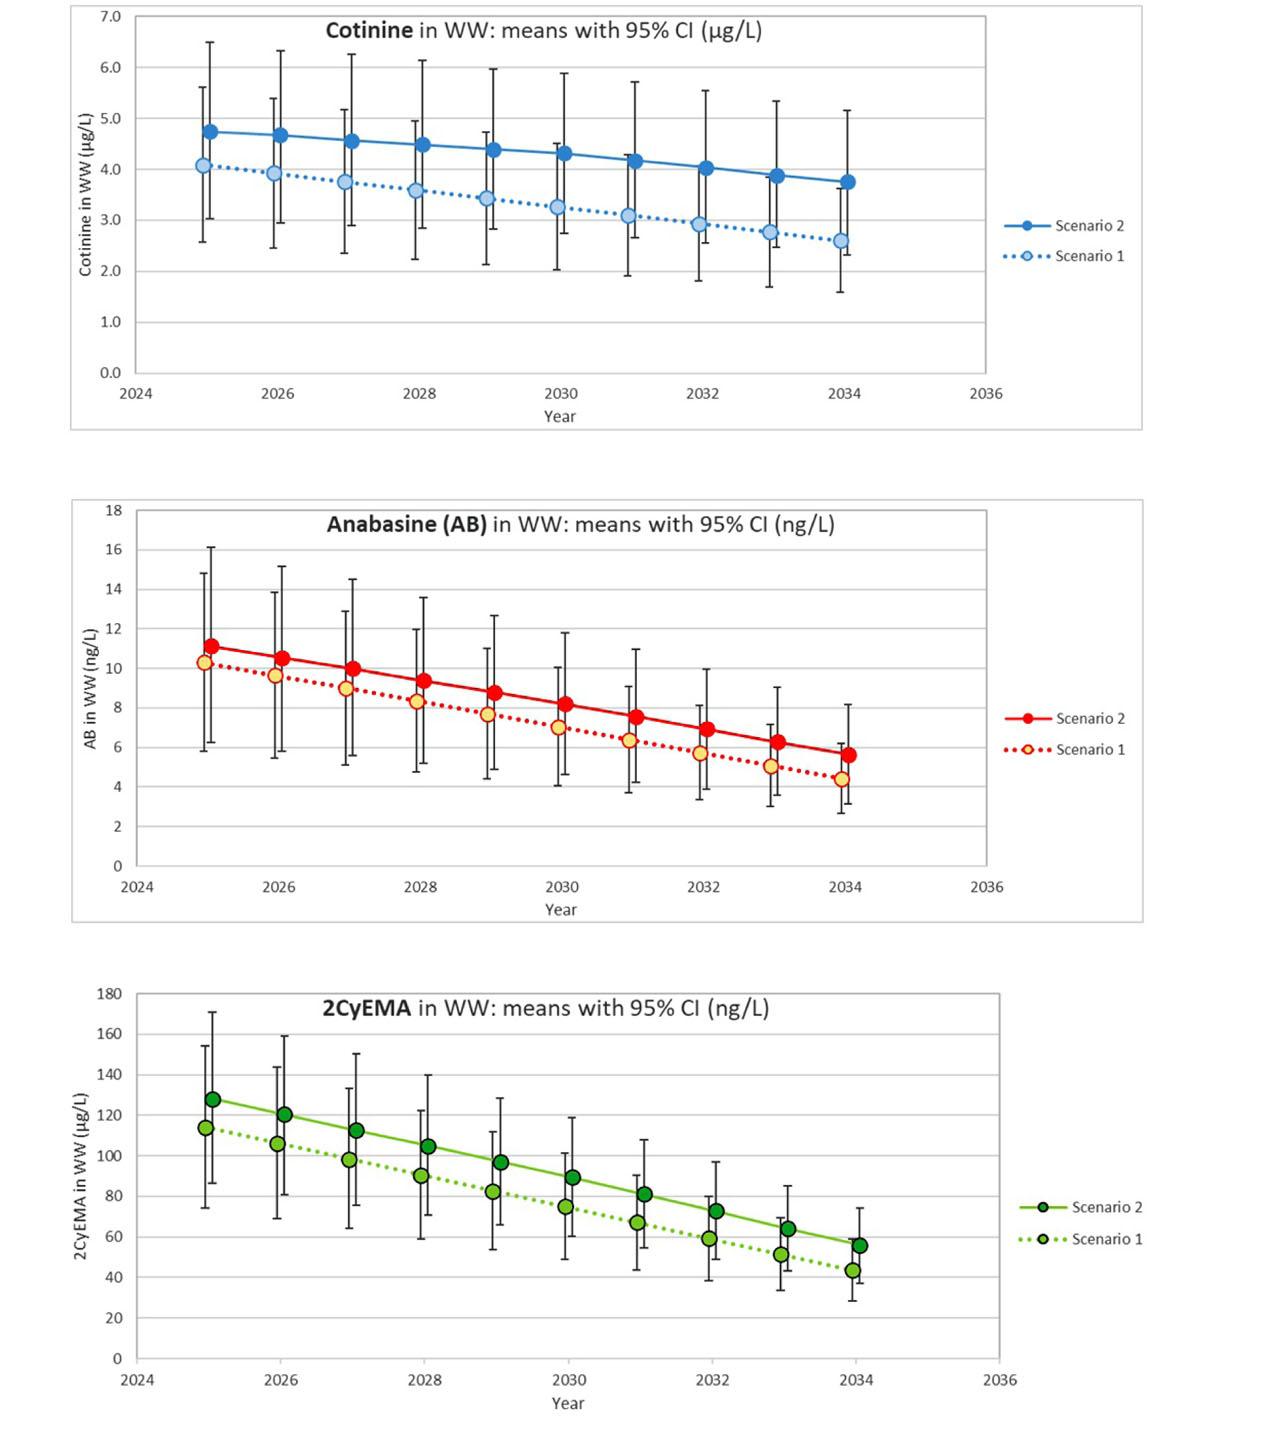
Figure 4.
Studies investigating long-term time trends for WBE-assessed tobacco/nicotine consumption_
| Study | Country | Period (years) | Time trends in nicotine consumption observed | Comparison to sales/surveys | Interpretation by authors |
|---|---|---|---|---|---|
| M | Australia | 2010–2017 (7 years) |
|
|
|
| B | Australia | 2015–2019 (4 years) |
|
|
|
| G | Italy | 2013–2015 (2 years) |
|
|
|
| Z | China | 2012–2017 (5 years) |
|
|
|
| G | China | 2014–2016 (2 years) |
|
|
|
| B | Lithuania | 2018–2019 (1 year) |
|
|
|
| C | Spain | 2018–2020 (2 years)* |
| * Contradictory statements for study period: 2014–2017 in the text |
|
| T | Australia | 2017–2020 (3 years) |
|
|
|
| W | Australia | 2013–2021 (8 years) |
|
|
|
Conditions and assumptions applied in two scenarios of Monte Carlo Simulations (MCSs) for WW concentrations of cotinine (Cot), anabasine (AB) and 2-cyanoethyl mercapturic acid (2CyEMA) of a hypothetical WWTP serving a large city_
| Input variables | Mean value (unit) | Uncertainty | Distribution | Assumptions and Rationale |
|---|---|---|---|---|
| Pop: Catchment population size of the WWTP | 1500000 | 15% | Normal |
|
| F: Flow rate of WWTP | 350,000,000 (L/d) | 15% | Normal |
|
| UERBM: Daily urinary excretion rates of the BMs | In the rows below, the group- and BM-specific UER values are listed. These are derived from a controlled study with 10 subjects per group (159, 160, 169). As uncertainty, the relative standard errors (RSE) are provided. Specifics are indicated in the last column. Most distributions are between normal and lognormal. As a first approach, normal distributions are assumed. It is assumed that UERs are valid for steady-state conditions. | |||
| UERCotCC | 5.736 (mg/d) | 18% | Normal | |
| UERCotEC | 2.309 (mg/d) | 23% | Normal | UECot values were obtained from reported nicotine equivalents (Nic+10) (160) assuming that Nic+10 represents 95% of the absorbed nicotine dose and that 32.3% are excreted as Cot (free + conjugated) (50) |
| UERCotHTP | 4.240 (mg/d) | 17% | Normal | |
| UERCotONP | 6.625 (mg/d) | 18% | Normal | No values for UERCotONP are available. It is assumed that the UER for ONP users is between those of CC and OT users. |
| UERCotNRT | 2.220 (mg/d) | 31% | Normal | There were mainly nicotine gum users in the controlled study (160) |
| UERCotOT | 7.174 (mg/d) | 19% | Normal | There were mainly snus users in the controlled study (160) |
| UERCotNU | 0.020 (mg/d) | 47% | Normal | |
| UERABCC | 14.6 (µg/d) | 21% | Normal | UERAB values were obtained from the published controlled study (169) |
| UERABEC | 0.50 (µg/d) | 25% | Normal | Outliers were excluded |
| UERABHTP | 2.51 (µg/d) | 22% | Normal | |
| UERABONP | 0.38 (µg/d) | 32% | Normal | No data for ONP were available, the UERAB values for NRT users were applied |
| UERABNRT | 0.38 (µg/d) | 32% | Normal | |
| UERABOT | 22.2 (µg/d) | 50% | Normal | There were mainly snus users in the controlled study (160) |
| UERABNU | 0.21 (mg/d) | 12% | Normal | |
| UER2CyEMACC | 186.4 (µg/d) | 18% | Normal | UER2CyEMA values were obtained from the published controlled study (159) |
| UER2CyEMAEC | 2.52 (µg/d) | 39% | Normal | |
| UER2CyEMAHTP | 14.00 (µg/d) | 28% | Normal | |
| UER2CyEMAONP | 0.58 (µg/d) | 6% | Normal | |
| UER2CyEMANRT | 0.58 (µg/d) | 6% | Normal | Due to obvious outliers, UER2CyEMA values of NU were used |
| UER2CyEMAOT | 0.58 (µg/d) | 6% | Normal | |
| UER2CyEMANU | 0.58 (µg/d) | 6% | Normal | |
| UER for DU (only in Scenario 2) | It is assumed that DUs (simultaneous use of CCs and ECs) exhibit the same daily nicotine uptake as CCs do and would have the same UERCot. For a 20 CPD (cigarettes per day) smoker this could be achieved by reducing the consumption to 10 CPD (= 50% reduction) and simultaneously carry out 25 EC sessions per day. UERABDU and UER2CyEMADU were therefore reduced by 50% compared to the corresponding UER levels for CC-only users. | |||
Population-normalized consumption of nicotine (PNC, mg/d/1000 persons) based on Cot or Cot + OH-Cot levels in WW reported in 170 data sets from 60 publications_
| All | Europe | America | Asia | Australia/New Zealand | |
|---|---|---|---|---|---|
| N (data sets) | 170 | 107 | 18 | 20 | 25 |
| Mean | 2769 | 2947 | 2543 | 2028 | 2763 |
| SD | 1866 | 1428 | 1112 | 1543 | 3480 |
| Median | 2394 | 2650 | 2673 | 1442 | 1800 |
| 5% Percentile | 807 | 1227 | 189 | 564 | 571 |
| 95% Percentile | 5633 | 5673 | 3940 | 4262 | 8588 |
| Min | 86 | 669 | 162 | 440 | 86 |
| Max | 17000 | 7056 | 4433 | 7034 | 17000 |