
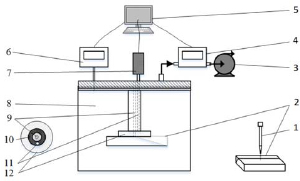
Figure 1.
Structure of an airtightness assessing system.
1) punching device; 2) pack of HTPs; 3) deflation pump; 4) gas flowmeter; 5) program control system; 6) differential pressure gauge; 7) vacuum generator; 8) testing chamber; 9) ventilation channel; 10) vacuum area; 11) vacuum channel; 12) sucker.
Table 1.
Accuracy results obtained with air permeable disks.
| Disk | 1 (kPa) | 2 (kPa) | 3 (kPa) | 4 (kPa) | 5 (kPa) |
|---|---|---|---|---|---|
| 1 | 0.07 | 1.11 | 3.25 | 5.13 | 8.04 |
| 2 | 0.08 | 1.11 | 3.27 | 5.13 | 8.05 |
| 3 | 0.07 | 1.11 | 3.27 | 5.14 | 8.06 |
| 4 | 0.06 | 1.11 | 3.27 | 5.13 | 8.07 |
| 5 | 0.07 | 1.11 | 3.27 | 5.13 | 8.08 |
| 6 | 0.05 | 1.12 | 3.27 | 5.13 | 8.06 |
| 7 | 0.07 | 1.11 | 3.27 | 5.14 | 8.08 |
| 8 | 0.07 | 1.11 | 3.27 | 5.14 | 8.10 |
| 9 | 0.07 | 1.11 | 3.27 | 5.12 | 8.11 |
| 10 | 0.07 | 1.12 | 3.26 | 5.14 | 8.11 |
| Mean | 0.07 | 1.11 | 3.27 | 5.13 | 8.08 |
| SD | 0.008 | 0.004 | 0.007 | 0.011 | 0.025 |
| r | 0.030 | 0.010 | 0.020 | 0.040 | 0.070 |
| cv | 0.118 | 0.004 | 0.002 | 0.002 | 0.003 |
Table 2.
Results obtained with HTP packs.
| HTP packs | Sample C1 (kPa) | Sample C2 (kPa) | Sample M1 (kPa) | Sample M2 (kPa) | Sample T1 (kPa) | Sample T2 (kPa) |
|---|---|---|---|---|---|---|
| 1 | 6.26 | 3.56 | 1.40 | 2.33 | 4.20 | 3.69 |
| 2 | 6.14 | 3.56 | 1.39 | 2.35 | 4.18 | 3.54 |
| 3 | 6.15 | 3.55 | 1.37 | 2.37 | 4.18 | 3.54 |
| 4 | 6.06 | 3.54 | 1.40 | 2.39 | 4.17 | 3.57 |
| 5 | 6.04 | 3.54 | 1.40 | 2.40 | 4.21 | 3.46 |
| 6 | 6.03 | 3.52 | 1.40 | 2.42 | 4.30 | 3.46 |
| 7 | 6.04 | 3.53 | 1.39 | 2.44 | 4.33 | 3.64 |
| 8 | 6.01 | 3.53 | 1.42 | 2.42 | 4.34 | 3.57 |
| 9 | 5.98 | 3.52 | 1.33 | 2.44 | 4.38 | 3.51 |
| 10 | 6.02 | 3.50 | 1.36 | 2.45 | 4.38 | 3.42 |
| Mean | 6.07 | 3.54 | 1.39 | 2.40 | 4.27 | 3.54 |
| SD | 0.085 | 0.019 | 0.026 | 0.041 | 0.087 | 0.083 |
| r | 0.280 | 0.060 | 0.090 | 0.120 | 0.210 | 0.270 |
| cv | 0.014 | 0.005 | 0.019 | 0.017 | 0.020 | 0.023 |
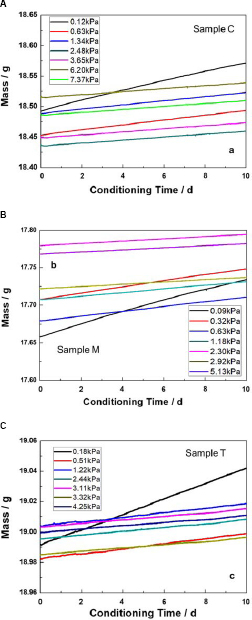
Figure 2.
The airtightness as well as the sample mass during 10 days of conditioning at 22 °C, 60% relative humidity.
A) Sample C; B) Sample M; C) Sample T.
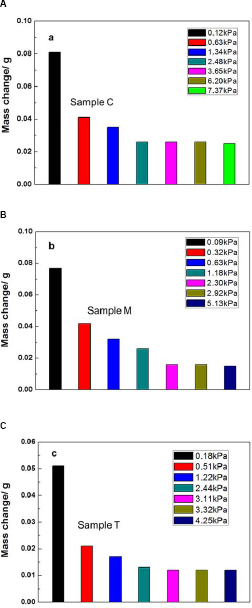
Figure 3.
The airtightness as well as the mass change after 10 days of conditioning at 22 °C, 60% relative humidity.
A) Sample C; B) Sample M; C) Sample T.