
Figure 1.
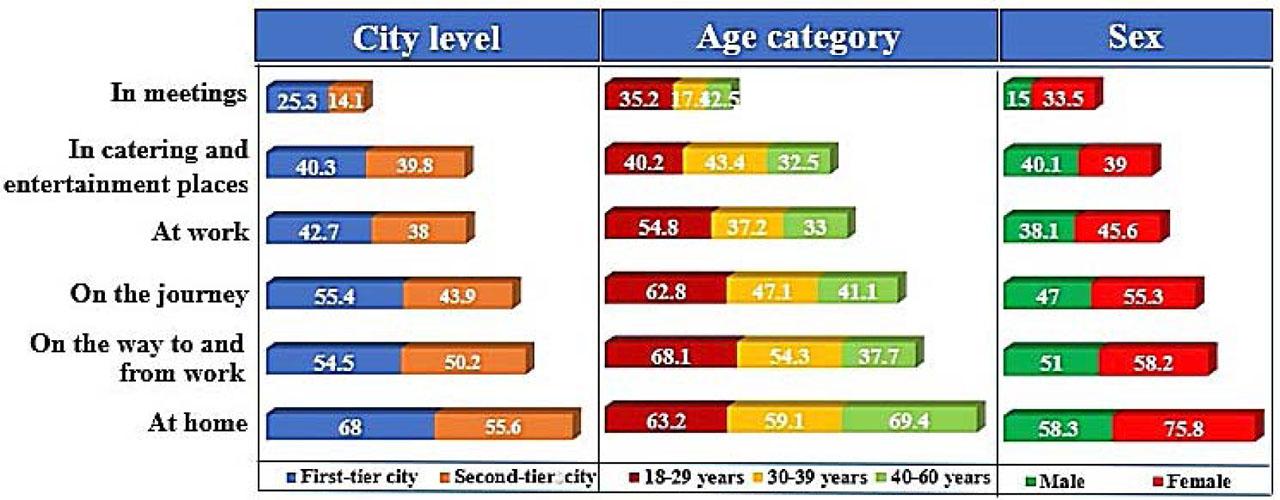
Figure 2.
Figure 3.
Figure 4.

Prevalence of various types of tobacco products_
| Category | City tier | Age group | Sex | ||||||
|---|---|---|---|---|---|---|---|---|---|
| All (%) | First-tier (%) | Second-tier (%) | Third-tier (%) | 18–29 (%) | 30–39 (%) | 40–60 (%) | Male (%) | Female (%) | |
| Cigarette | 91.5 | 95.1 | 89.2 | 90.2 | 93.2 | 90.3 | 90.8 | 91.4 | 91.8 |
| E-cigarette | 18.5 | 21.7 | 19.6 | 14.1 | 21.8 | 18.1 | 11.4 | 16.3 | 25.0 |
| Cigar | 9.8 | 13.1 | 9.7 | 6.6 | 8.7 | 10.9 | 9.7 | 9.8 | 9.9 |
| Heated tobacco product (HTP) | 3.4 | 3.9 | 3.4 | 2.9 | 3.1 | 3.9 | 2.8 | 3.0 | 4.6 |
| Waterpipe | 2.7 | 2.1 | 3.1 | 3.0 | 2.3 | 3.0 | 3.0 | 2.8 | 2.4 |
| Roll-your-own cigarette | 2.6 | 1.9 | 3.0 | 3.0 | 2.7 | 2.7 | 2.6 | 2.6 | 2.8 |
| Tobacco pipe | 2.3 | 0.9 | 2.9 | 3.2 | 1.9 | 2.1 | 4.4 | 2.6 | 1.6 |
| Smokeless tobacco (ST) | 2.1 | 2.8 | 2.5 | 0.9 | 2.1 | 2.0 | 2.1 | 1.9 | 2.6 |
| Number of participants | 3000 | 1000 | 1000 | 1000 | 1156 | 1361 | 483 | 2246 | 754 |
User concerns about smokeless tobacco (ST) products_
| Category | All (%) | City Tier | Age category (years) | Sex | ||||
|---|---|---|---|---|---|---|---|---|
| First-tier (%) | Second-tier (%) | 18–29 (%) | 30–39 (%) | 40–60 (%) | Male (%) | Female (%) | ||
| Taste and feel | 49.2 | 44.7 | 53.6 | 40.3 | 51.0 | 54.3 | 52.1 | 40.2 |
| Convenience of carrying | 38.5 | 42.2 | 35.0 | 46.7 | 37.8 | 32.4 | 38.5 | 41.5 |
| Taste | 38.1 | 34.3 | 42.5 | 35.4 | 38.0 | 40.2 | 39.3 | 35.5 |
| Word-of-mouth | 36.3 | 41.0 | 32.3 | 52.7 | 31.2 | 33.3 | 34.8 | 44.3 |
| Brand | 23.8 | 28.1 | 18.4 | 30.1 | 23.1 | 21.6 | 23.0 | 25.2 |
| Ease of purchase | 23.0 | 18.5 | 27.3 | 18.4 | 25.7 | 23.0 | 26.4 | 14.9 |
| Physiological strength (nicotine content) | 21.8 | 24.3 | 20.6 | 21.1 | 22.8 | 22.2 | 24.2 | 16.0 |
| The smell of the product before use | 20.2 | 18.1 | 23.2 | 18.0 | 18.3 | 27.8 | 20.1 | 21.2 |
| Production place | 19.5 | 24.6 | 14.4 | 30.9 | 20.7 | 10.5 | 17.5 | 26.1 |
| Package | 15.9 | 18.5 | 14.1 | 16.7 | 15.1 | 18.3 | 18.9 | 10.7 |
| Pipe shape | 11.1 | 12.3 | 10.0 | 10.6 | 11.2 | 12.1 | 12.3 | 9.6 |
| Overall (number) | 801 | 400 | 401 | 176 | 427 | 198 | 600 | 201 |
Nicotine content preference for smokeless tobacco (ST) products_
| Nicotine content (mg/g) | All (%) | City tier | Age category (years) | Sex | ||||
|---|---|---|---|---|---|---|---|---|
| First-tier (%) | Second-tier (%) | 18–29 (%) | 30–39 (%) | 40–60 (%) | Male (%) | Female (%) | ||
| 41–50 | 3.5 | 1.0 | 4.8 | 1.3 | 3.6 | 2.3 | 2.2 | 6.2 |
| 31–40 | 0.8 | 0.0 | 1.1 | 0.0 | 1.4 | 1.2 | 0.0 | 2.7 |
| 21–30 | 9.9 | 7.0 | 13.1 | 9.5 | 7.9 | 13.8 | 11.0 | 6.1 |
| 11–20 | 27.5 | 24.7 | 30.8 | 32.2 | 27.2 | 26.0 | 31.0 | 16.8 |
| 1–10 | 58.6 | 67.3 | 50.2 | 57.0 | 60.9 | 55.7 | 55.8 | 69.2 |
| Average (mg/g) | 11.54 | 10.00 | 13.10 | 10.53 | 11.43 | 12.69 | 11.64 | 11.27 |
| Overall (number) | 801 | 400 | 401 | 176 | 427 | 198 | 600 | 201 |
Degree of nicotine dependence based on the Fagerström Test for Nicotine Dependence - Smokeless Tobacco (FTND-ST)_
| Degree of dependence | All | City tier | Age category (years) | Sex | ||||
|---|---|---|---|---|---|---|---|---|
| First-tier (%) | Second-tier (%) | 18–29 (%) | 30–39 (%) | 40–60 (%) | Male (%) | Female (%) | ||
| Very low | 9.4 | 12.7 | 7.4 | 4.0 | 14.1 | 4.0 | 10.8 | 5.0 |
| Low | 21.0 | 19.0 | 22.2 | 16.5 | 20.6 | 25.8 | 23.0 | 14.9 |
| Moderate | 19.9 | 20.3 | 19.6 | 16.5 | 22.5 | 17.2 | 16.8 | 28.9 |
| High | 43.3 | 43.7 | 43.1 | 55.1 | 36.3 | 48.0 | 41.3 | 49.3 |
| Extremely high | 6.5 | 4.3 | 7.8 | 8.0 | 6.6 | 5.1 | 8.1 | 2.0 |
| Average score | 5.29 | 5.14 | 5.38 | 5.90 | 5.03 | 5.30 | 5.20 | 5.56 |
| Overall (number) | 801 | 400 | 401 | 176 | 427 | 198 | 600 | 201 |
Proportion of mixed use of different tobacco products_
| Category | Dual use (%) | Triple use (%) | ||||
|---|---|---|---|---|---|---|
| Cigarette | 57.60 | / | 63.48 | 60.77 | 39.10 | 53.56 |
| E-cigarette | / | 42.50 | 36.52 | / | 29.10 | 24.62 |
| Smokeless tobacco (ST) | 42.40 | 57.50 | / | / | 31.70 | / |
| Heated tobacco product (HTP) | / | / | / | 39.03 | / | 21.82 |
Composition of smokeless tobacco (ST) users_
| Characteristics of tobacco users | Category | Users (%) | Non-users (%) |
|---|---|---|---|
| Sex | Female | 32.1 | 25.0 |
| Male | 67.9 | 75.0 | |
| Age | 18–29 years | 30.6 | 38.7 |
| 30–39 years | 53.3 | 45.2 | |
| 40–60 years | 16.1 | 16.1 | |
| Household income (per month) | < 10,000 RMB (< 1,533 USD) | 3.2 | 18.2 |
| 10,000–19,999 RMB (1,533–3,065 USD) | 45.1 | 46.6 | |
| 20,000–29,999 RMB (3,065–4,598 USD) | 46.8 | 27.2 | |
| > 30,000 RMB (> 4,598 USD) | 4.8 | 7.9 | |
| Education | College degree below | 8.5 | 0.2 |
| College degree | 18.5 | 5.2 | |
| Bachelor degree | 65.3 | 84.9 | |
| Master degree or above | 7.7 | 9.7 | |
| Total (number) | 62 | 2938 |