
Figure 1.
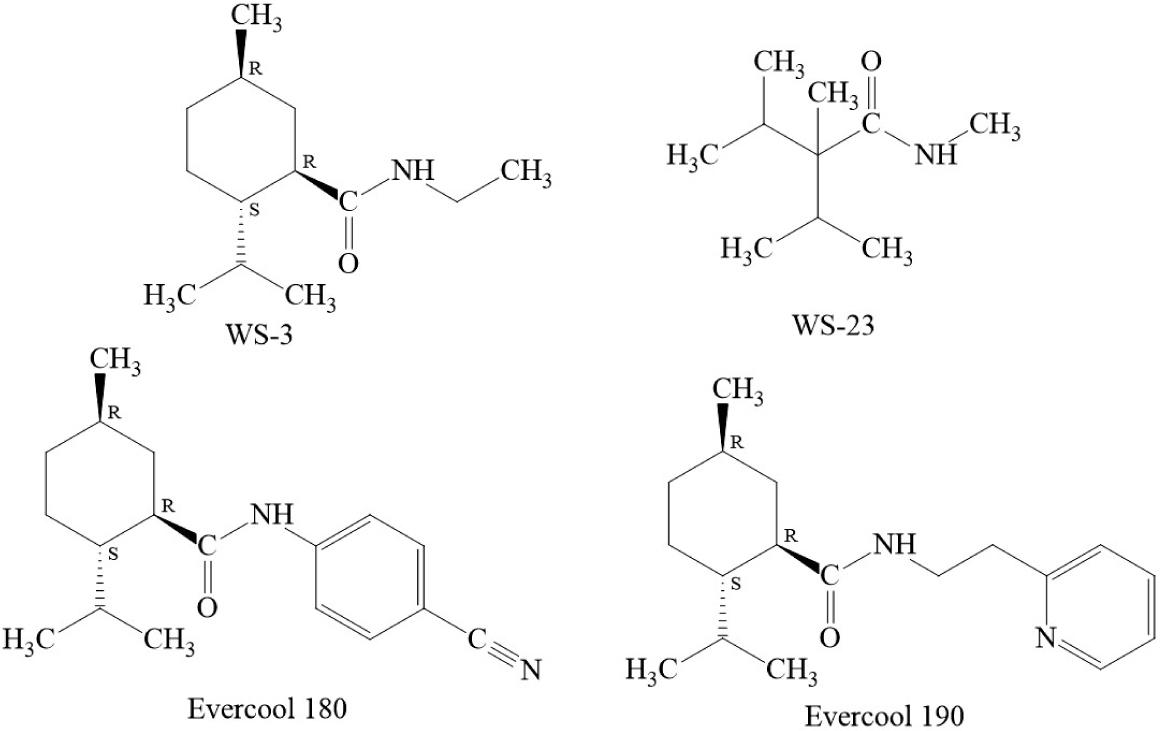
Figure 2.
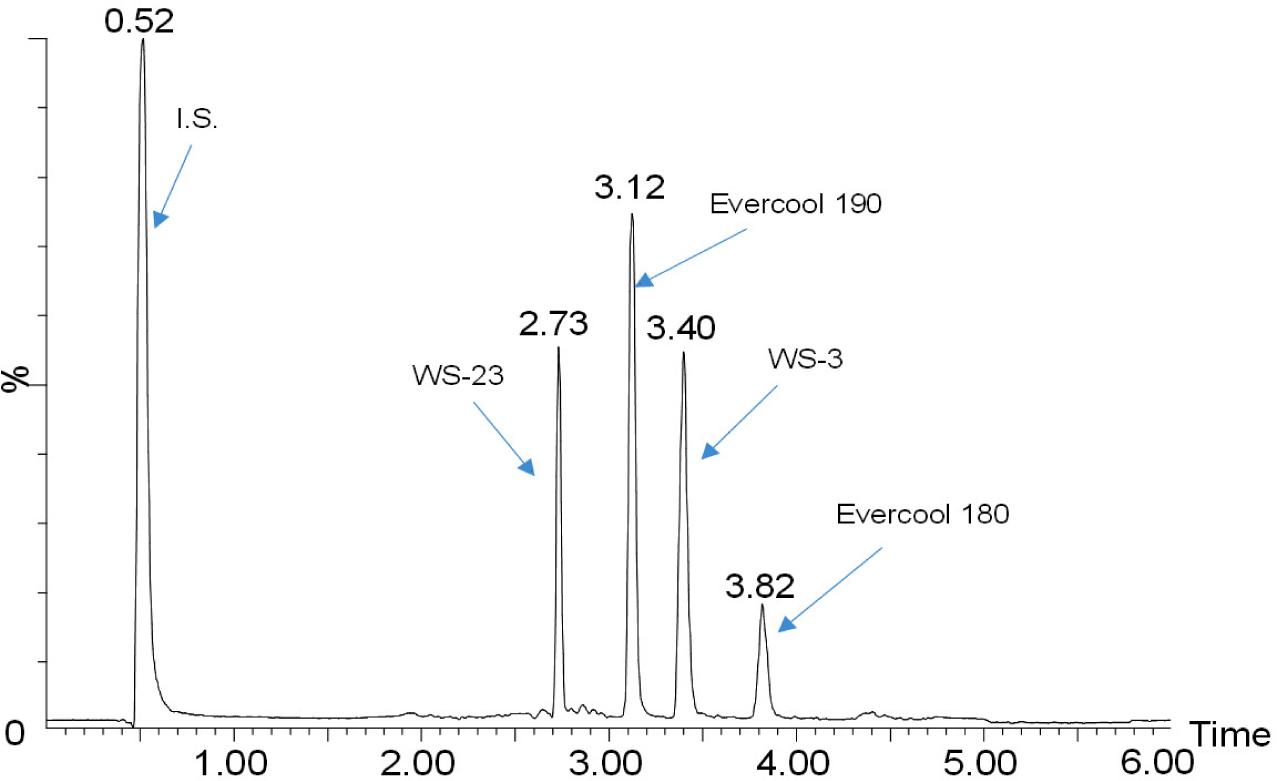
Figure 3.

Results of WS-3 analysis by GC/MS in four analyzed nicotine pouches_
| Samples | Level of WS-3 (mg/g) | RSD (%) |
|---|---|---|
| Sample 1 a | 0.514 | |
| Sample 1 b | 0.469 | |
| Sample 1 c | 0.490 | |
| Average for pouch 1 | 0.491 | 4.59 |
Level of WS-3 per g of tobacco in several cigarettes_
| Samples | Level of WS-3 (mg/g) | RSD (%) |
|---|---|---|
| Experimental cigarette 1 (LC/MS) | 2.878 | 1.93 |
| Experimental cigarette 1 (GC/MS) | 2.991 | 4.93 |
| Experimental cigarette 2 | 1.954 | 3.52 |
| Experimental cigarette 3 | < LOQ | |
| Experimental cigarette 4 | 1.484 | 0.02 |
| Commercial cigarette 1 | < LOQ | |
| Commercial cigarette 2 | < LOQ |
Results for the measurement of WS-3 in cigarette smoke_
| Smoking | Level of WS-3 (mg/g) | RSD (%) |
|---|---|---|
| ISO | 0.196 | 1.31 |
| HCA | 0.240 | 0.79 |
The parameters a, b, and c used for calibration for each cooling agent as well as the corresponding correlation coefficient R2_
| Compound | a | b | c | R2 |
|---|---|---|---|---|
| WS-23 | -3.91604E-14 | 5.64097E-06 | -0.05549529 | 0.9987 |
| WS-3 | 4.4729E-13 | 1.77042E-06 | 0.197442 | 0.9989 |
| Evercool 190 | -5.22754E-14 | 2.58027E-06 | -0.02307681 | 0.9990 |
| Evercool 180 | 1.61678E-12 | 6.22688E-06 | 0.007595738 | 0.9982 |
Results of WS-3 analysis by LC/MS in four analyzed nicotine pouches_
| Samples | Level of WS-3 (mg/g) | RSD (%) |
|---|---|---|
| Sample 1 a | 0.496 | |
| Sample 1 b | 0.513 | |
| Sample 1 c | 0.496 | |
| Average for pouch 1 | 0.502 | 1.99 |
| Sample 2 a | < LOQ | |
| Sample 2 b | < LOQ | |
| Sample 2 c | < LOQ | |
| Average for pouch 2 | < LOQ | — |
| Sample 3 a | < LOQ | |
| Sample 3 b | < LOQ | |
| Sample 3 c | < LOQ | |
| Average for pouch 3 | < LOQ | — |
| Sample 4 a | 0.105 | |
| Sample 4 b | 0.103 | |
| Sample 4 c | 0.104 | |
| Average for pouch 4 | 0.104 | 0.84 |
Results for WS-3 levels in some flavor solutions_
| Sample | WS-3 (mg/g) | RSD (%) |
|---|---|---|
| Flavor 1 | 125.69 | 4.33 |
| Flavor 2 | 117.56 | 0.63 |
| Flavor 3 | 123.72 | 2.74 |
| Flavor 4 | 112.27 | 2.59 |
| Flavor 5 | 119.50 | 3.82 |
| Flavor 6 | 118.36 | 0.24 |
| Flavor 7 | 121.13 | 2.95 |
| Flavor 8 | 123.00 | 1.82 |
| Flavor 9 | 113.89 | 1.84 |
The LOQ values for the GC/MS method of analysis of cooling agents_
| Compound | LOQ (μg/mL) |
|---|---|
| WS-23 | 1.56 |
| WS-3 | 1.56 |
| Evercool 190 | 3.13 |
| Evercool 180 | 6.25 |
The recovery of WS-3 from a tobacco sample spiked with three levels of analyte and the corresponding recovery levels_
| Taken (mg/g) | Analyzed (mg/g) | Recovery (%) | RSD (%) |
|---|---|---|---|
| 2.0 | 2.018 | 100.9 | 3.316 |
| 1.0 | 1.004 | 100.4 | 3.444 |
| 0.5 | 0.500 | 100.0 | 1.375 |
Gradient conditions for coolants HPLC separation_
| Time (min) | A (%) | B (%) |
|---|---|---|
| 0.0 | 95 | 5 |
| 0.5 | 95 | 5 |
| 2.0 | 40 | 60 |
| 4.0 | 40 | 60 |
| 5.0 | 95 | 5 |
| 6.0 | 95 | 5 |
Samples analyzed in this study_
| Sample type | Material type | Analytical procedure |
|---|---|---|
| Experimental cigarette 1 a | Tobacco from cigarette | LC/MS, GC/MS |
| Experimental cigarette 2 a | Tobacco from cigarette | LC/MS |
| Experimental cigarette 3 a | Tobacco from cigarette | LC/MS |
| Experimental cigarette 4 a | Tobacco from cigarette | LC/MS |
| Commercial cigarette 1 b | Tobacco from cigarette | LC/MS |
| Commercial cigarette 2 b | Tobacco from cigarette | LC/MS |
| Nicotine pouch 1 b | Nicotine pouch | LC/MS, GC/MS |
| Nicotine pouch 2 b | Nicotine pouch | LC/MS |
| Nicotine pouch 3 b | Nicotine pouch | LC/MS |
| Nicotine pouch 4 b | Nicotine pouch | LC/MS |
| Experimental cigarette 1 a | Smoke ISO | LC/MS |
| Experimental cigarette 1 a | Smoke HCA | LC/MS |
| Flavor (1) to flavor (9) a | Flavor solution | LC/MS |
Ion used to generate the extracted peak, the parameters a and b used for calibration for each cooling agent as well as the corresponding correlation coefficient R2_
| Compound | m/z for peak area | a | b | R2 |
|---|---|---|---|---|
| I.S. (nicotinamide) | 122,1 | - | ||
| WS-23 | 129,1 | 0 | 0,218801 | 0,9998 |
| WS-3 | 211,2 | 0 | -0,17814 | 0,9995 |
| Evercool 190 | 288,1 | 0 | 2,604558 | 0,999 |
| Evercool 180 | 298,1 | 0 | 3,44324 | 0,9986 |
Typical parameters for the GC/MS analysis_
| Parameter | Description | Parameter | Description |
|---|---|---|---|
| Initial oven temperature | 37 °C | Carrier gas | Helium |
| Initial time | 1.0 min | Injection volume | 1 μL |
| Oven ramp rate | 30 °C/min | Flow mode | Constant flow |
| Oven temperature | 70 °C | Flow rate | 1.1 mL/min |
| Final time first ramp | 0 min | Nominal initial pressure | 7.95 psi |
| Oven ramp rate | 20 °C/min | GC outlet | MSD |
| Oven final temperature | 300 °C | MSD transfer line temperature | 270 °C |
| Final time | 6.4 min | Ion source temperature | 230 °C |
| Total run time | 20.0 min | Quadrupole temperature | 150 °C |
| Inlet temperature | 280 °C | MSD Gain | 1 |
| Inlet mode | Split | MSD solvent delay | 5.0 min |
| Split ratio | 10:1 | Mass range | 33–350 a.u. |