
Figure 1
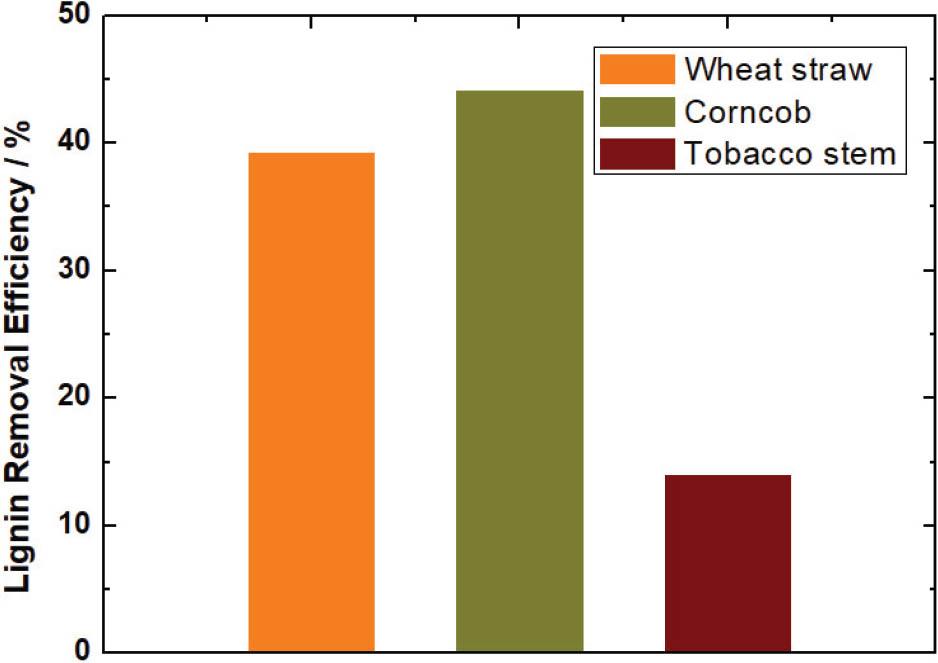
Figure 2
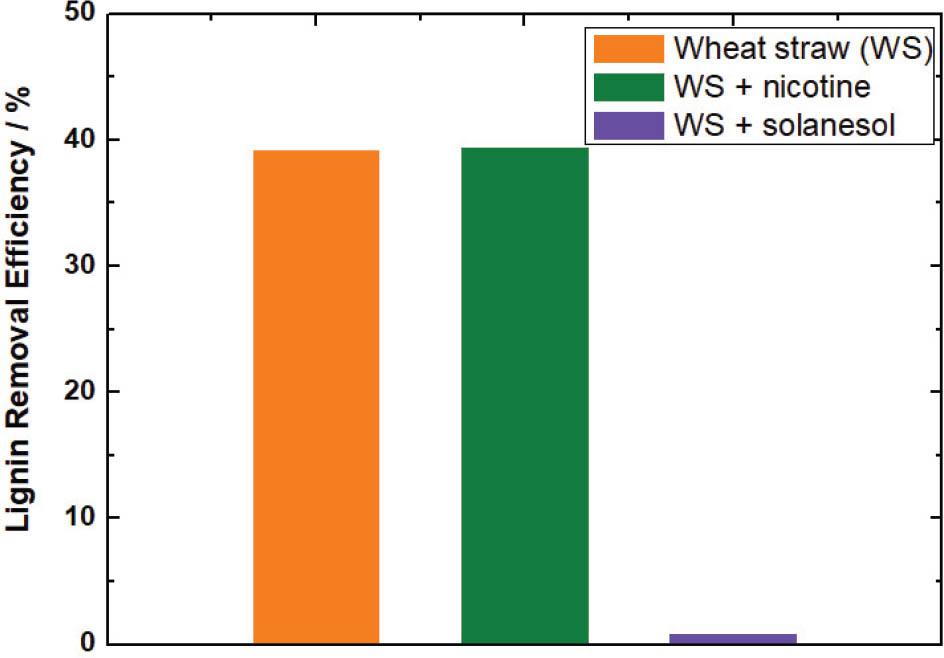
Figure 3
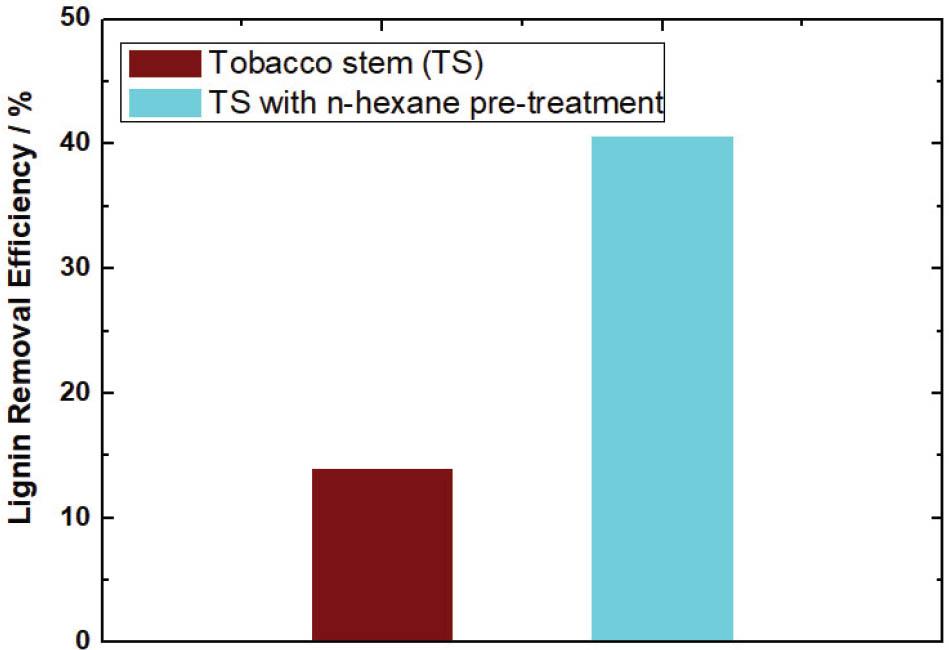
Figure 4
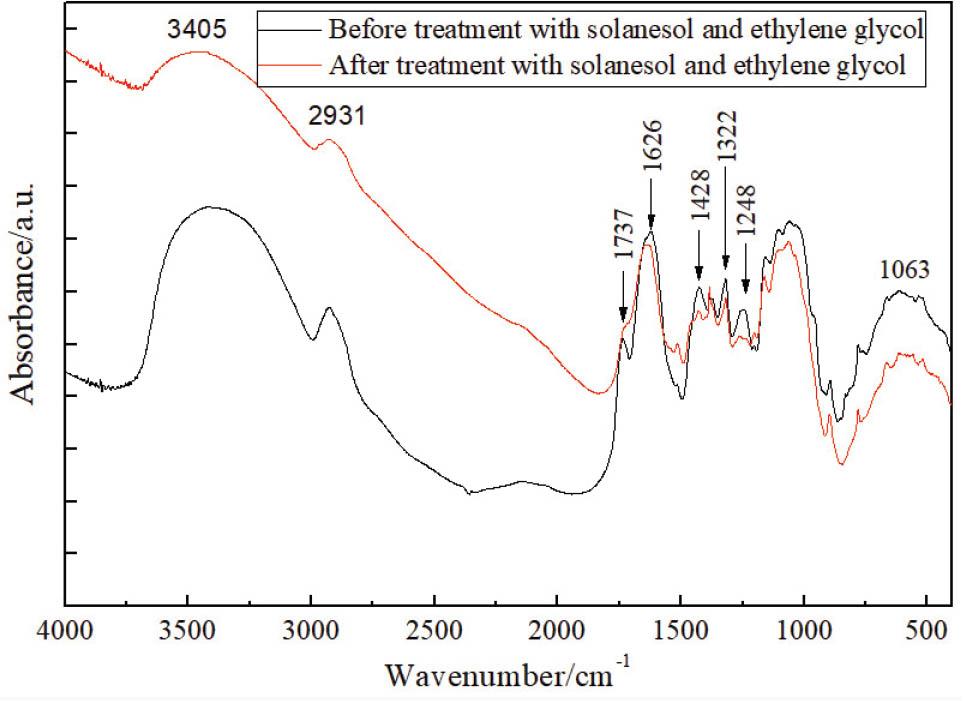
Figure 5
Specific surface area and pore volume of tobacco stem before and after treatment with solanesol and ethylene glycol_
| Material | SBET (m2 g−1) | Pore volume (cm3 g−1) |
|---|---|---|
| Fresh tobacco stem | 0.8047 | 0.0004 |
| Treated tobacco stem | 3.2843 | 0.0038 |
Chemicals and materials used in this work_
| Chemicals | Purities | Manufacturer |
|---|---|---|
| Ethylene glycol | A.R. | Macklin Company |
| n-hexane | A.R. | Tianjin Fuyu Company |
| Nicotine | 98% | USP Company |
| Solanesol | 95% | Aladdin Company |
| H2SO4 | A.R. | LuoYang Haohua Company |
| N2 | 99.999% | Bejing Praxair Company |
| Tobacco stem | – | China Tobacco Hunan Ind. Co. |
| Wheat straw | – | Henan, China |
| Corncob | – | Henan, China |
Lignin content of wheat straw, corncob and tobacco stem before and after ethylene glycol treatment_
| Material | Lignin content (wt/wt) Before treatment | Lignin content (wt/wt) After treatment |
|---|---|---|
| Wheat straw | 18.50 | 11.23 |
| Corncob | 14.15 | 7.91 |
| Tobacco stem | 5.15 | 4.44 |
Solanesol content of tobacco stem before and after n-hexane treatment_
| Material | Solanesol content (wt/wt) Before treatment | Solanesol content (wt/wt) After treatment |
|---|---|---|
| Tobacco stem | 0.18 | 0 |
Assignment of absorbance bands in FT-IR spectra_
| Wavenumber (cm−1) | Vibration | Assignment |
|---|---|---|
| 3405 | O–H | Phenolic OH + aliphatic OH |
| 2931 | C–H | CH3 + CH2 |
| 1737 | C=O | Unconjugated C=O |
| 1626 | C–C | Aromatic skeleton |
| 1515 | C–C | Aromatic skeleton |
| 1428 | C–C | Aromatic skeleton |
| 1322 | C–O | Syringyl unit of lignin |
| 1248 | C–O | Guaiacyl unit of lignin |
| 1063 | C–OH + C–O–C | Aliphatic OH + ether |