
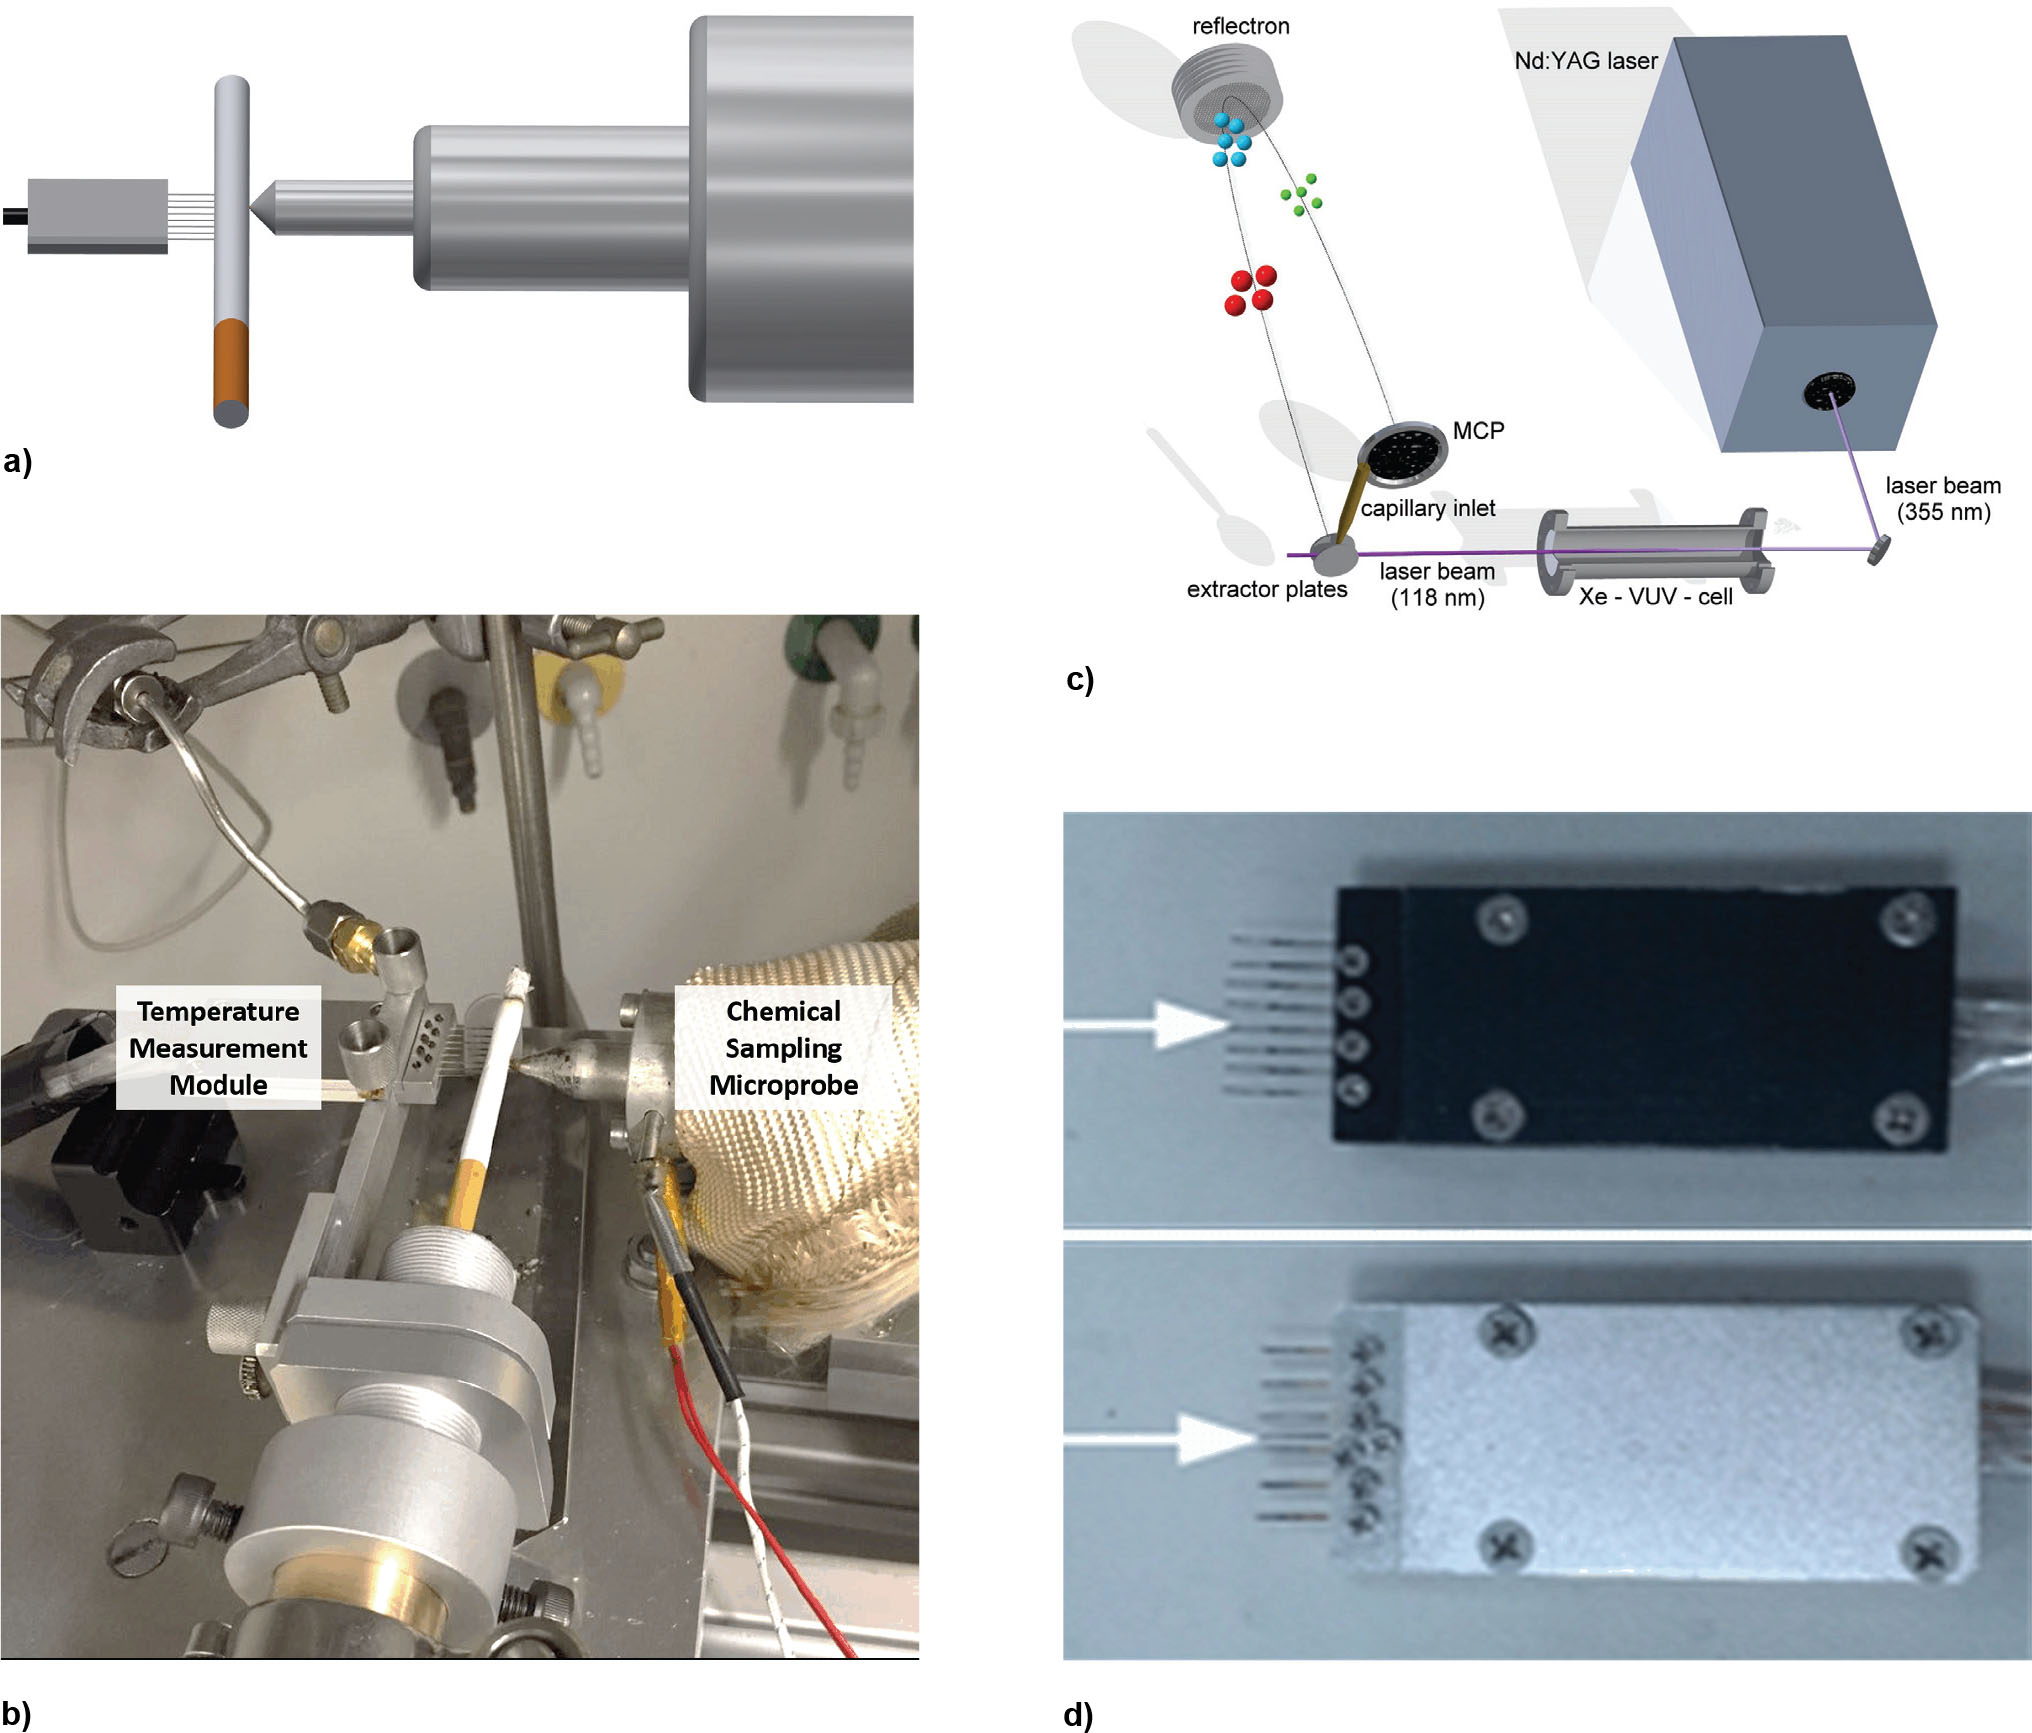
Figure 1
Experimental set-up. (a) Schematic of the thermocouple array and the chemical sampling microprobe positioned on the opposite of a test cigarette. (b) Image of the experimental set-up. (c) The laser beam for SPI-TOFMS used in the chemical sampling. (d) Image of the thermocouple and pressure sensor arrays (arrow indicates the 5th sensor marking the zero position – see text).
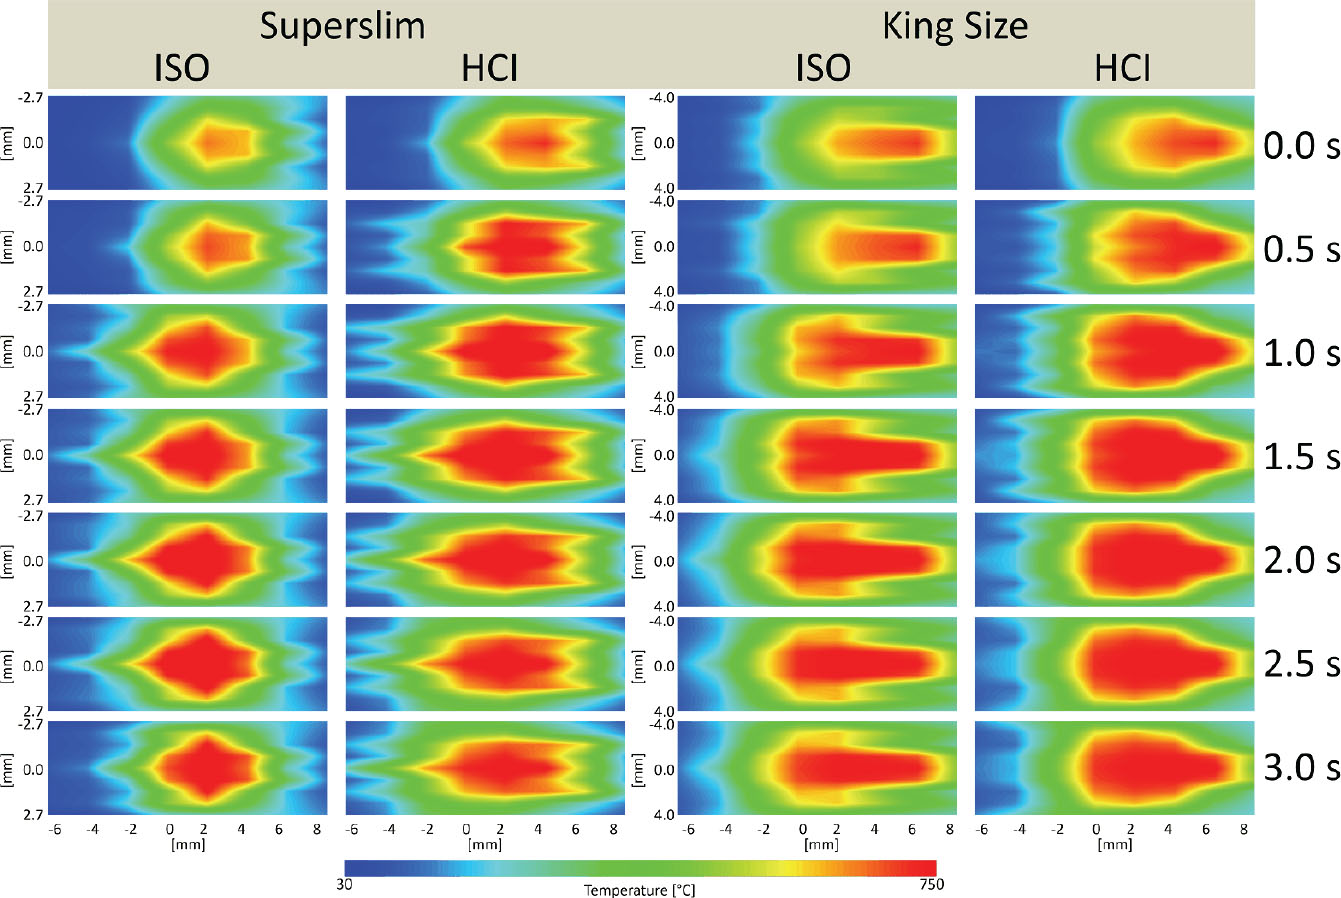
Figure 2
Temperature distribution maps for superslim and king-size cigarettes smoked under ISO and HCI conditions. The puff was initiated at 0 s and lasted for 2 s. The direction of burn is from right to left. (Note that the vertical axis is enlarged for the superlim relative to the king-size cigarette: −2.7 to +2.7 mm (superslim) versus −4.0 to +4.0 mm (king-size).)
Table 1
Physical parameters and mainstream smoke yields of the superslim and king-size cigarettes.
| Parameter | Superslim cigarette | King-size cigarette | ||
|---|---|---|---|---|
| Circumference (mm) | 17 | 24 | ||
| Weight (g) | 0.546 ± 0.005 | 0.925 ± 0.005 | ||
| Cigarette paper air permeability (CU) | 56.3 | 56.9 | ||
| Cigarette paper weight (g/m2) | 30.0 | 29.7 | ||
| Burn additive content (mg/g) | 12.5 | 13.4 | ||
| Cigarette total length (mm) | 97 | 84 | ||
| Filter length (mm) | 30 | 27 | ||
| Tipping paper length (mm) | 36 | 38 | ||
| Open unlit draw resistance (Pa) | 1240 | 1005 | ||
| Total tobacco rod ventilation (%) | 60.0 | 20.8 | ||
| Filter ventilation (%) | 51.9 | 15.8 | ||
| Tobacco cutting width (mm) | 0.8 | 0.8 | ||
| ISO | HCI | ISO | HCI | |
| NFDPM (mg/cig) | 5.78 | 17.18 | 9.49 | 22.2 |
| Nicotine (mg/cig) | 0.48 | 1.49 | 0.86 | 2.0 |
| CO (mg/cig) | 4.23 | 12.82 | 10.3 | 21.4 |
Table 2
Macro-characteristic parameters of the burning tips of the two cigarettes puffed under ISO and HCI regimes.
| Parameter | Superslim | King-size | ||
|---|---|---|---|---|
| ISO | HCI | ISO | HCI | |
| T0.5 (°C) | 474 ± 9 | 545 ± 6 | 455 ± 13 | 451 ± 13 |
| V0 (cm3) | 226 ± 10 | 307 ± 5 | 489 ± 10 | 490 ± 6 |
| Tmax (°C) | 814 ± 20 | 818 ± 22 | 776 ± 16 | 796 ± 6 |
| Average puff burn rate (mm/s) | 0.75 ± 0.06 | 1.23 ± 0.07 | 0.59 ± 0.06 | 0.83 ± 0.05 |
| Maximum puff burn rate (mm/s) | 1.29 ± 0.12 | 2.41 ± 0.29 | 0.96 ± 0.10 | 1.54 ± 0.20 |
| Average smoldering rate (mm/s) | 0.10 | 0.08 | ||
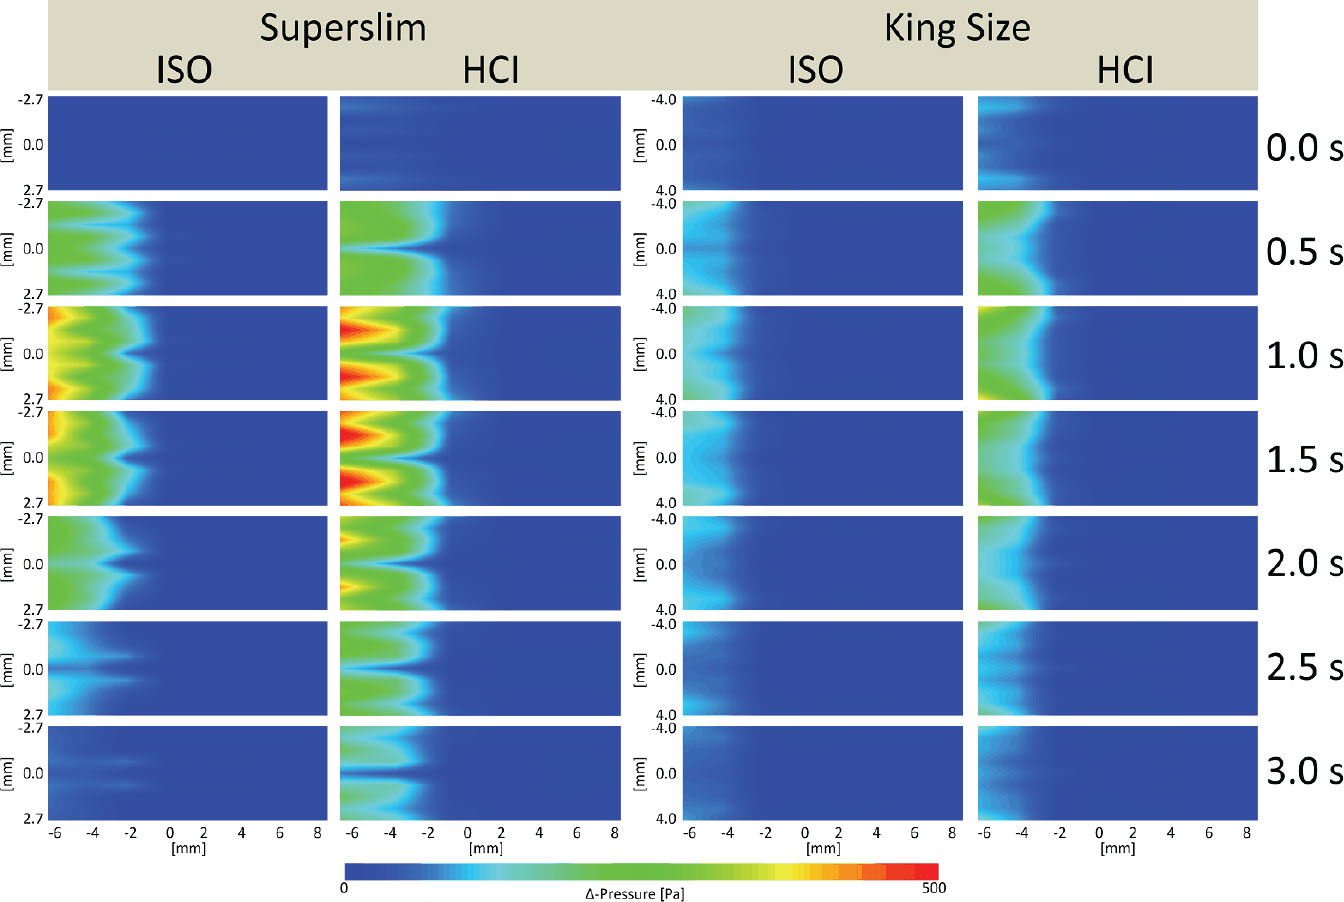
Figure 3
Pressure distribution for superslim and king-size cigarettes smoked under ISO and HCI conditions. The puff was initiated at 0 s and lasted for 2 s. The direction of burn is from right to left.
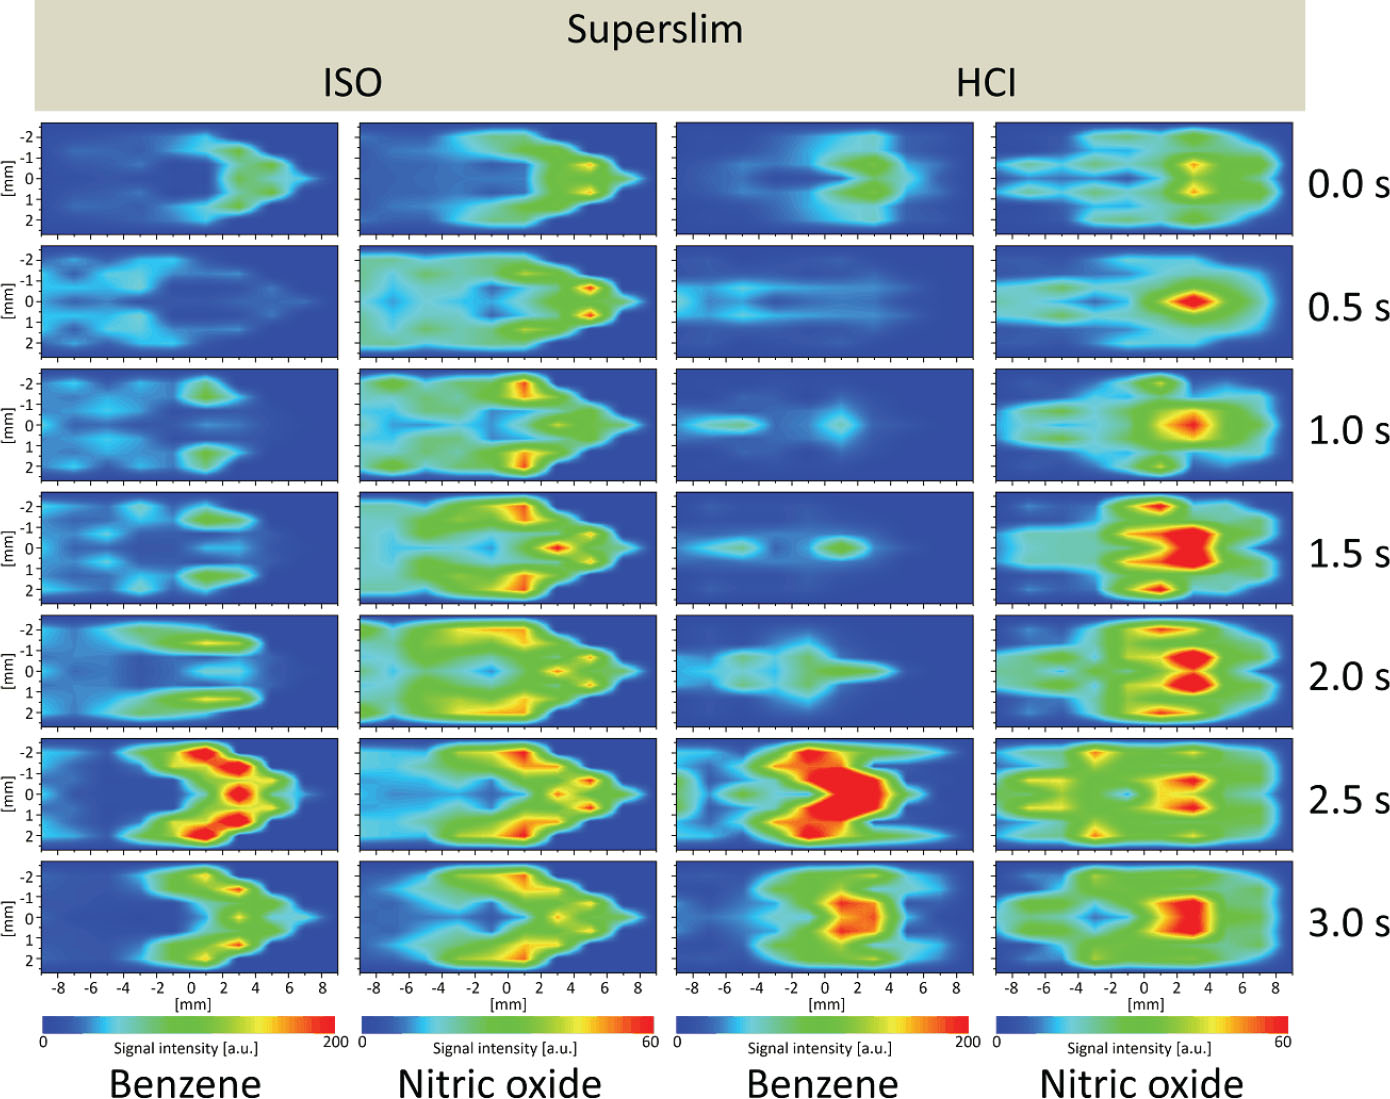
Figure 4
Concentration maps of benzene and nitric oxide formation in a superslim cigarette smoked under ISO and HCI conditions. The puff was initiated at 0 s and lasted for 2 s. The direction of burn is from right to left.
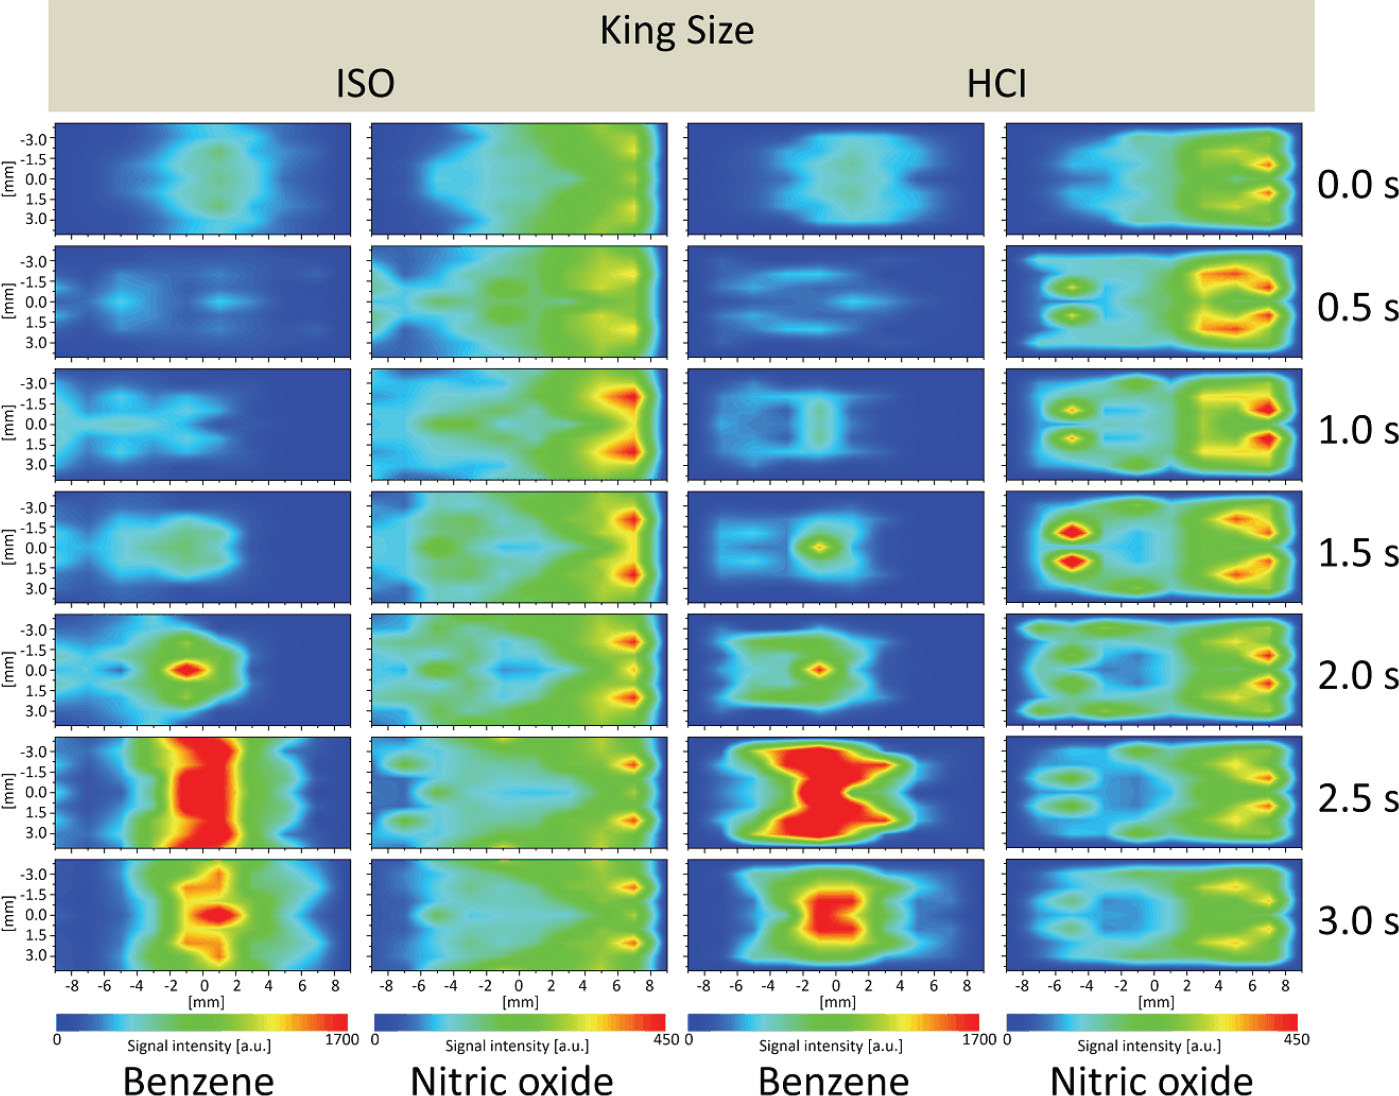
Figure 5
Concentration maps of benzene and nitric oxide formation in a king-size cigarette smoked under ISO and HCI conditions. The puff was initiated at 0 s and lasted for 2 s. The direction of burn is from right to left.
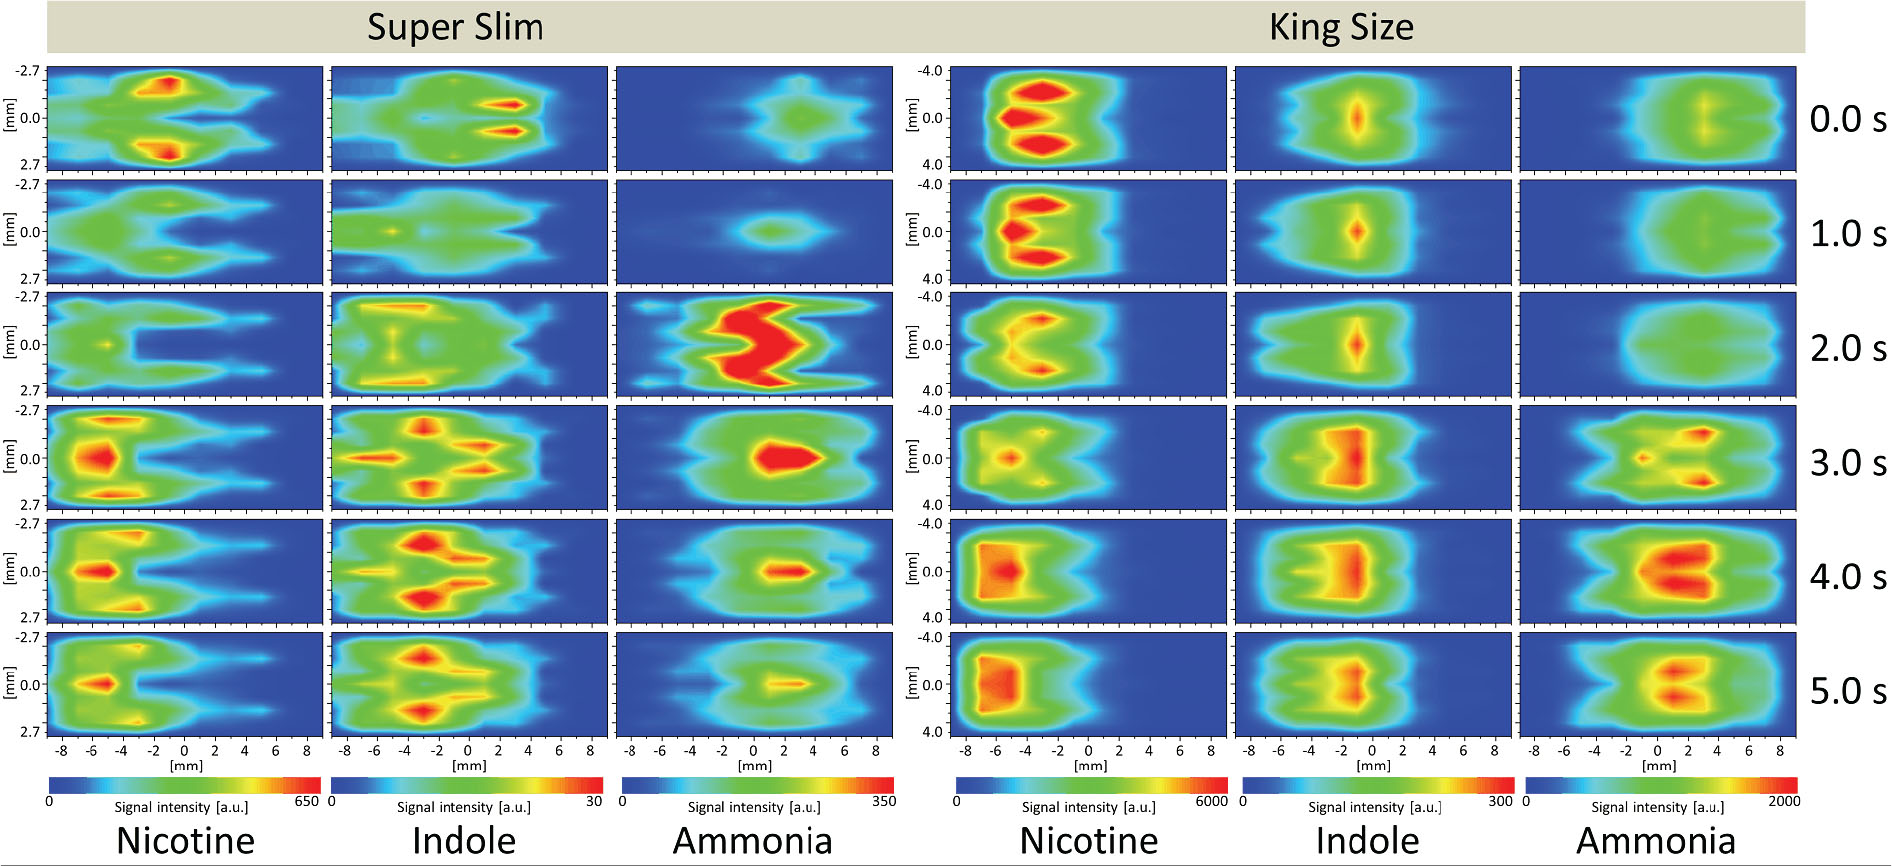
Figure 6
Influence of cigarette diameter on nicotine degradation chemistry. Shown are concentration maps of nicotine, indole and ammonia under HCI puffing conditions. The starting puff was initiated at 0 s and lasted for 2 s; however, concentration maps up to 5.0 s are shown to illustrate the evolution of the three species. The direction of burn is from right to left.