
1. Introduction
One of the most important questions to ask when modeling a system as a network is, What are the nodes and what are the edges? These choices affect both the structure (Butts, 2009) of the resulting networks and the dynamics which unfold on them (Landry & Adams, 2023). Similarly, the choices that we make when collecting observational data (Adams, 2019) and post-processing these data (Peel et al., 2022) fundamentally change the structure of the resulting networks. Finally, measures of network structure are often understood as intrinsic qualities of a system and are often explained in terms of network formation mechanisms (Barabási & Albert, 1999; Overgoor et al., 2019; Watts & Strogatz, 1998), data collection (Génois & Barrat, 2018; Landry et al., 2024), and inferential choices (Butts, 2009; Peel et al., 2022). When network science is taught with sole emphasis on terminology, algorithms, and formal mathematical descriptions, however, there can be a disconnect between these abstract concepts and the real-world data they are meant to represent.
This disconnect may impact students in several ways. We observed that our class of biology students struggled with fully understanding network measures, abstract network representations, and linear algebra. Even our students who possessed a solid understanding of the theoretical concepts underpinning network science sometimes struggled to apply these concepts to real-world systems. It is essential to bridge the theory-practice divide so that students develop a deep understanding of the networks in real-world systems. Learning to intuitively understand the limitations and choices one makes when modeling systems as networks is fundamental to network science. We found that visual representations were an effective tool for helping students develop this thoughtful intuition, especially in our class of students with diverse mathematical backgrounds.
In the past, network scientists have (with good reason) criticized the “hairball” or “ridiculogram”1 – a network visualization with so many nodes and links that (1) no real structure is visible and (2) the interpretation of the network largely relies on the layout and visualization algorithm used. However, we believe that carefully curated networks can help students develop an intuition for how to represent systems and what network metrics are measuring.
In this article, we present the “Network of the Day” (NotD, pronounced noted), a simple interactive activity to consistently engage students and build their network intuition. This activity features a curated empirical network displayed with key identifying information obscured and corresponding questions and group discussion followed by class discussion. This activity is typically run at the beginning of class, lasts between 5 and 15 minutes, and flexibly accommodates different classroom settings and network topics. We provide a curated repository with a large number of example to aid instructors using this activity.
2. Goals
NotD is an accessible and memorable activity to engage students in the process of mapping systems to network representations and answering, What is a node and what is an edge? This activity is flexible and can illustrate any network concept, provided that there is a corresponding empirical network, which has that structure or can be modeled as that type of network.
The specific goals of this activity include the following:
To train students to model empirical systems as networks. NotD introduces systems from a wide range of domains, forcing students to think through choices of network representations. This activity demonstrates the choices researchers make when defining nodes and edges, gathering data, and measuring networks, as well as the limitations that accompany each step.
To introduce abstract network concepts in a tangible way. Students may find concepts such as assortativity, modularity, and clustering coefficient unintuitive, even if they understand the mathematics. NotD maps these network concepts directly onto a network visualization to clarify what network structure “looks” like and to help students grasp network concepts intuitively.
To consistently expose students to networks through practical examples. Consistency is a key part of this activity. By introducing different systems, measures, and network representations throughout the course rather than as a one-off activity, students learn to see networks as a common framework unifying a wide range of fields. By encountering networks multiple times a week, students become familiar with networks where nodes and edges represent very different parts of a system; for example, one can introduce transportation networks comprising locations and routes between locations, contact networks comprising people and social contacts, and Bluesky posting cascades comprising posts and reposts.
To discuss and develop a network science intuition. Through small group discussion, students develop their own intuition for identifying the nodes and edges in a system, the network representation chosen, and the structure that network exhibits. Students can also talk about the choices in representing, collecting, and measuring the system and limitations that these choices imply.
General class engagement. NotD is designed as an icebreaker at the start of every class; the activity gets the students talking and comfortable in a class environment. Most importantly, it puts the students’ brains into “network mode” and shifts their focus to thinking about network properties in an intuitive way, which aids understanding throughout the class.
Because NotD does not require network jargon or mathematical definitions, this activity can be deployed in a variety of different contexts, although we recommend that it be used in a class where one can consistently run this activity. This lends itself to a college-level class, both undergraduate and graduate, particularly one focused on network analysis. Although one can easily cater this activity for a specific context by selecting networks from a particular domain and field-specific analytical questions, it is also suitable for a general network science class.
3. Setup
Although the majority of the preparation required to run this activity is completed before class, we walk through the setup required in and outside of class.
3.1. Equipment and classroom needs
The classroom should be arranged to encourage small group discussion. An ideal setup includes multiple round tables seating 4–8 students each, though the activity can be adapted to any layout that supports discussion among groups of 2–4 students. The classroom should also have audiovisual capabilities to display the NotD. If this is not possible, consider other ways of sharing the network (e.g., in a document linked within the learning management system, etc.).
3.2. Pre-class preparation
Because this activity is so flexible and can cover numerous topics, determining the expected learning outcome before designing the activity is essential and will determine the design of the slides. Here, we describe several different learning outcomes that can help guide the design of the activity.
Identification. Asking students to identify what nodes and links represent and the domain to which the system belongs helps them reverse engineer networks from systems across many domains.
Representation. Asking students to identify network features (e.g., multiedges, weighted edges, self-loops, etc.) and network representations (e.g., multilayer networks, temporal networks, hypergraphs, etc.) helps students develop an intuition for what features are important to capture in an empirical dataset.
Comparison. Asking students to compare two networks where links mean different things (Landry & Adams, 2023) or are collected by different means (Génois & Barrat, 2018) can give students an intuitive understanding of reasons for why networks can differ. Both the networks need not be empirical; one network can be a random null model fitted to the dataset, for example.
Measurement. Asking students to identify “important” nodes (centrality), clusters (community structure), the “densest” part of the network (clustering coefficient), and whether highly connected nodes tend to connect to other highly connected nodes (degree assortativity) can help students intuitively grasp fundamental network measures.
Limitations. Asking students how they think the data might have been collected and limitations associated with the collection method can help students think critically about error that can emerge in the data.
These categories are not mutually exclusive; multiple topics can be covered in a single activity.
With this in mind, we describe the general process for preparing for class. The final product is a three-slide PowerPoint presentation: (1) the mystery slide, (2) the reveal slide, and (3) the context slide. We illustrate an example of a NotD presentation in Figure 1, taken from our curated GitHub repository of example networks and corresponding questions (see the Data Availability statement).
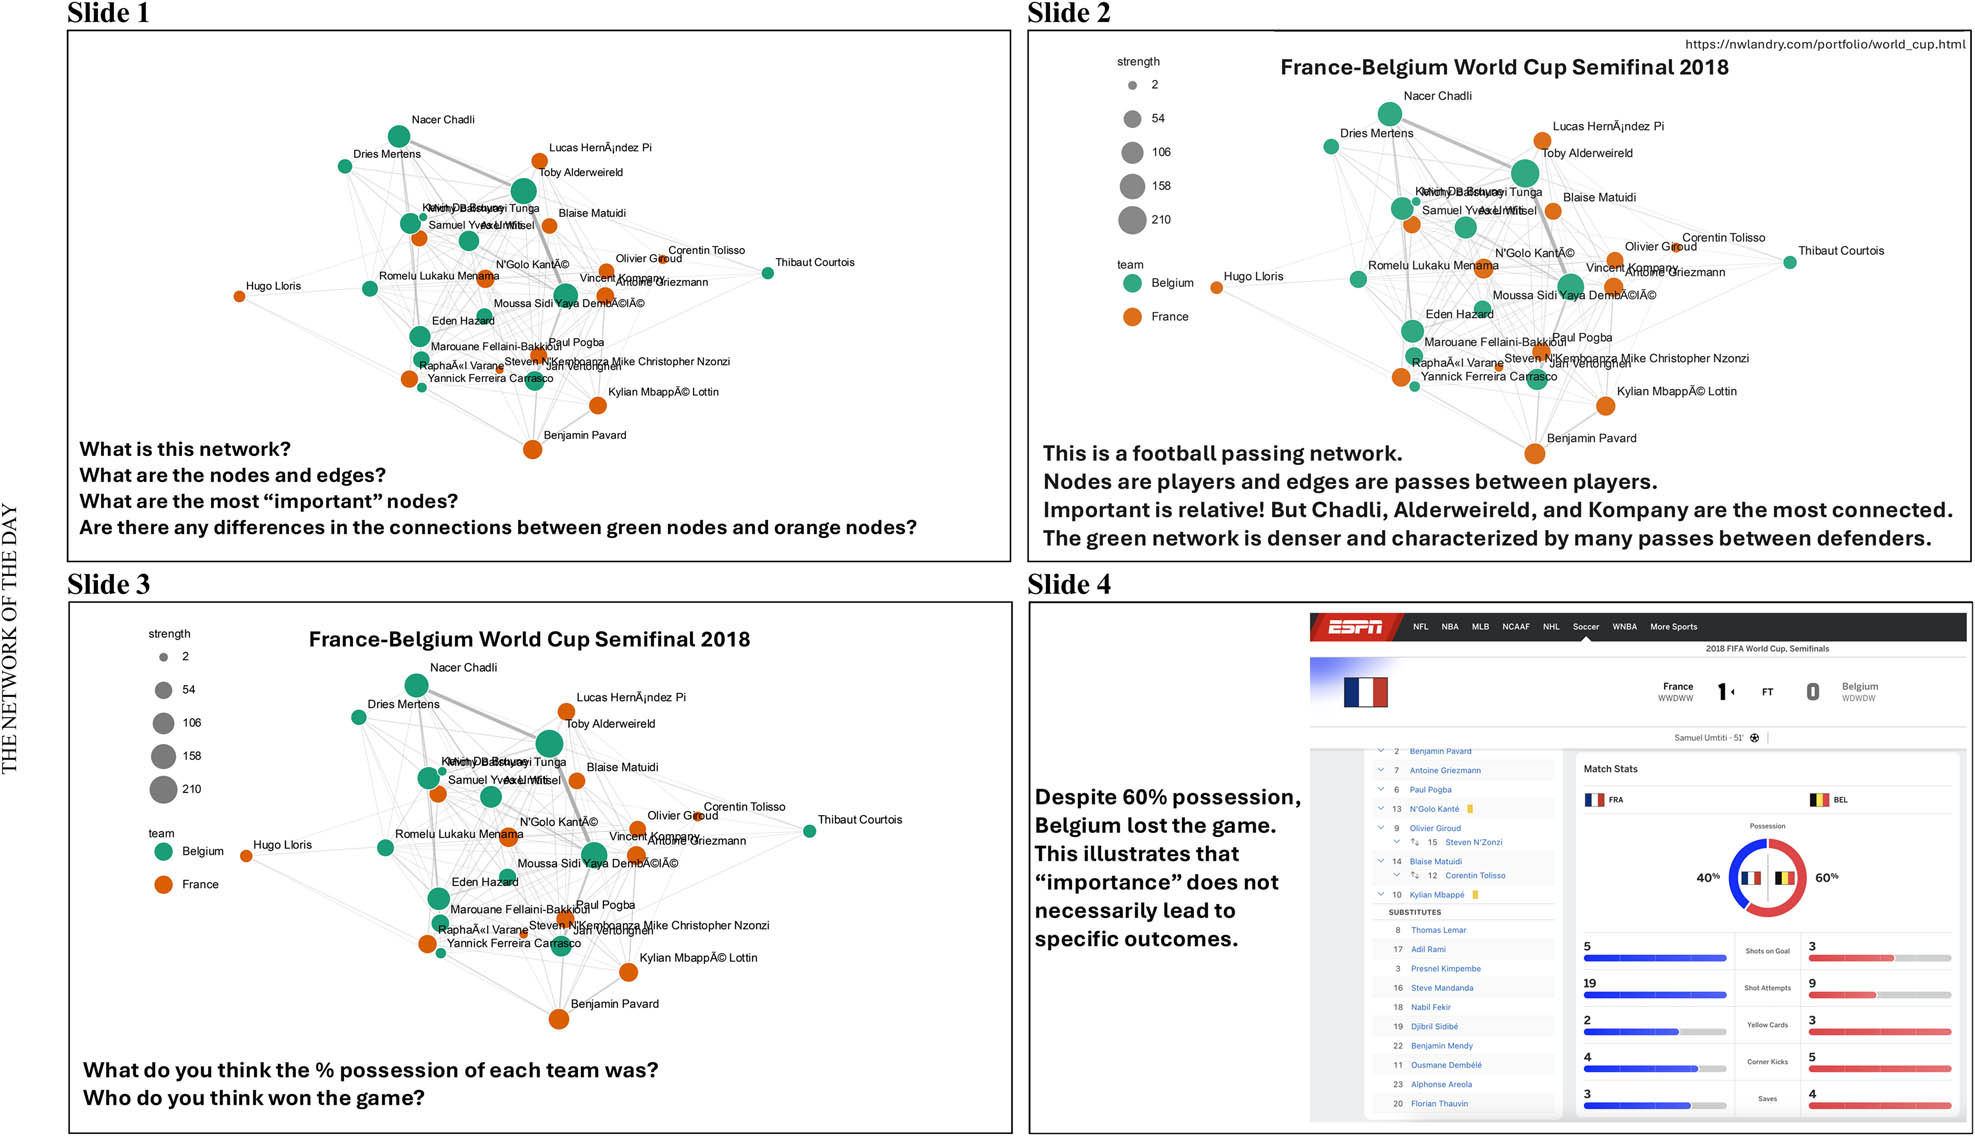
Figure 1
Example slides for NotD. An example of a slide deck used for NotD. In this example, slides 1 and 3 are the “mystery” slides, asking questions about the network in view; while slides 2 and 4 are both the “reveal” and “context” slides answering the prompting questions and revealing the full picture. This slide deck is available on GitHub (Gupta & Landry, 2026).
Source: Authors’ contribution.
First, we select a network. Factors to consider when selecting the network include student interest (for example, a street network from a city with which students are familiar, a network from a TV show in which students are interested, or a sport that students follow), network features (structure, collection method, type of network), and novelty. We urge educators to choose networks small enough that both nodes and edges can be distinguished. When searching for these networks, it is helpful to query network databases such as the Index of Complex Networks (Clauset et al., 2016) or Netzschleuder (Peixoto, 2021). We then find a network visualization from the network repository (e.g., Netzschleuder contains “ridiculograms” which can be used as visualizations), the original paper, or by analyzing the network oneself. In the corresponding GitHub repository, we provide a preliminary list of networks with sequencing steps as a starting point.
Once a suitable network visualization has been chosen, we do the following:
Determine the minimal amount of information on the network to plausibly determine the network’s identity. Anecdotally, node labels or nodal categories are sufficient to provide sufficient ambiguity, yet allow students to identify the network.
For the first slide (i.e., the “mystery” slide), obscure all metadata except for the minimal metadata determined above and display 3-4 questions for students to answer. In Section 6, we provide examples of questions one might ask for each learning goal described above.
For the second slide (i.e., the “reveal” slide), present the uncensored slide with any additional information required to answer the questions posed in the mystery slide (e.g., “This dataset was collected by... ,” or “Node sizes are proportional to... ,” etc.). Not only should additional context be provided, but superfluous and confusing information should be removed; if edge weights or self-loops have not yet been discussed, they should not appear in either the mystery or reveal slides.
For the last slide (i.e., the “context” slide), present the paper or source from which the network visualization derives, any new network terminology that is useful for understanding the structure or representation of the network, and any relevant conclusions found in the paper.
3.3. Potential questions
The following questions, organized by learning outcome, provide a starting point for designing the mystery slide.
Identification
What is this network?
What are the nodes and edges?
Representation
Does this network contain multiedges, weights, or self-loops?
What are the different types of relationships? How would you represent them as a network?
Comparison
What are the structural differences between the two networks?
(For comparison to a null model) Which network contains more structure?
Measurement
What do you think the most important node is?
Which part of the network do you think is most vulnerable?
Limitations
Do you think this system should be represented as a network?
How do you think the network was collected? What are some limitations in the collection process?
3.4. In-class setup
For best results, arrive 5 min early and project the mystery slide, ready for when students arrive. Instruct students to sit in groups of 4-8 (or whatever your space will allow).
4. Procedure
The activity can take between 5 and 15 minutes depending on the desired amount of time, the particular network chosen, and the amount of content covered with the activity. NotD involves both small group and class discussion, and we discuss sequencing for each.
4.1. Small group discussion
Ideally, the mystery slide should be projected by the start of class so that students see it as they arrive. At the start of class:
Announce the network of the day.
Re-iterate the questions on the mystery slide.
Instruct students to form groups of 2-4 and take roughly 5 min to discuss the guiding questions with their group.
When discussion slows down, end the small group discussion and move to the classroom discussion portion of the activity.
4.2. Classroom discussion
Following the initial discussion and moving on to the reveal slide, we took the opportunity to talk through how we think about the network and our (instructor) process for determining the identity of the mystery network, its structure, and other information asked by the guiding questions. We found it particularly effective to reference arguments made by students when talking about our reasoning.
Finally, the context slide is an opportunity to synthesize modern literature with digestible network takeaways or to introduce new, relevant network concepts. An example of the former is to use a metabolic network as the network of the day, and then talk about the centrality of different metabolites and how they relate to lethality (Jeong et al., 2001). An example of the latter is for road networks to present planar and physical networks, and then ask why roads are often well represented with planar networks and when planarity can be violated.
5. Lessons
NotD is highly versatile and can be easily adapted to different courses, learning objectives, and levels of student experience. Instructors need only select networks that align with the themes and goals of their course. A consistent outcome of this activity, however, is the ability to critically reason about the modeling of complex systems as networks.
While this activity can be used to illustrate a variety of structural features, data collection methods, or representation choices, a common thread is the adage, “look at your data.” Rather than bombard students with a large variety of network measures and abstract concepts, this activity teaches students to understand their data first and see what, for example, modular or assortative networks look like.
We suggest a scaffolded approach to this activity. For the first few activities, instructors can focus on simple questions related to the identity of the system, the choice of nodes and edges, and the way in which the network was collected. Once students become comfortable with this format and new concepts are introduced, instructors can scaffold this activity, retaining the original questions, but now adding one or two questions related to a recent topic.
An outcome of this activity is to provide opportunities to think critically about the modeling of networks; that networks are not fixed or objective representations of reality, but rather an abstraction constructed to answer a particular question. In our experience, students generated a wide range of responses, posing the opportunity to develop students’ metacognition. A class wide discussion on the evidence supporting and contradicting each response can train students to critically examine modeling choices for empirical systems.
As students repeatedly engage in this process across a diverse set of examples, the activity reinforces the use of network analysis as a general framework to model any real-world system. Instructors can also use discussion to reinforce how networks help make sense of complex data, generate hypotheses, and unify different domains.
6. Reflections
This activity was used in an upper level undergraduate course, “Networks in Biology,” at the University of Virginia in Fall 2025. It was held in an active learning classroom with round tables seating up to eight students each, and with an A/V system and three projector screens on different sides of the room. The course enrolled 26 students; despite the small class size, we believe the activity scales well due to its emphasis on small group discussion, with a full class discussion used to bring the ideas together.
In our experience, NotD improved students’ ability to reason about and represent systems more so than any other interactive activities we tried. We believe that the consistency with which we ran this activity was partially responsible; we used NotD in 17 different class sessions.
Although this network activity has many positives, there are important caveats. These limitations come down to the fact that while networks are abstract and solely relational, any network visualization must choose where the nodes are positioned and the way that nodes and edges are displayed (e.g., whether nodes and edges are sized or colored according to nodal or edge properties). Without care, students may reverse the causality, saying things like, “the most central nodes in the network are the bigger ones” rather than, “large nodes are illustrative of highly central nodes due to (for example) a large number of shortest paths passing through it.” We recommend repeatedly and explicitly talking about “network myths” (of which this is one) and having student-led discussion on why visual layouts do not necessarily indicate structure through a student engagement technique such as “Quotes,” described in the study by Barkley (2010).
We also suggest careful curation of networks to avoid the “hairball.” Small networks and sparse networks are easily represented, but using matrix representations can side-step the issue of scaling and introduce another network representation as a side benefit. However, hairballs or “ridiculograms” are easily found in the literature and can serve as a useful teaching tool to show students why these representations are problematic.
Long-term investments into the NotD examples (Gupta & Landry, 2026) will enable educators to easily implement this activity in their own courses, aiding in the design of more inclusive network science courses.
Acknowledgements
The authors wish to acknowledge the students of Networks in Biology: From Pandemics to Ecosystems for their input in designing the NotD activity.
Funding information
A.G. and N.W.L. acknowledge support from the University of Virginia Prominence-to-Preeminence (P2PE) STEM Targeted Initiatives Fund, SIF176A Contagion Science.
Author contributions
A.G. and N.W.L. conceptualized the project. A.G. and N.W.L. wrote the paper. A.G., J.T., and N.W.L. edited the draft. J.T. led data collection and IRB approval.
Conflict of interest statement
The authors have no competing interests to disclose.
Data availability statement
All materials necessary for this activity are available at https://github.com/landry-lab/NotD and at Ref. Gupta & Landry (2026).