
Fig. 1:
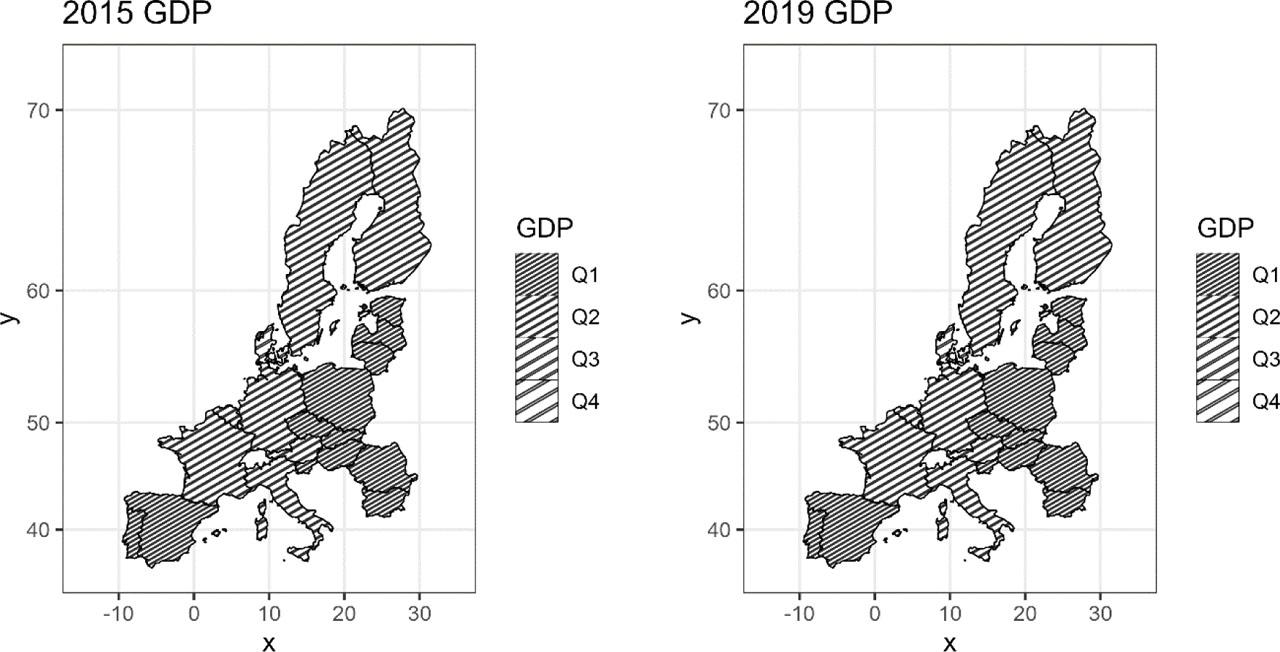
Fig. 2:
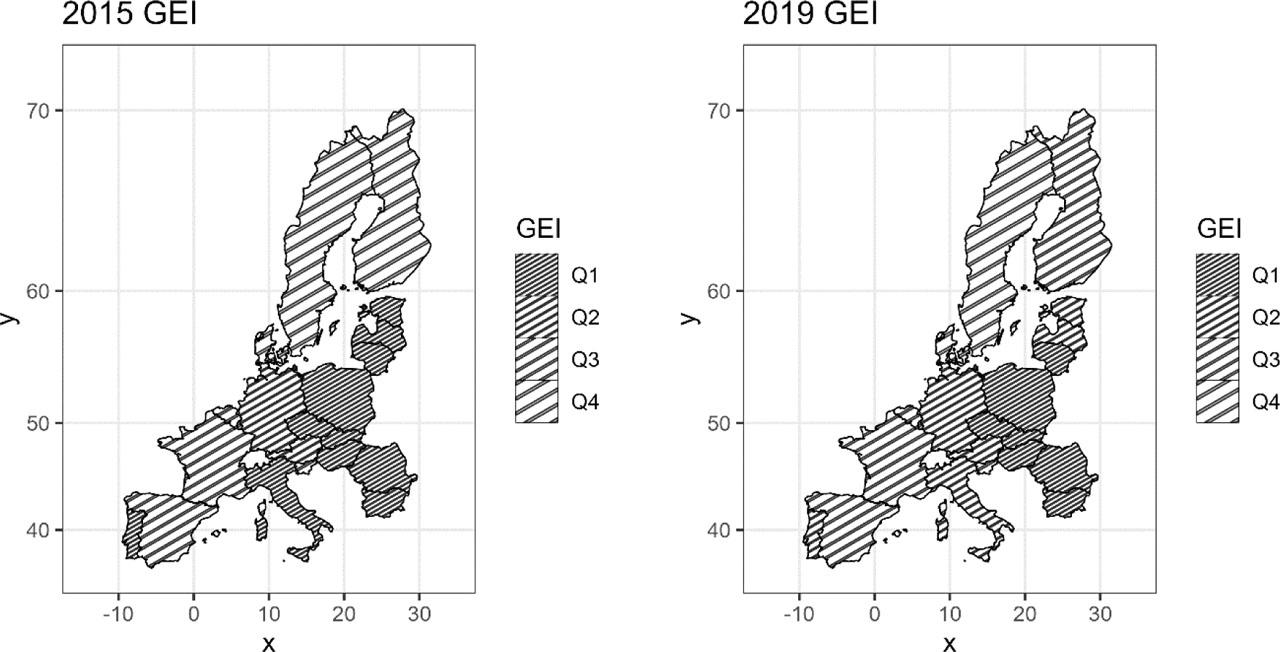
Fig. 3:
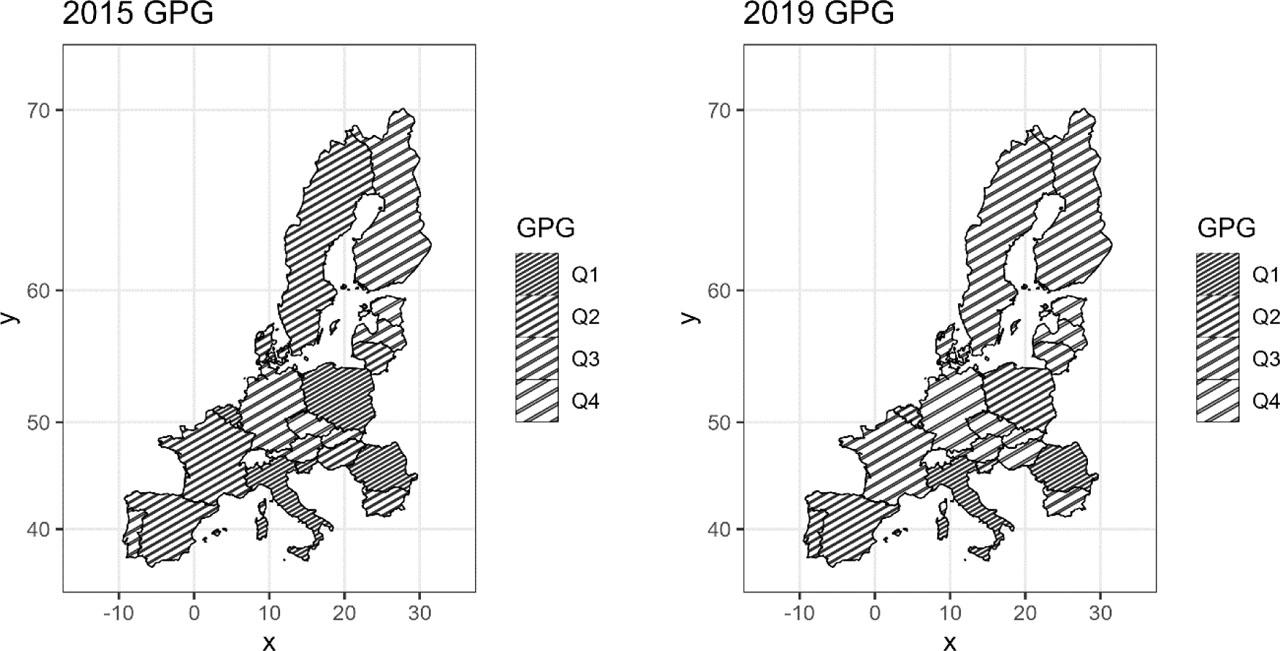
Fig. 4:
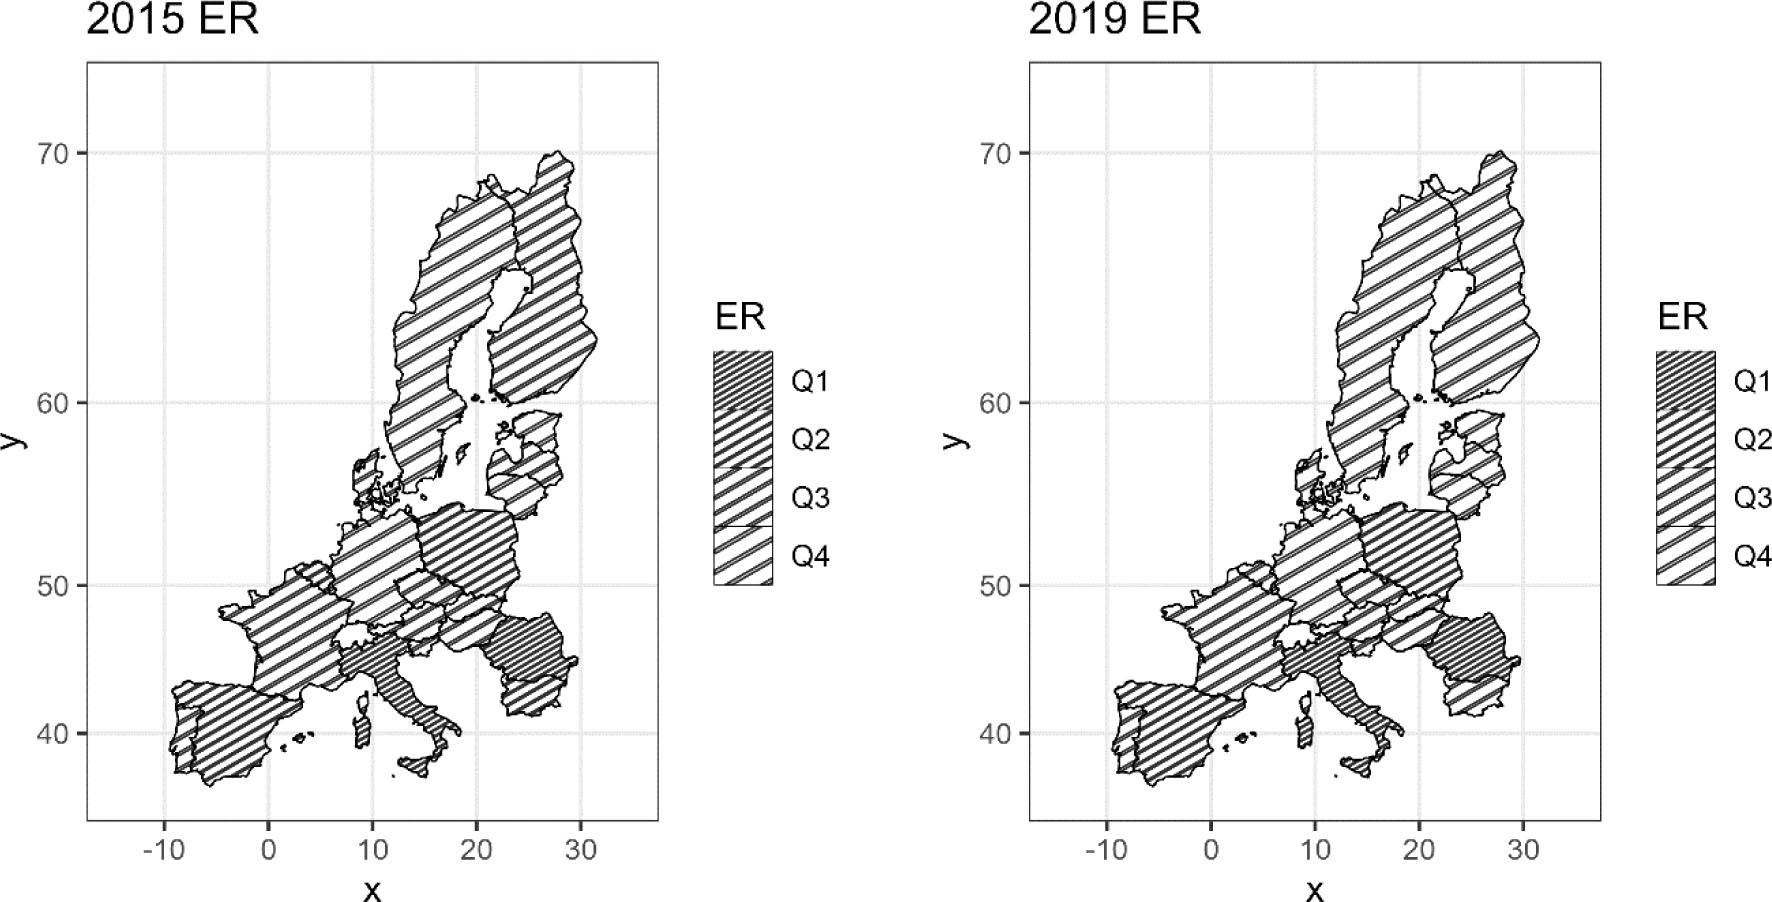
Fig. 5:
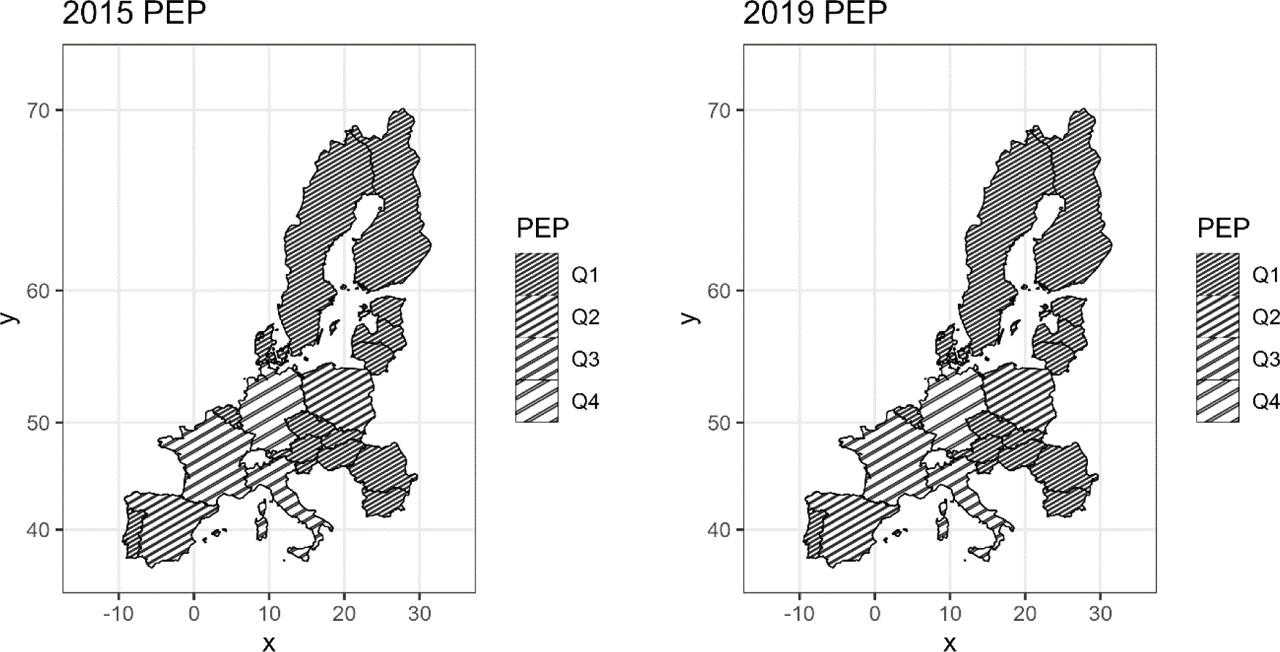
Fig. 6:

Fig. 7:

Fig. 8:

Fig. 9:
Fig. 10:
Fig. 11:

Fig. 12:
Results of LISA cluster analysis
| Country | 2015 | 2019 | ||||||||||
|---|---|---|---|---|---|---|---|---|---|---|---|---|
| GDP | GEI | GPG | ER | PEP | EDU | GDP | GEI | GPG | ER | PEP | EDU | |
| Belgium | 1 | 1 | 4 | 3 | 3 | 4 | 1 | 1 | 4 | 3 | 3 | 4 |
| France | 1 | 1 | 2 | 2 | 1 | 4 | 1 | 1 | 2 | 4 | 1 | 4 |
| Germany | 1 | 1 | 2 | 1 | 2 | 4 | 1 | 1 | 2 | 2 | 2 | 4 |
| Italy | 1 | 3 | 4 | 3 | 2 | 4 | 1 | 3 | 3 | 3 | 2 | 4 |
| Luxembourg | 1 | 1 | 4 | 3 | 3 | 4 | 1 | 1 | 4 | 3 | 3 | 4 |
| Denmark | 1 | 1 | 1 | 1 | 3 | 4 | 1 | 1 | 1 | 1 | 3 | 4 |
| Portugal | 4 | 3 | 2 | 3 | 3 | 4 | 4 | 3 | 4 | 2 | 3 | 4 |
| Spain | 4 | 2 | 3 | 4 | 1 | 4 | 4 | 1 | 4 | 3 | 1 | 4 |
| Austria | 2 | 4 | 1 | 2 | 3 | 2 | 2 | 2 | 1 | 2 | 3 | 4 |
| Finland | 1 | 1 | 2 | 1 | 4 | 3 | 1 | 1 | 2 | 1 | 4 | 3 |
| Sweden | 1 | 1 | 3 | 1 | 4 | 1 | 1 | 1 | 3 | 1 | 4 | 1 |
| Czechia | 4 | 4 | 1 | 1 | 3 | 1 | 4 | 4 | 1 | 1 | 3 | 2 |
| Estonia | 4 | 4 | 1 | 1 | 4 | 1 | 4 | 4 | 1 | 1 | 4 | 1 |
| Hungary | 4 | 4 | 4 | 2 | 4 | 1 | 4 | 4 | 2 | 2 | 4 | 3 |
| Latvia | 4 | 4 | 1 | 1 | 4 | 1 | 4 | 4 | 1 | 1 | 4 | 1 |
| Lithuania | 4 | 4 | 4 | 2 | 4 | 1 | 4 | 4 | 2 | 2 | 4 | 1 |
| Poland | 4 | 4 | 3 | 4 | 1 | 1 | 4 | 4 | 3 | 3 | 1 | 1 |
| Slovakia | 4 | 4 | 1 | 4 | 4 | 1 | 4 | 4 | 1 | 1 | 4 | 1 |
| Slovenia | 4 | 2 | 4 | 4 | 4 | 2 | 4 | 2 | 3 | 2 | 4 | 2 |
| Bulgaria | 4 | 4 | 2 | 4 | 4 | 2 | 4 | 4 | 2 | 4 | 4 | 1 |
| Romania | 4 | 4 | 4 | 4 | 4 | 3 | 4 | 4 | 3 | 3 | 4 | 3 |
Moran's I statistics
| Year/variable | GDP | GEI | GPG | ER | PEP | EDU |
|---|---|---|---|---|---|---|
| 2015 | 0.4398 (0.0029) | 0.6058 (0.0006) | 0.0676 (0.2805) | 0.2252 (0.0806) | 0.0249 (0.3415) | 0.5838 (0.0007) |
| 2017 | 0.4420 (0.0029) | 0.5816 (0.0316) | 0.0760 (0.2673) | 0.1243 (0.1857) | 0.0223 (0.3463) | 0.4948 (0.0033) |
| 2019 | 0.4451 (0.0029) | 0.6035 (0.0006) | 0.0462 (0.3184) | 0.0940 (0.2277) | 0.0262 (0.3385) | 0.5125 (0.0023) |
Results of panel regression models
| Model | FEM | REM | Pooled | |||
|---|---|---|---|---|---|---|
| variable | Estimate | significance (p–value) | Estimate | significance (p–value) | Estimate | significance (p–value) |
| GEI | 103.8315 | *(0.0768) | 134.9978 | *(0.0438) | 767.4512 | ***(0.0002) |
| GPG | −35.1447 | −(0.6136) | −51.2419 | −(0.5193) | −828.2484 | **(0.0077) |
| ER | 312.0235 | ***(<0.0001) | 290.4494 | ***(<0.0001) | 598.8017 | *(0.0456) |
| PEP | 0.2875 | −(0.6866) | 0.1763 | −(0.7297) | −0.8835 | *(0.0174) |
| EDU | −8.6735 | −(0.6576) | −18.6857 | −(0.4093) | −389.8658 | ***(<0.0001) |
| Panel diagnostics | Collinearity diagnostics | |||||
| Test | p-value | VIF test | GEI | 1.8806 | ||
| F-test | <2.22e-16 | GPG | 1.2296 | |||
| Jarque–Bera | 0.5462 | ER | 1.9123 | |||
| Durbin–Watson | 0.0002 | PEP | 1.3320 | |||
| Breusch–Pagan | 0,1870 | EDU | 1.1288 | |||