
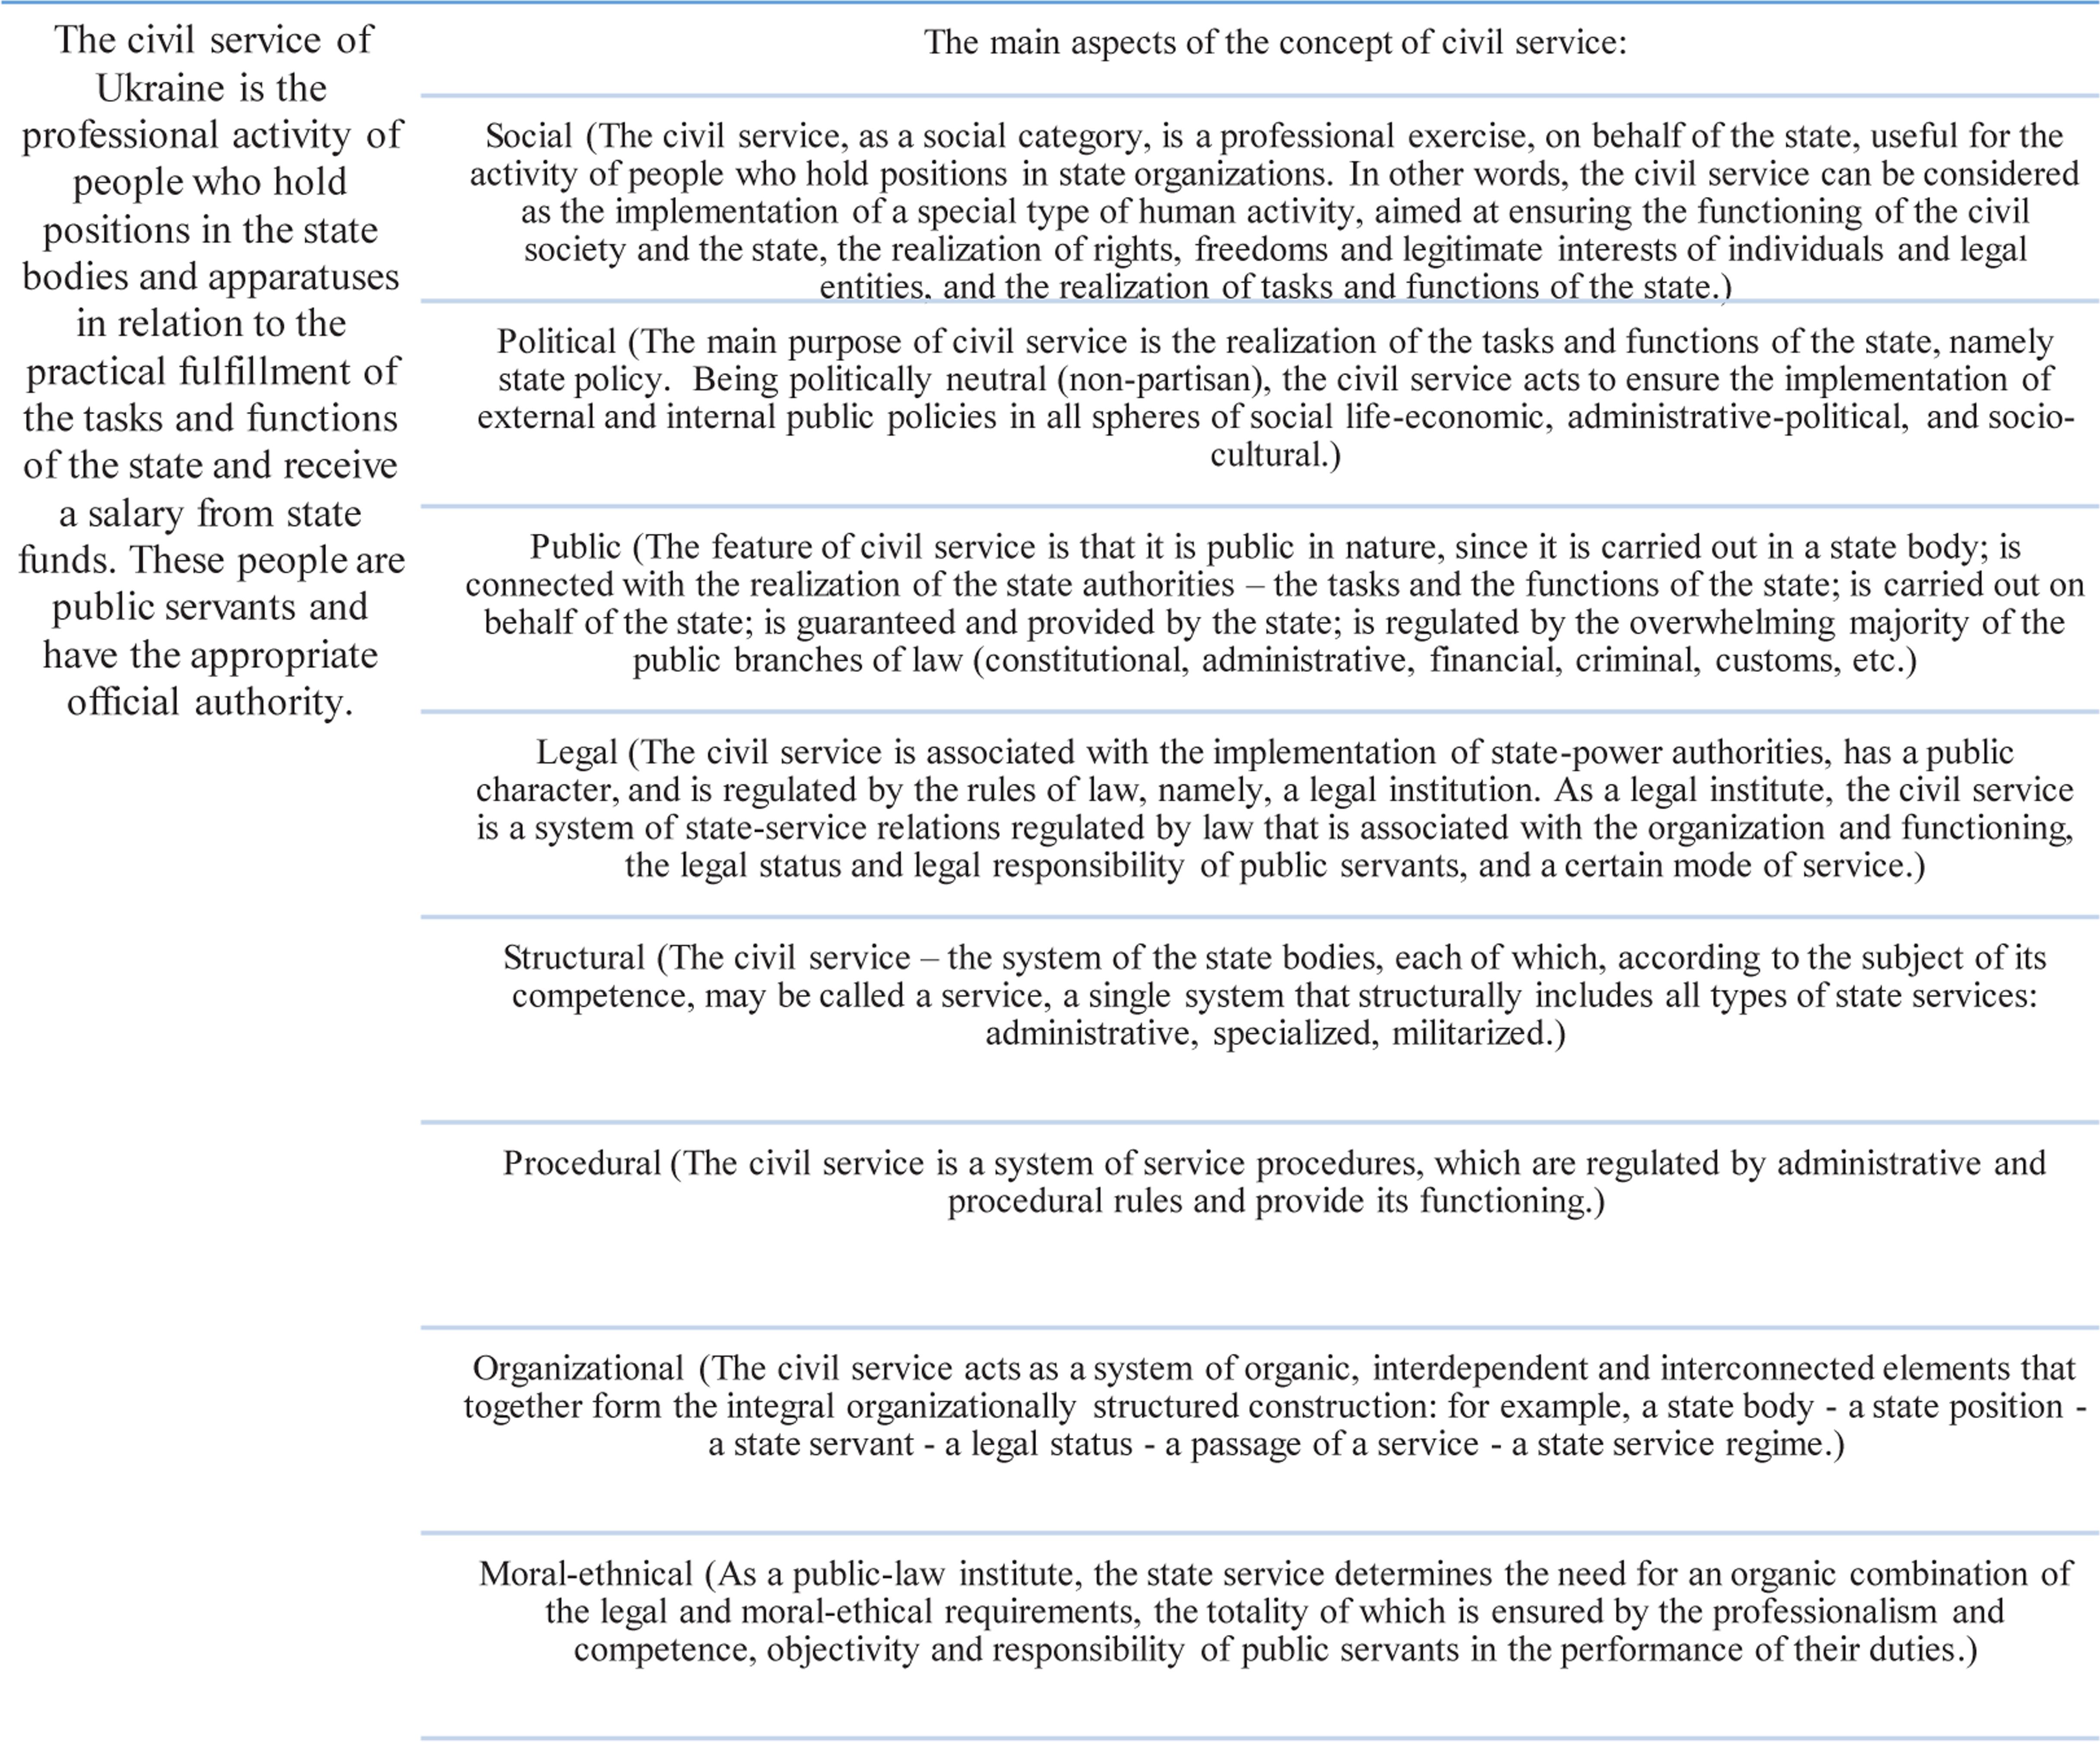
Fig. 1
The main aspects of the concept of “civil service”
Source: Drawn up by the authors on the basis of the Law of Ukraine (2015)
Tab. 1
Characteristics and values inherent for representatives of generations
| GENERATION | HISTORICAL ASPECT | CHARACTERISTICS OF REPRESENTATIVES | VALUES OF REPRESENTATIVES OF THE GENERATION |
|---|---|---|---|
| X | The era of global political changes and the introduction of technological innovations | Able to think alternatively, to be self-developed, to be adopted. They know what difficulties, independence and survival are; they are energetic and responsible people. | Individualism, ability to compete, desire for professional growth, profitability, pragmatism, devotion to the cause |
| Y | Period of powerful technological progress, economic recovery | Representatives are characterized by high computer literacy, freedom of choice and broad interests. Representatives of the generation have the ability to learn, quickly adapt to changes, and participate in the corporate life of the company. | Respect personal freedom and independence, build a quick and successful career |
| Z | Digital era | Representatives of the generation are brought up with information technologies, quickly process information and orientate themselves in innovative developments, are interested in science, robotics so on. | Freedom, free communication, the perception of the world with enthusiasm |
[i] Source: Own elaboration based on Shamis and Antipov, 2007
Tab. 2
Common and distinctive features of generations
| Categories | Generation | ||
|---|---|---|---|
| X | y | Z | |
| Leadership ambitions | Leadership is important for three generations | ||
| Coaching and mentoring | Freedom and responsibility | ||
| Entrepreneurial Ambitions | Interested in enterprise | ||
| Open own business | Work in an international company | ||
| Basic technologies | Software for project management | Cloud technologies and curriculum | Virtual reality |
| Conditions of work and study | Flexible working conditions | ||
| Online training | Personal communication | ||
| The question of vocation | All generations are worried about whether their work is right for them | ||
| Worried about a decent pension | A lack of opportunities for growth and instability of their position in the organization | Self-fulfillment | |
[i] Source: Systematized by the authors on the basis of INSEAD Emerging Markets Institute, Universum, MIT Leadership Center and the HEAD Foundation (Insead, 2019).
Tab. 3
Distribution of the number of public servants in Ukraine by gender, age and position for 2012–2017 (according to representatives of the generations)
| Categories | Number of persons | Age range (% of the total by the corresponding category) | |||||
|---|---|---|---|---|---|---|---|
| > 35] | (35;45] | (45;55] | (55;59] | (59;64] | (64 < | ||
| 2012 | |||||||
| Women | |||||||
| Leaders | 50617 | 26.4 | 35.3 | 36.3 | 1.9 | 0.2 | 0.0 |
| Specialists | 160271 | 58.9 | 23.0 | 17.4 | 0.6 | 0.1 | 0.0 |
| Total | 210888 | 51.1 | 26.0 | 21.9 | 0.9 | 0.1 | 0.0 |
| Men | |||||||
| Leaders | 24433 | 25.8 | 25.9 | 27.3 | 19.7 | 1.2 | 0.0 |
| Specialists | 39418 | 60.2 | 16.9 | 14.1 | 8.4 | 0.3 | 0.1 |
| Total | 63851 | 47.0 | 20.4 | 19.1 | 12.7 | 0.7 | 0.0 |
| 2013 | |||||||
| Women | |||||||
| Leaders | 26729 | 13.8 | 32.9 | 43.4 | 7.8 | 1.9 | 0.2 |
| Specialists | 48308 | 37.8 | 29.1 | 28.6 | 4.0 | 0.6 | 0.0 |
| Total | 75037 | 29.2 | 30.5 | 33.8 | 5.4 | 1.0 | 0.1 |
| Men | |||||||
| Leaders | 15267 | 12.6 | 23.5 | 34.4 | 23.7 | 4.4 | 1.4 |
| Specialists | 7695 | 43.8 | 19.9 | 20.6 | 13.8 | 1.8 | 0.1 |
| Total | 22962 | 23.1 | 22.3 | 29.8 | 20.4 | 3.5 | 1.0 |
| 2014 | |||||||
| Women's | |||||||
| Leaders | 23403 | 12.7 | 32.9 | 43.2 | 8.6 | 2.3 | 0.3 |
| Specialists | 40744 | 35.7 | 30.3 | 28.7 | 4.5 | 0.8 | 0.0 |
| Total | 64147 | 27.2 | 31.3 | 34.0 | 6.0 | 1.4 | 0.1 |
| Men's | |||||||
| Leaders | 13651 | 11.8 | 23.1 | 37.6 | 21.2 | 4.4 | 1.9 |
| Specialists | 6750 | 41.6 | 20.8 | 22.6 | 13.0 | 1.8 | 0.2 |
| Total | 20401 | 21.7 | 22.3 | 32.7 | 18.5 | 3.5 | 1.3 |
| 2015 | |||||||
| Women | |||||||
| Leaders | 23874 | 15.4 | 34.3 | 40.8 | 7.8 | 1.5 | 0.2 |
| Specialists | 40464 | 36.0 | 30.6 | 28.1 | 4.6 | 0.7 | 0.0 |
| Total | 64338 | 28.3 | 32.0 | 32.8 | 5.8 | 1.0 | 0.1 |
| Men | |||||||
| Leaders | 13101 | 16.5 | 26.1 | 36.6 | 17.1 | 2.6 | 1.1 |
| Specialists | 6026 | 43.2 | 22.0 | 22.1 | 11.2 | 1.4 | 0.1 |
| Total | 19127 | 25.0 | 24.8 | 32.0 | 15.2 | 2.2 | 0.8 |
| 2016 | |||||||
| Women | |||||||
| Leaders | 23946 | 15.4 | 34.4 | 40.9 | 7.8 | 1.5 | 0.2 |
| Specialists | 40585 | 36.1 | 30.7 | 28.2 | 4.6 | 0.7 | 0.0 |
| Total | 64531 | 28.4 | 32.1 | 32.9 | 5.8 | 1.0 | 0.1 |
| Men | |||||||
| Leaders | 13140 | 16.5 | 26.2 | 36.7 | 17.2 | 2.6 | 1.1 |
| Specialists | 6044 | 43.3 | 22.1 | 22.2 | 11.2 | 1.4 | 0.1 |
| Total | 19184 | 25.1 | 24.9 | 32.1 | 15.2 | 2.2 | 0.8 |
| 2017 | |||||||
| Women | |||||||
| Leaders | 24351 | 15.7 | 35.0 | 41.6 | 8.0 | 1.5 | 0.2 |
| Specialists | 41273 | 36.7 | 31.2 | 28.7 | 4.7 | 0.7 | 0.0 |
| Total | 65625 | 28.9 | 32.6 | 33.5 | 5.9 | 1.0 | 0.1 |
| Men | |||||||
| Leaders | 12918 | 16.3 | 25.7 | 36.1 | 16.9 | 2.6 | 1.1 |
| Specialists | 5942 | 42.6 | 21.7 | 21.8 | 11.0 | 1.4 | 0.1 |
| Total | 18859 | 24.7 | 24.5 | 31.6 | 15.0 | 2.2 | 0.8 |
[i] Legend:
 Public servants of Generations X and Y, as % of the total by age
 Public servants of Generation X, as % of the total by age
 Public servants of Generation Y, as % of the total by age
[ii] Source: Own elaboration based on information from the State Statistics Service of Ukraine, 2012–2017.
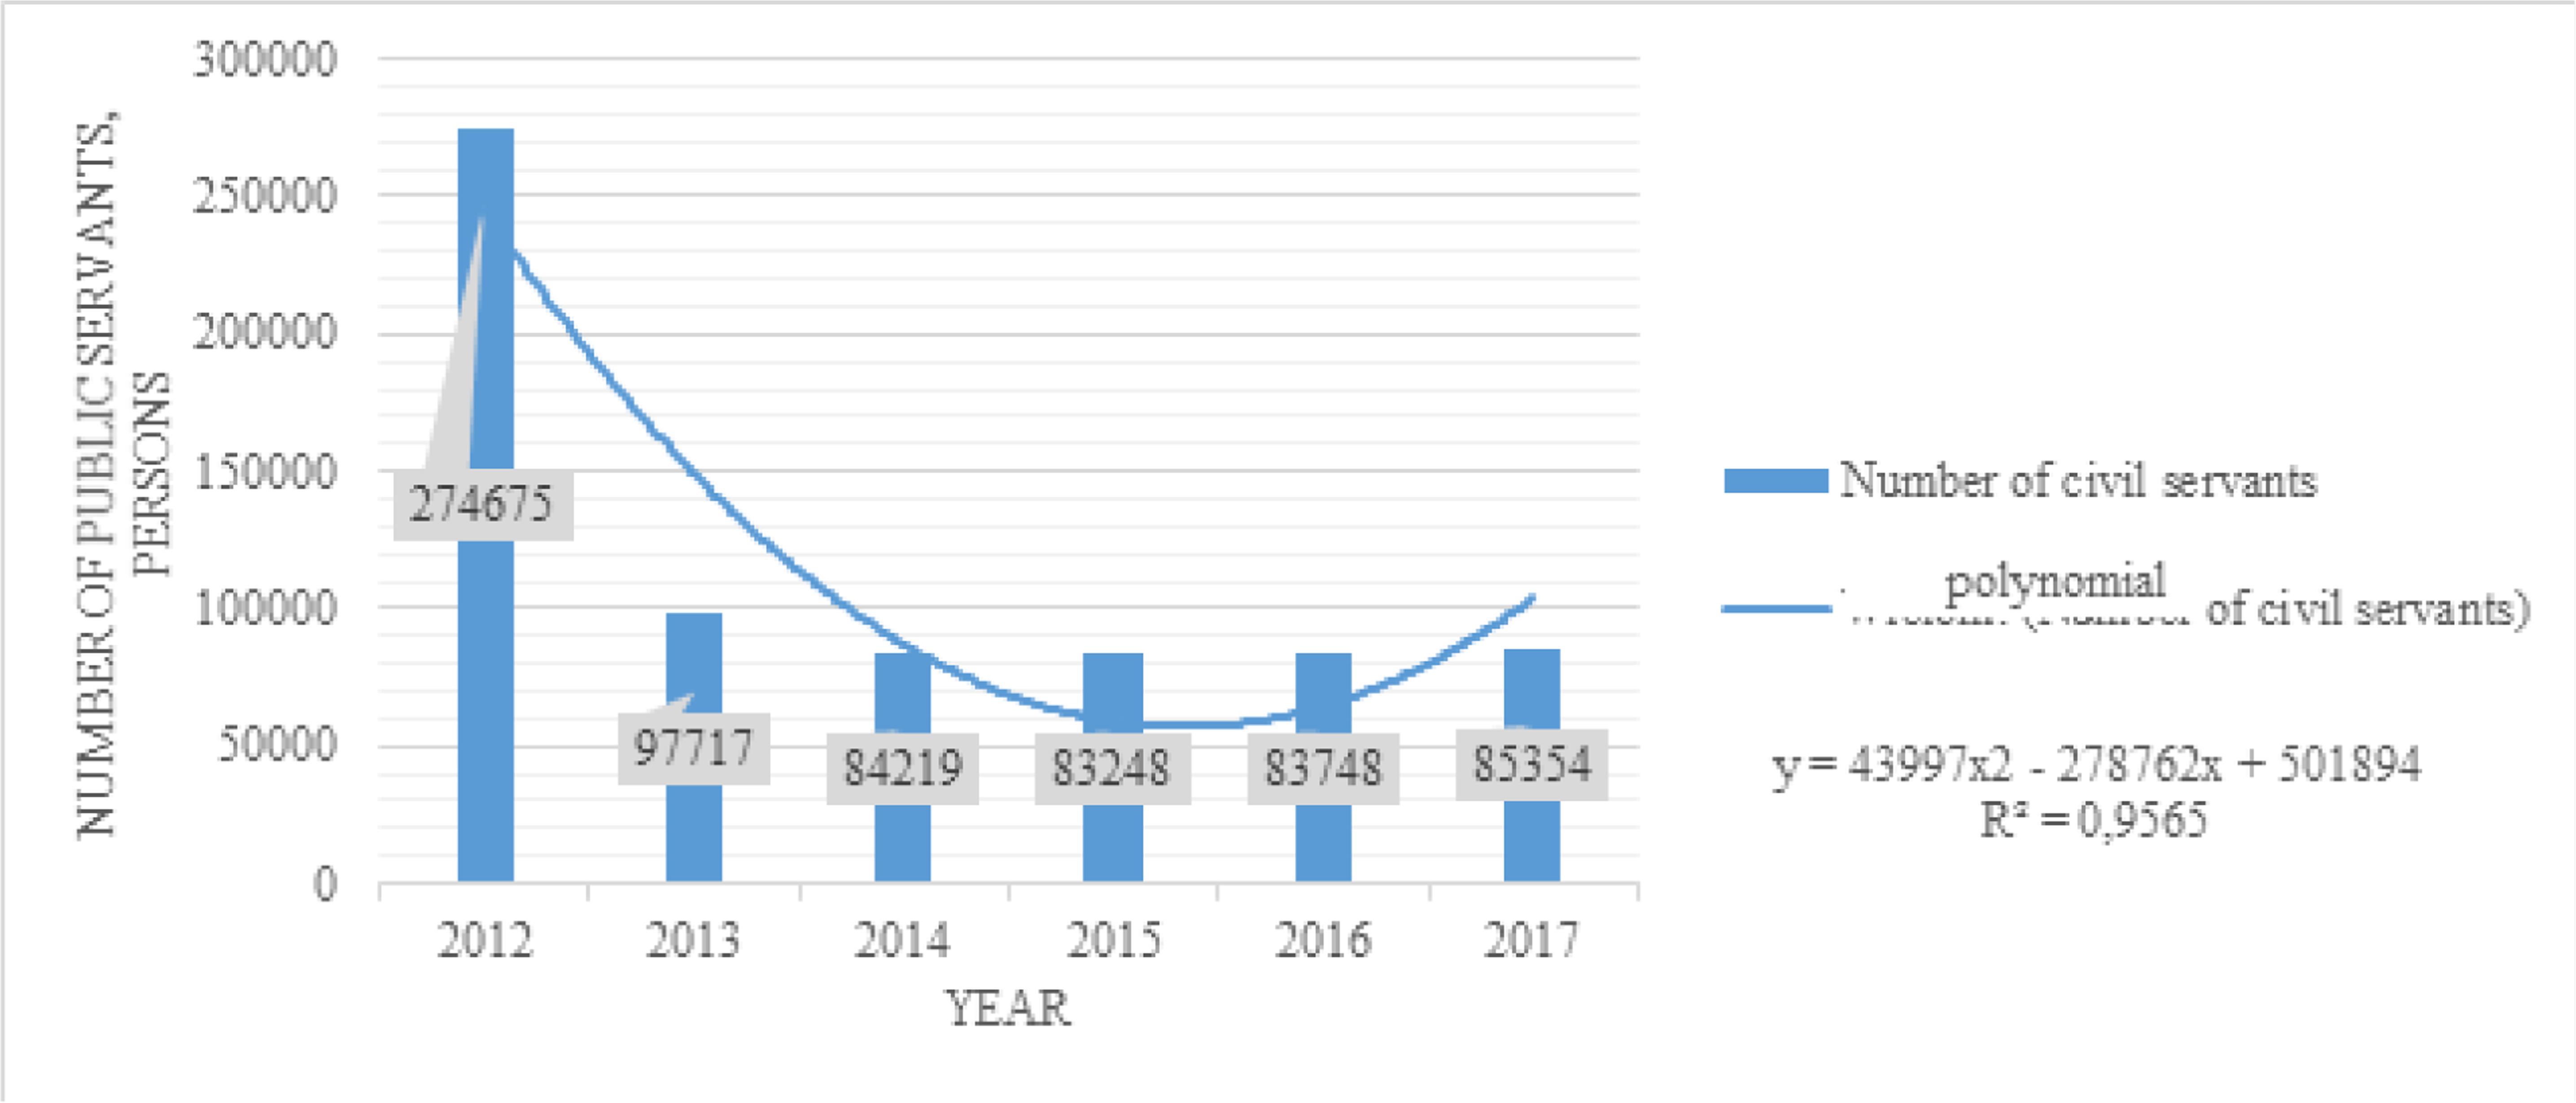
Fig. 2
The number of civil servants of Ukraine by age in 2012–2017
Source: Calculated by the authors based on information from Figure 3 and Table 3.
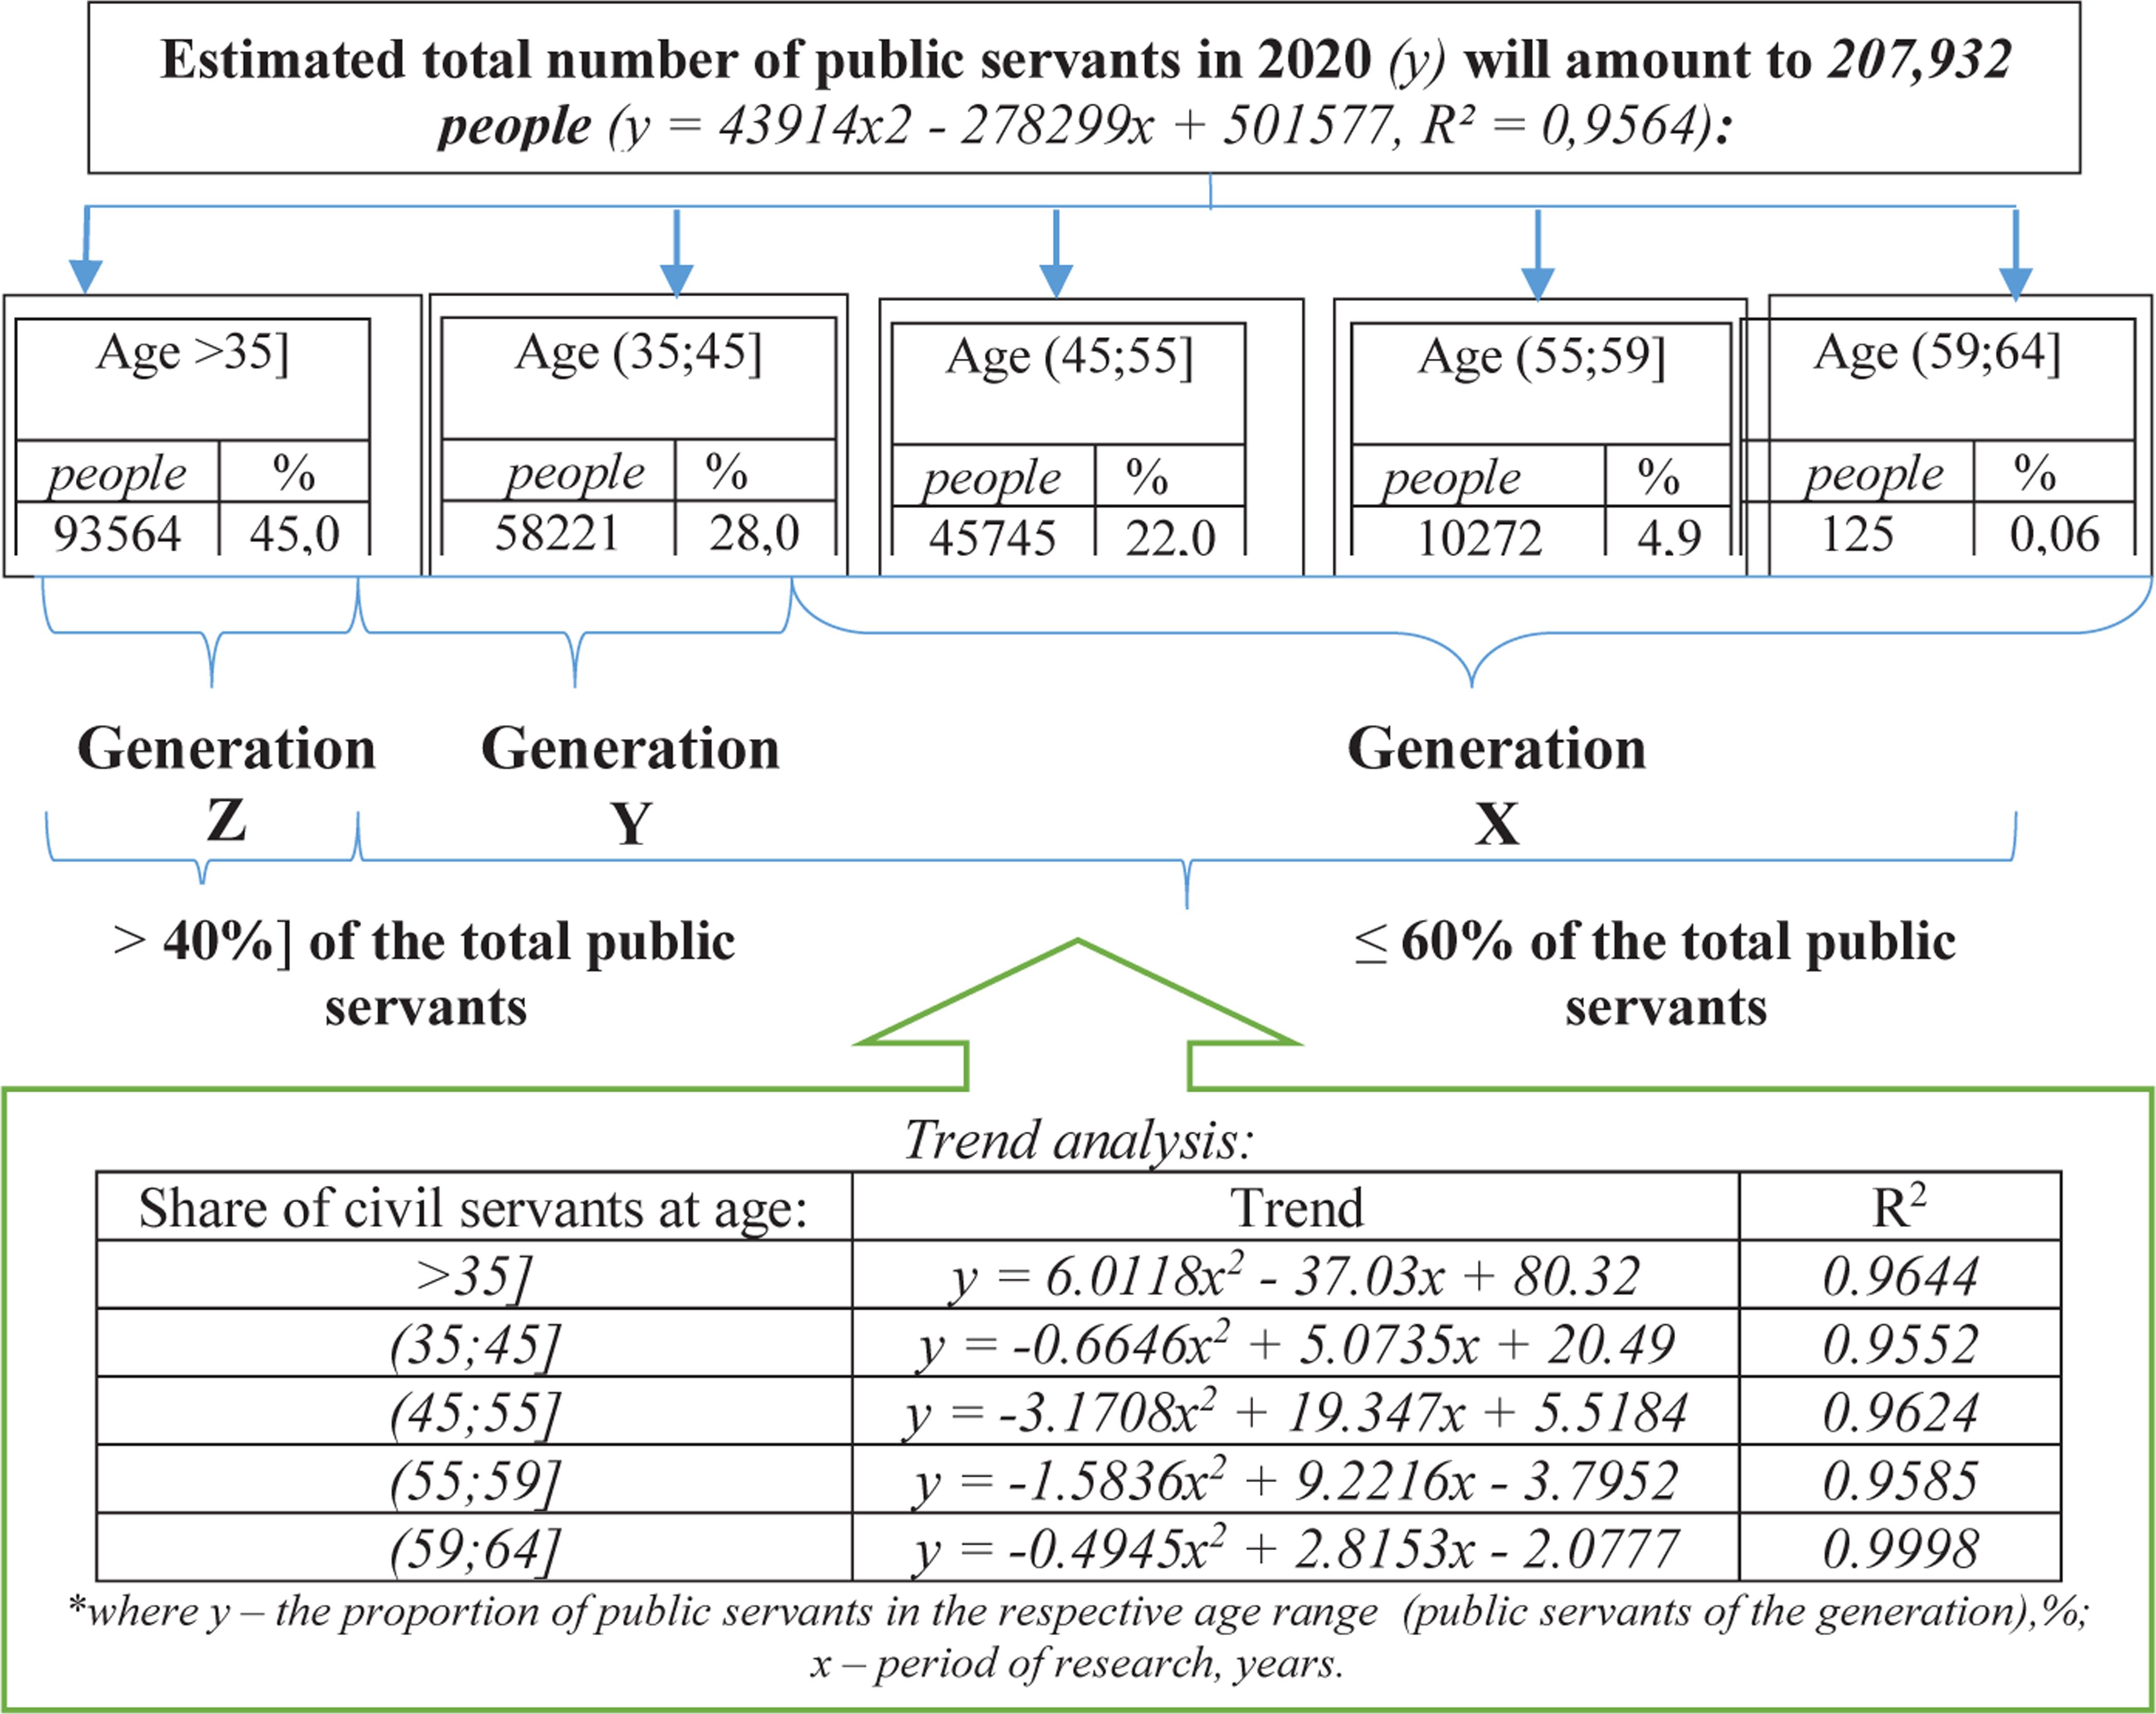
Fig. 3
Trends in changes in the share of public servants by 2020
Source: Calculated by the authors based on information from the State Statistics Service of Ukraine, 2012, 2013, 2014, 2015, 2016, 2017.
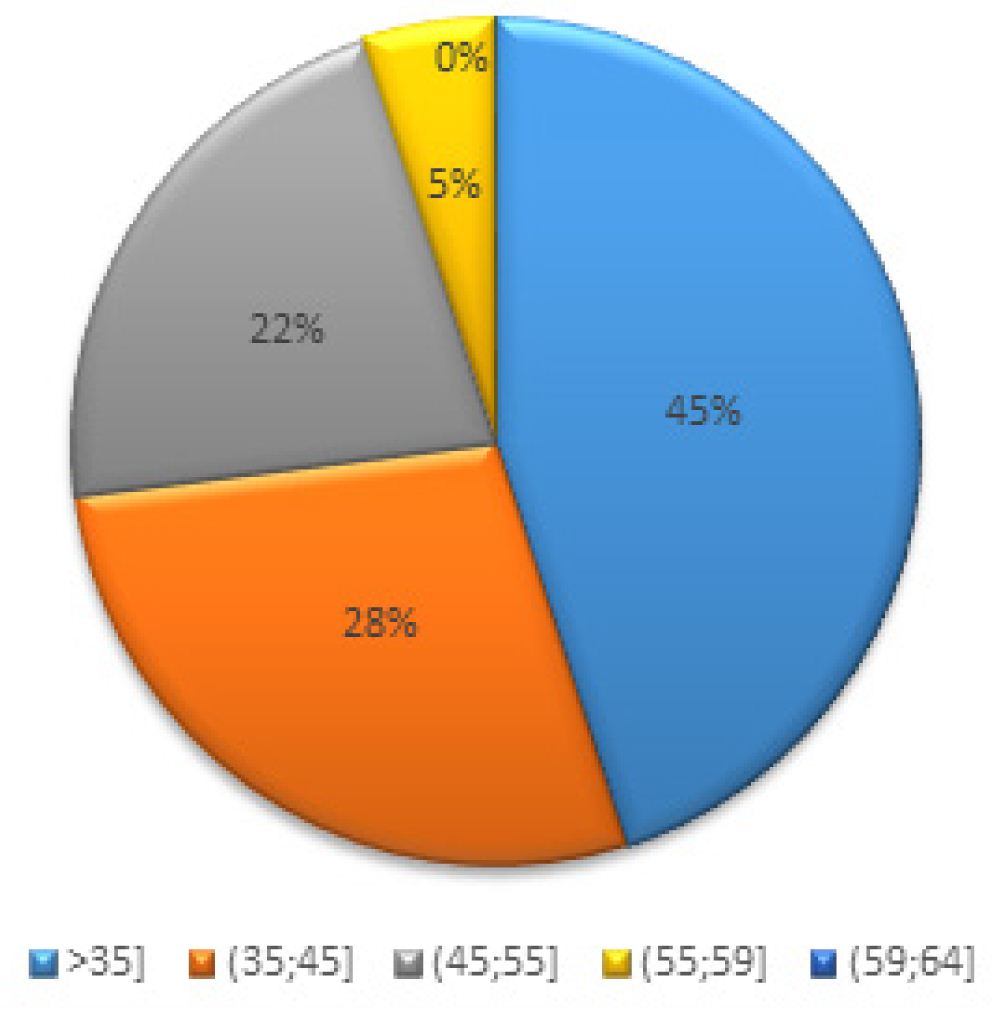
Fig. 4
The projected structure of the civil service of Ukraine by age in 2020
Source: Calculated by the authors based on information from the Figure 3.