

1. Introduction
In March 2025, the Sustainable Development Solutions Network released the latest edition of the World Happiness Report, once again placing Nordic countries at the top of the rankings, followed by other high-income countries (Helliwell et al., 2025). Its first publication in 2012 was the result of a United Nations High-Level Meeting that recognised happiness as a ‘fundamental human goal and universal aspiration’ (UN Resolution 65/309) and emphasised that happiness should be treated as a policy-relevant indicator of development in modern societies. Scholars have also framed happiness as a proxy for utility (Frey & Stutzer, 2002) and a holistic metric of social progress (Nikolova & Graham, 2021). While these approaches emphasise aggregate levels of happiness, they often overlook how happiness is experienced, recalled and interpreted across the life course—particularly in later life. Specifically, for older adults, reflections on the happiest moments in life are deeply intertwined with memory, personality and broader socio-economic trajectories (Berntsen & Rubin, 2002). In addition, paramount life experiences and anchor periods (Shmotkin, Berkovich & Cohen, 2006), such as the happiest period in life, are associated with present levels of happiness (Shmotkin & Shrira, 2012; Richardson et al., 2023).
It is an undeniable fact that people can be more or less happy at a given moment, and extensive research has already been conducted into the factors influencing people’s levels of happiness (see e.g. Clark and Oswald 1994; Cuñado and de Gracia 2012; Becker, Kirchmaier & Trautmann, 2019). Some studies have also addressed the determinants of fluctuations in happiness levels as a result of life circumstances with the aim of evaluating how permanent such changes are (e.g. Easterlin 2006; Lucas 2007; Diener, Lucas & Scollon, 2009; Luhmann & Intelisano 2018). However, much remains unknown about the determinants of whether and when people experience the happiest period in their lives and how long this period might last. On the one hand, it seems reasonable to assume that the longer the periods of relatively high levels of happiness a person enjoys, the greater their mean happiness over the course of their lifetime. On the other hand, however, if individuals identify a particular period with increased happiness, this might imply the existence of periods in their lifetime when they experienced lower levels of happiness, potentially indicating a decreased level of average happiness across their lifespan. In any way, it was previously shown that past feelings of happiness, as well as unhappiness, are associated with present happiness for older adults (Shmotkin & Shrira, 2012). The determinants of the existence and length of the happiest period in people’s lives as one of the crucial anchor periods (Shmotkin, Berkovich & Cohen, 2006) are therefore deserving of more attention in studies of lifetime well-being. Our paper aims at contributing to this field.
This article explores factors affecting both the probability that people can identify the happiest period in their lives and the length of that period among Europeans aged 50 and older. Our first hypothesis is that stable psychological traits and individual socio-economic characteristics (e.g. education) as well as changing socio-economic circumstances and family events influence both the probability of people being able to identify such a period and its length. Importantly, in our second hypothesis, we argue that both positive and negative circumstances and events can shorten the duration of people’s happiest periods and act as reference points allowing people to identify more and less happy periods in their lives. For example, events such as divorce, which negatively influences happiness (Baranowska & Matysiak, 2011; Cuñado & de Gracia, 2012), and marriage, which increases happiness (Grover & Helliwell, 2019), might help people to more accurately pinpoint the period of life in which they were happiest. Importantly, by taking into account both psychological traits and socio-economic characteristics and circumstances, we adopt an interdisciplinary approach combining views on happiness from the fields of economics and psychology. Noteworthy, given the scarcity of research on the happiest periods over the life course, our hypotheses remain rather explanatory.
Our analysis is based on the third and the seventh waves of the Survey of Health, Ageing and Retirement in Europe (SHARE), conducted in 2008/9 and 2017, respectively. This particular wave was the second version conducted under the auspices of SHARELIFE, which aims to gather data on respondents’ life histories (including details about their work history, relationships and childbearing). The sample we analyse consists of individuals over the age of 50 from 17 European countries. This sample allows us to examine a wider variety of important life events because older people have more life experience than younger individuals. First, we estimate a logistic regression to identify factors influencing the probability of a person being able to identify the happiest period in their life. Then, for individuals who reported being able to identify the happiest period in their lives, we make use of an Extended Cox Proportional Hazards Survival Model to determine what factors have influenced the length of this happiest period. The structure of the paper is as follows. Section 2 briefly outlines the theoretical background to our study through a review of the literature on happiness and life satisfaction. Section 3 then describes the data and methods used. Finally, Section 4 summarises our results and Section 5 discusses our conclusions and the limitations of our study.
2. Theoretical Background and Previous Findings
Subjective well-being is a broadly studied concept, sometimes referred to as happiness, though the two are not synonymous and are defined differently across cultures (Easterlin, 1974). It is considered a major aim of human lives (Frey, 2018a) and has been used as an indicator of how well a person’s life is going (Sheldon & Lucas, 2014). 1 Although many studies use happiness and life satisfaction interchangeably, they are not the same concepts. Life satisfaction is only one component of subjective well-being, which describes a person’s own cognitive assessment of their happiness. Two other components are positive affect and negative affect, which describe the momentary feelings and moods that contribute to a person’s happiness (Diener, 1984). According to Easterlin (2003a), the economic approach to happiness differs from the one typically used in psychology. While in economics a change in life circumstances is typically thought to result in lasting shifts in respect of a person’s happiness, psychological studies tend to refer to a ‘set point theory’ (Easterlin, 2003a; Headey, 2010). According to this theory, each individual has their own level of happiness, which is determined by personality traits and genetics (Lucas, 2007). Thus, even after major changes in their life circumstances, individuals will eventually return to their set point of happiness as a result of a hedonic adaptation process. There is, nonetheless, an extensive literature showing both that the happiness of individuals depends on a range of socio-economic factors and that the process of adaptation is not complete in all cases (Lucas, 2007; Diener et al., 2009).
Studies of subjective well-being often examine the factors influencing people’s level of happiness, while some have looked at the frequency with which people experience happiness or life satisfaction. Speaking generally, a number of socio-economic factors have been proven to significantly influence happiness, regardless of sample characteristics or the approach used. As far as stable or relatively stable individual characteristics are concerned, the evidence relating to the impact of gender on happiness is mixed, with some older studies suggesting that women tend to be happier than men (Gerdtham & Johannesson, 2001; Peiró, 2006; Eren & Aşıcı 2017) and others indicating that females are more likely to experience anxiety or depression (Rosenfield & Mouzon, 2013). Looking at the CEE countries in the post-transition period, we observe distinct gender patterns in subjective well-being, both in overall levels and in how socio-economic characteristics affect men and women differently, with the latter pattern not observed in other OECD countries (Schnepf, 2010). However, in a recent study based on long data series and covering different national contexts, Blanchflower and Bryson (2024) question the validity of this ‘female happiness paradox’. According to their results, men are happier than women, which is in line with some previous studies of older cohorts (Easterlin, 2003b). As far as education is concerned, existing research suggests that education level is positively correlated with happiness (Gerdtham & Johannesson, 2001; Angelini et al., 2012), However, others studies note that only the effect of higher education on happiness has been observed (Cuñado & de Gracia, 2012).
Also worth noting is that both cultural and regional differences and personality traits influence the way people perceive and report their happiness (Oishi et al. 2013; Anglim et al. 2020; Muresan, Ciumas & Achim, 2020). A recently conducted meta-analysis by Anglim et al. (2020) concludes that all of the Big Five personality traits—extroversion, neuroticism, openness, agreeableness and conscientiousness—are correlated with various aspects of subjective well-being, albeit to differing extents. Neuroticism, extroversion and conscientiousness usually exert stronger effects on happiness, but the lesser effects of the other two traits remain significant (Hayes & Joseph 2003; Anglim & Grant 2016). More neurotic people report lower life satisfaction and positive affect, but experience higher negative affect and the opposite is true for the other four traits (Anglim & Grant, 2016). Importantly, personality influences the effect of various life events on individual well-being (Anglim et al., 2020). As for regional differences, previous research has documented a ‘happiness gap’ between Central and Eastern Europe and other regions, particularly in the early 2000s, when individuals in post-transition economies reported systematically lower levels of subjective well-being than those in Western Europe and other developed regions (Djankov, Nikolova & Zilinsky, 2016). However, subsequent evidence suggests that this gap has gradually narrowed over time as these countries economically and institutionally converge with other European economies (Nikolova, 2016).
Other individual characteristics important in determining happiness levels may change quite dynamically over the course of a person’s life. In respect of economic factors, several authors have shown that happiness and income are positively correlated (Gerdtham & Johannesson, 2001) although this association may be curvilinear (Muresan et al., 2020). Also, as shown by Pittau, Zelli and Gelman (2010) for EU regions, the effect of personal income on life satisfaction depends on regional income, with the well-being of individuals living in poorer regions being more strongly affected by their personal income. This positive relation has been found to be stronger in poorer countries by comparison with more affluent countries (Diener & Seligman, 2009). Financial difficulties make it less likely that people will perceive a given moment to be the happiest period in life (Álvarez, 2022). Some studies have also addressed the link between life satisfaction and housing. Being a homeowner tends to be associated with higher levels of satisfaction than being a renter, which may be linked to the sense of stability that owning a property provides (Herbers & Mulder, 2017).
Another economic factor influencing happiness and life satisfaction is employment status. Unemployed people are less likely to be either happy or satisfied (Gerdtham & Johannesson, 2001; Cuñado & de Gracia, 2012), and this effect can be observed particularly strongly in people who have recently become unemployed (Clark & Oswald, 1994). Even after re-employment, however, well-being does not recover to previous levels (Diener & Seligman, 2009), indicating that a period of unemployment during a person’s lifetime can have a lasting negative impact on their well-being (Lucas, 2007). Unsurprisingly, then, unemployed people, and especially unemployed men, are comparatively unlikely to report being in the happiest period of their life (Álvarez, 2022). Previous studies have also shown that people transitioning from employment to retirement tend to become significantly happier (Horner, 2014), though their subjective well-being tends to drop significantly within a few years (Horner, 2014; Sohier, Van Ootegem & Verhofstadt, 2021). As far as the effect of employment on happiness is concerned, the evidence from existing research is mixed. Among other factors, this may be due to the fact that the relationship between employment and happiness is mediated by a variety of workplace characteristics, including e.g. how much people work and job satisfaction (Diener & Seligman, 2009; Eren & Aşıcı, 2017; Shao, 2022).
The quality of a person’s social networks has also been found to positively influence their happiness (Eren & Aşıcı, 2017; Becker et al., 2019) as people need social bonds and supportive relationships to experience and sustain well-being (Diener & Seligman, 2009). High-quality friendships are not only correlated with higher levels of well-being but also decrease loneliness, which is linked to an increased risk of depression (Kesebir & Diener, 2008). The sense of community provided by membership in a faith helps explain the positive correlation between religiosity and happiness (Frey, 2018b). Participation in religious worship has been found to increase people’s happiness, although the effect differs in extent across different national and denominational contexts (Kesebir & Diener, 2008). By a similar token, other dimensions of religious faith have been observed to increase life satisfaction, with the effect stronger in older populations (Yaden et al., 2022).
Looking from the perspective of an entire life span, several studies indicate that the relationship between happiness and age observes a U-shaped pattern, meaning that there is a point of minimum happiness in life, usually occurring in middle age (Clark & Oswald, 1994; Gerdtham & Johannesson, 2001; Peiró, 2006). This can appear puzzling given that people’s health inevitably declines in old age. As Blanchflower (2021) has recently shown, this U-shaped pattern of well-being through life can be observed universally, regardless of e.g. a country’s economic circumstances or average life expectancy. Across the board, people tend to be least happy around the age of 48. However, some studies suggest that this U-shaped pattern can be affected by social context. Helliwell et al. (2019), for instance, have shown a particularly sizeable decline in well-being in middle age for unmarried people and those not in work, which the authors explain with reference to social pressure to be married and employed during middle age. At the same time, research conducted by Graham and Ruiz Pozuelo (2017) indicates that people living in areas with higher average levels of happiness experience fewer years of decreased happiness. In addition, Álvarez (2022) concludes that people are most likely to experience the happiest period in their lives during their early thirties. However, studies linking these age-related results to significant moments in life, such as family events or health changes remain scarce due to what is still a paucity of longitudinal data on happiness.
Having a spouse or a partner and living with a partner (Herbers & Mulder, 2017) are correlated with higher levels of life satisfaction (Clark & Oswald, 1994; Angelini et al., 2012; Becker et al., 2019) and happiness (Cuñado & de Gracia, 2012). However, some studies suggest that the above positive effect holds only for those who are satisfied with their relationship (Eren & Aşıcı, 2017; Abramowska-Kmon & Timoszuk, 2020). Indeed, marital quality is strongly associated with both overall life satisfaction and moment-to-moment happiness, independent of other factors (Carr et al., 2014). Also, relationship satisfaction and well-being can change dynamically across the course of marriage, often increasing before marriage and declining afterward (Dupuis et al., 2025). Individuals in happy relationships report higher subjective well-being than those in unhappy relationships, and transitions into more committed relationships are associated with improvements in well-being (Dush & Amato, 2005). Although individuals adapt to marriage over time (Lucas, 2007), the positive effects of having a spouse persist over the course of a person’s life (Grover & Helliwell, 2019). On the other hand, several studies have indicated that being divorced, widowed or separated harms happiness and life satisfaction (Baranowska & Matysiak, 2011; Cuñado & de Gracia, 2012). At the same time, divorce and the death of a partner have been found to significantly reduce the likelihood of a person experiencing the happiest period of their life, with the impact of this factor diminishing over time (Cavapozzi, Fiore & Pasini, 2020). Importantly, experiencing the death of a partner has been shown to have a lasting negative effect on well-being, and complete adaptation has not been observed (Anusic, Yap & Lucas, 2014). In the case of divorce, the degree of adaptation depends on an individual’s personality traits (Perrig-Chiello, Hutchison & Morselli, 2015).
Studies looking at the relationship between parenthood and happiness have returned mixed results. According to some research, becoming a parent has a positive effect on happiness or life satisfaction, with this effect stronger for women (Baranowska & Matysiak, 2011). Moreover, the years in which a respondent’s children were born are more likely to be experienced as the happiest period of their life, with the effect again stronger for women (Álvarez, 2022). The positive effect of parenthood on happiness seems to diminish as children grow older due to increased parenthood-related stress and financial challenges (Blanchflower & Clark, 2021). There are also studies that suggest that having children may have a negative effect on parents’ happiness, but only where children live in the same household as parents; parenthood in general has had a positive effect on happiness (Becker et al., 2019).
As far as health is concerned, a number of studies have demonstrated that the better health a person has, the higher their reported happiness (Clark & Oswald, 1994; Cuñado & de Gracia, 2012; Eren & Aşıcı, 2017) and life satisfaction (Herbers & Mulder, 2017). This correlation appears to hold consistently across different national contexts (Peiró, 2006). Moreover, the probability of a particular year being included in the happiest period in a respondent’s life has been found to be lower if a respondent experienced illness in that year (Álvarez, 2022). However, in the case of young adults, only the effects of mental health—not physical health—have been found to significantly impact happiness (Perneger, Hudelson & Bovier, 2004). The authors explain this by noting that while young people are relatively unlikely to become seriously ill physically, the same is not true of mental illness. This observation points to the importance of linking factors influencing happiness to the period of life in which they are observed.
Overall, the mainstream of happiness research has focused on individual factors affecting current levels of happiness. Only recently have some authors begun to consider the impact of different life events on the probability of a person experiencing the happiest period in their life (Cavapozzi et al., 2020; Álvarez, 2022); so far, just a few studies have utilised this metric. Importantly, according to these few studies, factors positively influencing a person’s level of happiness tend also to increase the probability of their being able to identify the happiest period in their life. Looking at the happiest period in a person’s life might be considered a complementary way of measuring subjective well-being over the period of an entire lifetime. Our aim in this study is to take a closer look at this metric and thereby arrive at a better understanding of what makes people perceive some periods of their lives as happier than others and what factors influence the duration of these happiest periods. In the appendix to her study, Álvarez (2022) presents (albeit without detailed exposition) additional analyses of socio-economic factors influencing the likelihood of a person reporting a particular period to be the happiest period of their life. She does not control for individuals’ personality traits, however. In our view, combining individual psychological and socio-economic factors when analysing the determinants of subjective well-being can facilitate a better understanding of the forces that drive people’s happiness.
Additionally, there has been a noticeable lack of research into the factors influencing the length of the happiest period in people’s lives. In this paper, we intend to fill these gaps by further exploring this measure. We hope that a better understanding of what events and individual factors are correlated with longer periods of happiness will shed new light on what makes people lastingly happy throughout their lives. We believe that understanding the determinants of individuals’ happiest periods over the life course is especially relevant in the context of aging societies in Europe, as it can inform social and economic policies aimed at promoting successful aging on well-being.
3. Data and Methods
3.1. Data
Our analysis is based on data from the SHARE. This longitudinal survey gathers information about the health, employment, family and socio-economic circumstances of people aged 50 and older (and their partners) living in 27 European countries and Israel. Importantly, the third and seventh waves of SHARE, conducted in 2008/09 and 2017 respectively, provide a retrospective module called SHARELIFE. This module includes unique information about the most important events in respondents’ lives derived using a so-called life history calendar approach. A detailed description of the methodology of this approach is provided by Börsch-Supan and Schröder (2011). The data analysed in this paper derives from waves 3 and 7 and is supplemented with data from previous waves where appropriate, e.g. where respondents’ characteristics, such as their gender or education level, have not changed in the time that elapsed between the different waves of the survey. Supplementary data was also used where respondents from wave 7 who had also participated in wave 3 of SHARELIFE had been asked certain questions only in wave 3. Additionally, information about satisfaction from social networks was taken from waves 4 and 6. 2 67,945 respondents from 17 European countries participated in the initial sample. Respondents who did not provide information relating to our key variables (i.e. the happiest period of their lives) were then excluded from the sample, resulting in a final sample of 35,182 individuals. A list of participating countries is presented in Table 1 together with the number of respondents in the final sample.
Table 1.
Description of sample: proportion of respondents who identified the happiest period in their lives; mean age at the beginning of this happiest period; and its median duration—by country and region
| Country | Number of respondents | Region | Proportion of respondents who identified the happiest period in their lives | Mean age when the happiest period started | Median length of happiest period (in years) |
|---|---|---|---|---|---|
| Czech Republic | 2,957 | East Central Europe | 58.78 | 25.74 | 26.00 |
| Estonia | 3,063 | East Central Europe | 50.11 | 24.77 | 20.00 |
| Poland | 1,012 | East Central Europe | 44.76 | 24.87 | 21.00 |
| Denmark | 2,307 | Scandinavia | 38.71 | 30.02 | 13.00 |
| Sweden | 2,244 | Scandinavia | 45.32 | 27.43 | 18.00 |
| Croatia | 1,203 | South East Europe | 50.96 | 24.27 | 25.00 |
| Greece | 2,111 | South East Europe | 45.43 | 28.06 | 24.00 |
| Slovenia | 1,674 | South East Europe | 28.73 | 25.71 | 15.00 |
| Italy | 2,502 | South West Europe | 52.52 | 27.72 | 20.00 |
| Portugal | 762 | South West Europe | 50.26 | 25.36 | 25.00 |
| Spain | 2,842 | South West Europe | 48.91 | 26.39 | 29.00 |
| Austria | 1,854 | Western Europe | 41.59 | 28.19 | 14.00 |
| Belgium | 3,113 | Western Europe | 46.61 | 26.25 | 16.50 |
| France | 2,135 | Western Europe | 77.52 | 21.14 | 34.00 |
| Germany | 2,777 | Western Europe | 40.73 | 27.48 | 14.00 |
| Luxembourg | 771 | Western Europe | 39.82 | 24.87 | 16.00 |
| Switzerland | 1,855 | Western Europe | 38.87 | 27.82 | 16.00 |
| Total | 35,182 | - | 47.79 | 26.14 | 20.00 |
3.2. Method of Analysis
Our empirical analysis consists of two steps. First, we determine using logistic regression the factors that influence the likelihood of a person being able to identify the happiest period in their life. The dependent variable is measured using an answer to the question ‘Looking back on your life, was there a distinct period during which you were happier than during the rest of your life?’ with the possible answers ‘Yes’ and ‘No’. If hi represents a dummy variable—whether the respondent identifies the happiest period in their life—then the probability of their being able to identify the happiest period in their life can be expressed as follows.
In this formula Xi denotes a vector of explanatory variables and β represents a vector of corresponding coefficients.In the second step of our analysis, we focus only on people who were able to identify the happiest period in their lives. These respondents were asked to specify the year this period began (‘When did this period of happiness start?’) and ended (‘When did this period stop?’). For the second question, one answer option was that the person’s happiest period was still ongoing at the point at which they were being interviewed. 3 The second dependent variable thus measures the length of the happiest period in years, and this part of the analysis is based on the Extended Cox Proportional Hazards Survival Model. This model allows for the examination of factors influencing the duration of the happiest period in a person’s life, with the possibility of including time-varying covariates. For the chosen dependent variable, failure designates the end of the happiest period. If the happiest period of a person’s life was still ongoing at the point of the interview, the observations are censored. In general, the Extended Cox model can be expressed using the following formula, where λi(t) represents the hazard function and λ0(t) represents the baseline hazard at time t (Therneau & Grambsh, 2000).
In this formula, β represents a vector of coefficients, Xi denotes a vector of explanatory variables that meet the proportional hazards assumption, meaning they are time-independent, and Yi denotes a vector of time-dependent variables. For these variables there is an interaction of values with some function of time g(t). This model is a semi-parametric model which means that we do not assume that the baseline hazard function has any specific shape.The choice of logistic regression and extended Cox proportional hazards models is guided by our research question and the data structure, as these models allow us to examine both the probability of identifying a happiest period and its duration across the life course. The Cox model is particularly appropriate because, for some individuals, the happiest period was still ongoing at the time of the interview and the model accounts for this right-censoring.
3.3. Independent Variables
The explanatory variables included in the two estimated models form corresponding sets of variables in respect of the concepts they measure (e.g. divorce). In some cases, however, due to the different character of the analysis, they differ in respect of the operationalisation between the two estimated models. The variables can be divided into three groups according to their association with time. The list of variables, together with detailed descriptions of each variable and their descriptive statistics, can be found in Table A1 in the Appendix.
The first set of variables includes individual characteristics and personality traits that are considered to be fairly stable over time and are measured at the time of the interview. We first analyse respondents’ gender and their religiosity 4 measured by how often they engage in prayer. Next, in analysing respondents’ personality traits, we use indicators from the Big Five Personality Traits. These are neuroticism, extroversion, openness, agreeableness and conscientiousness, 5 all of which are measured on a rating scale where 1 is the lowest score and 5 the highest (cf. Bergmann, Scherpenzeel & Börsch-Supan, 2019). Additionally, we incorporate regional dummies to account for some of the cultural differences that can influence respondents’ perceptions and definitions of happiness (Easterlin, 1995). Regions are assigned to countries based on geographical location and cultural similarity (see Table 1).
The second set includes variables denoting factors that may vary over time, but which relate to respondents’ circumstances at the point at which they were interviewed. It also includes selected past events that form part of respondents’ life experience; this is because, as prior research has suggested (Frey & Stutzer, 2002), the level of well-being people report is influenced both by their present life circumstances and their accumulated experiences. We take into account household income per capita, number of years spent in education, 6 labour market situation, health status and past family events. Family events are defined as a set of dummies where 1 denotes experiencing a particular life event (e.g. divorce, losing a partner, being married or having a long-term partner, having children or grandchildren). Additionally, we consider past difficult events that might also influence the timing of the happiest period in a person’s life, such as experiencing hunger, discrimination, or financial difficulties. With regard to the age of respondents, in the first part of our analysis, we use age at the point of interview whereas in the survival analysis we use age at the start of the happiest period in a person’s life.
The third set of covariates is only used in the survival analysis and encompasses variables that vary over time, year by year, during the happiest period in a person’s life (see Table A1). We take into account a set of dummies describing respondents’ employment situation—more precisely, whether they worked, were unemployed or retired—during each year of the happiest period in their lives. We also include a set of dummies for family circumstances and family events e.g. whether a respondent was in a relationship, got married, divorced or lost a partner, or had a child 7 during a certain year. These variables were used in the second stage of our analysis i.e., Cox proportional hazards model. We also include a dummy for experiencing a serious illness in a particular year. Unfortunately, the SHARELIFE dataset does not allow us to obtain information about year-by-year household income or subjective perception of one’s material situation. Thus, in order to ascertain approximate level of wealth, we introduce a dummy variable for the year in which a respondent became a property owner.
4. Results
4.1. Incidence and Length of the Happiest Period—Cross-Country Comparisons
According to Table 1, presented in Section 3.1, almost 48% of respondents reported being able to identify a distinct happiest period of their lives. This period started on average at the age of 26, which aligns with previous research (Berntsen & Rubin, 2002), and the median length of people’s happiest period is 20 years. In the case of 38.6% of respondents who were able to identify the happiest period in their life, this period was still ongoing at the point at which they were interviewed. Among individual countries in our sample, France has the highest figures: more than three-quarters of French respondents were able to identify the happiest period in their lives, and the median length of this period is 34 years. Additionally, more than half of French respondents who were able to identify the happiest period in their lives said that this period was still ongoing at the point of interview (see Figure 1). French respondents’ happiest periods start, on average, 5 years earlier than across the sample as whole. At the opposite end of the scale, Slovenia has the smallest share of respondents who were able to identify the happiest period in their lives, while the shortest median length of the happiest period in people’s lives is observed in Denmark. Danish respondents also tend to date the happiest period in their lives to a later age (around the age of 30). The proportion of people who reported that the happiest period in their life was ongoing is smallest in Slovenia (<25%) followed by Germany (<30%).
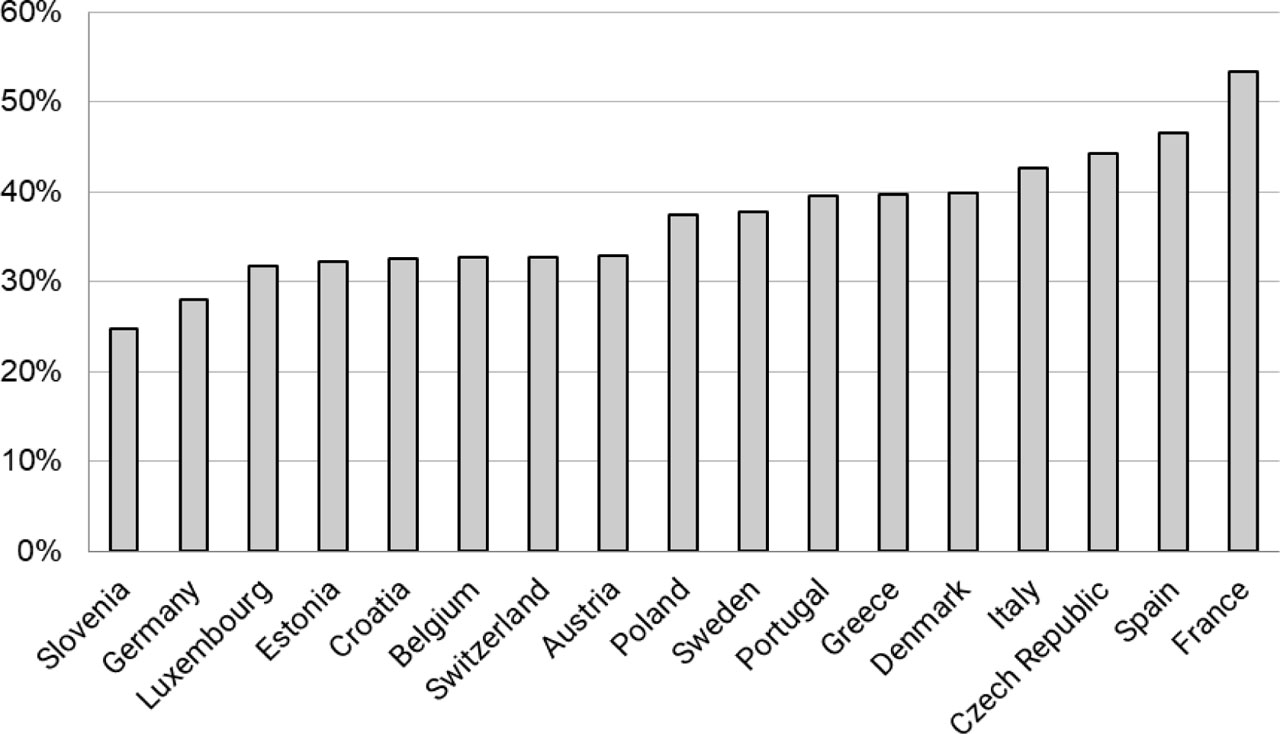
Figure 1.
Share of people who reported that the happiest period in their life was still ongoing (among those who were able to identify such a period), by country. Source: own calculations using SHARELIFE waves 3 and 7 (releases 7.1.0. and 7.1.1. respectively)
These results suggest the existence of cross-country differences in perception and timing in respect of the happiest period in people’s lives. Combining the mean age at the beginning of the happiest period in people’ lives with the median length of this period suggests that the happiest period in people’s lives usually begins in their twenties and end in their mid-forties. Moreover, taking into account that the people surveyed are all at least 50, differences in the proportion of people who reported being in the happiest period of the life at the point at which they were interviewed might be linked to cross-national discrepancies in older people’s well-being and quality of life (Somarriba Arechavala, Zarzosa Espina & Gómez-Costilla, 2021).
4.2. Who Is More Likely to Be Able to Identify the Happiest Period in their Life?
According to the results of our logit model (Table 2) for the probability that a person was able to identify the happiest period in their life, most covariates are statistically significant at conventional levels of significance. Females and better educated people are more likely to be able to identify the happiest period in their life, which is consistent with results obtained by Álvarez (2022) in her study of the probability of a person being able to identify the happiest period in their life. At the same time, older people are less likely to be able to identify the happiest period in their lives, which might possibly be linked to diminished cognitive capacity; this effect is rather weak, however. Finally, less religious people have a lower probability of being able to identify the happiest period in their lives compared to very religious people. 8
Table 2.
Logistic regression estimates of the probability of people being able to identify the happiest period in life
| Variable | Odds ratio | Std. Err. | z |
|---|---|---|---|
| Socio-economic characteristics | |||
| Female | 1.28*** | 0.03 | 9.99 |
| Education (in years) | 1.03*** | 0.00 | 8.78 |
| Logarithm of household income | 1.06** | 0.02 | 2.53 |
| Age at interview | 0.99*** | 0.00 | −4.75 |
| Current job situation (retired= ref.) | |||
| Employed or self-employed | 0.88*** | 0.03 | −3.58 |
| Unemployed | 0.92 | 0.08 | −0.93 |
| Permanently sick or disabled | 1.24*** | 0.10 | 2.80 |
| Homemaker | 1.04 | 0.05 | 0.79 |
| Other | 1.14 | 0.10 | 1.50 |
| Health status (excellent= ref.) | |||
| Very good or good | 1.13** | 0.06 | 2.43 |
| Fair | 1.21*** | 0.06 | 3.64 |
| Poor | 1.22*** | 0.07 | 3.32 |
| Relationships and family | |||
| Ever in a relationship | 1.20*** | 0.08 | 2.73 |
| Ever lost a partner | 1.49*** | 0.05 | 12.17 |
| Ever got divorced | 1.41*** | 0.04 | 11.34 |
| Had children | 1.13*** | 0.05 | 2.66 |
| Had grandchildren | 0.99 | 0.03 | −0.21 |
| Network satisfaction | 0.98** | 0.01 | −2.12 |
| Religiosity (very religious= ref.) | |||
| Religious | 0.95* | 0.03 | −1.77 |
| Not religious | 0.93*** | 0.03 | −2.69 |
| Difficult events | |||
| Experienced financial problems | 2.02*** | 0.05 | 28.28 |
| Experienced hunger | 1.15*** | 0.06 | 2.79 |
| Experienced discrimination | 1.47*** | 0.07 | 7.69 |
| Individual characteristics | |||
| Extroversion | 0.96*** | 0.01 | −2.90 |
| Neuroticism | 1.17*** | 0.01 | 12.89 |
| Openness | 1.11*** | 0.01 | 852 |
| Agreeableness | 1.08*** | 0.02 | 5.17 |
| Conscientiousness | 1.00 | 0.01 | 0.25 |
| Region dummies (South West Europe= ref.) | |||
| Scandinavia | 0.62*** | 0.03 | −9.83 |
| Western Europe | 0.73*** | 0.03 | −8.17 |
| East Central Europe | 0.91** | 0.04 | −2.16 |
| South East Europe | 0.59*** | 0.02 | −12.83 |
| Constant | 0.18*** | 0.05 | −6.21 |
| Number of observations | 35,182 | ||
Apart from conscientiousness, all of the analysed personality traits are statistically significant in terms of the probability of people being able to identify the happiest period in their lives. This demonstrates that personality traits are not only strongly associated with levels of subjective well-being, as previous studies have shown (Hayes & Joseph, 2003; Diener, 2009), but also influence how people evaluate their happiness over the course of a lifetime. Higher neuroticism, openness and agreeableness increase the probability that people are able to identify the happiest period in their lives, while extroversion decreases the probability of the same outcome. It would therefore appear that more neurotic individuals, who are more predisposed to negative affect (Kesebir & Diener, 2008), are more likely to be able to pinpoint the particular moment in their lives when they felt the happiest. This might be because they experience greater variability in negative affect in daily life (Mader et al., 2023) and tend to exaggerate high-arousal positive and negative emotions in retrospective reports, reflecting distinct personality-affect profiles over time (Lay et al., 2017). In contrast, emotionally stable individuals may experience more consistent happiness throughout life, making it harder to identify a single peak period. Moving onto the region dummies, 9 among all of the European regions under study residents of South West Europe are most likely to be able to identify the happiest period in their lives. People living in Scandinavia and South East Europe are least likely to be able to do so. The significance of these variables suggests the existence of cultural differences in how happiness is perceived; this is in line with previous findings (Easterlin, 1995; Muresan et al., 2020).
As regards the socio-economic context of happiness and its fluctuation during a person’s lifetime, those with greater household income per capita at the point of interview are more likely to be able to identify the happiest period of their life. The probability of the same is reduced for employed or self-employed people as compared to retired people. Surprisingly, unemployment has no significant effect on people’s ability to identify the happiest period in their life. This contrasts with previous findings that suggest that unemployed people are, on average, less happy (Clark & Oswald, 1994; Gerdtham & Johannesson, 2001; Cuñado & de Gracia, 2012) and might therefore be more likely to be able to recognise better times in the past. It is worth noting, however, that only about 1.70% of respondents were unemployed at the moment of interview (see Table A1), which might also be the reason why this effect turned out insignificant. At the same time, those who derive higher satisfaction from social networks are less likely to be able to identify the happiest period in their lives. This may be because high-quality social networks help people to sustain relatively high levels of happiness (Becker et al., 2019), with the result that it might be more difficult for a person to pinpoint a particular time as the happiest in their life.
In respect of past family events, people who have ever had a partner (whether they were married or not), been widowed or divorced or have a child were more likely to be able to identify the happiest period in their lives. This is in line with the already observed tendency (see e.g. Becker et al., 2019) for family life to influence people’s level of happiness. The greatest impact is observed in respect of the loss of a partner, followed by the effect for divorce. Meanwhile, previous research (Baranowska & Matysiak, 2011; Cuñado & de Gracia, 2012; Cavapozzi et al., 2020) suggests that divorced and widowed individuals tend to experience relatively low levels of happiness.
All variables that describe the experience of difficult events in the past have a statistically significant positive effect on the likelihood of people being able to identify the happiest period in their life. This is consistent with our findings on negative family events, and is also in line with previous research by Álvarez (2022) into the probability of people being able to identify the happiest period in their life. It also suggests that people may be able to pinpoint their happiest period more clearly if they have experienced difficulties in the past or are unwell at the point of being asked. This conclusion is supported by the observation that respondents who are permanently sick or disabled or who reported their health to be either fair or poor at the point at which they were surveyed are more likely to be able to identify the happiest life period in their lives compared to people who reported excellent health. At the same time, as previous studies have shown, worse health is associated with lower levels of happiness (Clark & Oswald, 1994; Cuñado & de Gracia, 2012; Eren & Aşıcı, 2017).
4.3. What Are the Factors That Influence the Length of the Happiest Period in a Person’s Life?
According to results of the Extended Cox model 10 presented in Table 3, most of the factors under analysis significantly influence the duration of the happiest period in a person’s life. Women are at higher risk than men of having the happiest period in their life curtailed by one of these factors. Education has a significant but negligible effect on the duration of the happiest period in a person’s life; each additional year of education increases the risk of this period ending, but only by some 3%. 11 As far as personal traits are concerned, neuroticism is insignificant with respect to the duration of a person’s happiest period, but the effects exerted by the other Big Five traits are significant. More extroverted, agreeable and conscientious individuals are more likely to have shorter happiest periods, while for more open people the opposite is true. It is worth noting that the effect of personality traits does not seem to change over time. 12 Thus, while according to previous studies, neuroticism is the strongest predictor of well-being levels among the Big Five Personality Traits (Anglim et al., 2020), this trait is not significant in respect of the length of the happiest period in a person’s life. Finally, residents of two European regions—Scandinavia and South East Europe—are at a higher risk of having the happiest period in their life curtailed compared to people in South West Europe. This, once again, demonstrates the importance of cultural differences as far as subjective well-being is concerned.
Table 3.
Cox regression estimates of the hazard ratio for a person having the happiest period in their life curtailed, including time-varying covariates
| Variable | Hazard ratio | Std. Err. | Z |
|---|---|---|---|
| Socio-economic characteristics | |||
| Female | 1.10*** | 0.03 | 4.08 |
| Education (in years) | 1.03*** | 0.00 | 6.71 |
| Homeowner | 1.71*** | 0.10 | 8.82 |
| Age at start | 1.00 | 0.00 | 1.54 |
| Job situation | |||
| In work | 1.24*** | 0.03 | 8.05 |
| Retired | 1.10** | 0.05 | 2.14 |
| Unemployed | 1.97*** | 0.20 | 6.54 |
| Health status | |||
| Illness | 1.11 | 0.09 | 1.21 |
| Relationships and family | |||
| Relationship | 0.63*** | 0.02 | −15.53 |
| Wedding | 1.80*** | 0.11 | 9.26 |
| Divorce | 4.74*** | 0.60 | 12.39 |
| Partner’s death | 20.08*** | 1.56 | 38.67 |
| Child | 1.69*** | 0.07 | 13.24 |
| Difficult events | |||
| Experienced financial problems | 1.17*** | 0.03 | 7.43 |
| Experienced hunger | 1.00 | 0.04 | 0.11 |
| Experienced discrimination | 1.12*** | 0.04 | 2.89 |
| Individual characteristics | |||
| Extroversion | 0.92*** | 0.02 | −4.40 |
| Neuroticism | 1.01 | 0.02 | 0.44 |
| Openness | 1.06*** | 0.02 | 3.22 |
| Agreeableness | 0.96*** | 0.01 | −3.23 |
| Conscientiousness | 0.91*** | 0.02 | −4.56 |
| Region dummies (South West Europe= ref.) | |||
| Scandinavia | 1.12** | 0.05 | 2.54 |
| Western Europe | 1.01 | 0.03 | 0.23 |
| East Central Europe | 0.94 | 0.05 | −1.21 |
| South East Europe | 1.10** | 0.04 | 2.52 |
| Interactions with time | |||
| Education | 1.00*** | 0.00 | −3.40 |
| Divorce | 1.03*** | 0.01 | 5.42 |
| Partner’s death | 1.03*** | 0.00 | 12.08 |
| Illness | 1.01** | 0.00 | 2.51 |
| Extroversion | 1.00** | 0.00 | 2.32 |
| Neuroticism | 1.00*** | 0.00 | 3.11 |
| Openness | 1.00** | 0.00 | −3.07 |
| Conscientiousness | 1.00*** | 0.00 | 3.18 |
| East Central Europe | 1.00** | 0.00 | −2.56 |
| Number of respondents | 15,153 | ||
| Number of observations | 382,119 | ||
Moving on to socio-economic circumstances that change over time, as far as employment is concerned we observe hazard ratios >1 for statuses denoting economic activity (employment and unemployment) as well as for retirement. Unemployment exerted the strongest effect in terms of curtailing the happiest period in people’s lives. It is therefore clear that not only does unemployment has a strong negative impact, as previous studies of happiness levels and life satisfaction (Clark & Oswald, 1994; Cuñado & de Gracia, 2012) and the probability of a person being able to identify the happiest period of their life (Álvarez, 2022) had already shown; it also has the effect of shortening the period in life that people experience as their happiest. In the case of retirement, the results we obtained are in line with earlier observations that, after an initial gain in happiness, retirees experience a significant drop off in subjective well-being over time (Horner, 2014). The results for employment, which our analysis suggests had the effect of shortening the happiest period in people’s lives, may appear counterintuitive. This might be linked to the fact that the relationship between employment and happiness is rather complex due to the mediating role of workplace characteristics (Diener & Seligman, 2009) and variations in job satisfaction (Eren & Aşıcı, 2017). Employment’s impact in terms of shortening the happiest period in people’s lives might therefore be driven by those with lower job satisfaction or worse work conditions, neither of which were controlled for in the model. Conversely, being in a relationship decreases by almost 40% the risk of people’s happiest period being curtailed, whether they are married or not. It can therefore be concluded that being in a relationship not only increases people’s level of happiness, as earlier studies (Peiró, 2006; Cuñado & de Gracia, 2012; Herbers & Mulder, 2017; Becker et al., 2019) have observed, but also lengthens the period they experience as the happiest in their lives.
Interestingly, buying a home increases the risk of the happiest period in a person’s life coming to an end; this is a rather counterintuitive result. The same holds for other assumedly positive life events such as marriage, childbirth, or the adoption of a child. One explanation for such outcomes might be that these situations, despite being associated with positive emotions, can also occasion a large amount of stress. Another possible explanation might be that when people look back at their lives, they tend to associate their happiest period with one of the above events. Such an interpretation is backed up by Álvarez’s (2022) finding that years in which a respondent’s children were born were more likely to be included in the happiest period in their lives. Given the major significance of such events, respondents would be more likely to remember the dates on which they took place. They might therefore use them as a guide when approximating the end of the happiest period in their lives.
In the same vein, negative life events also tend to curtail the happiest periods in people’s lives. The hazard ratios for events such as a partner’s death or divorce are, however, greater than for positive events such as marriage and childbirth. Where the death of a partner occurs during the first year of the period identified as the happiest in a person’s life, the risk of this period coming to an end increases some twentyfold (for divorce, almost fivefold). However, these negative effects tail off over time, which may indicate a partial adaptation to events (Lucas, 2007). In addition, those who experienced financial difficulties or discrimination at some point in their lives are at greater risk of having the happiest period in their life curtailed. As with other life events, these results might be explained by the fact that people who have had difficult life experiences can more precisely differentiate periods of happiness than those without such experiences. In addition, prior research (Shrira, Shmotkin & Litwin, 2012) has shown that experiencing a traumatic event has a long-term impact on happiness. Our model suggests, however, that experiencing a serious illness during the happiest period of one’s life has only a negligible statistical effect 13 in terms of curtailing this period. This outcome might be related to the fuzziness of the definition of ‘serious illness’; depending on the disease, illness might have radically different effects on people’s everyday lives and might, in some cases, be less significant than other difficult life events (e.g., divorce, unemployment) in determining the timing of the happiest periods in life.
5. Discussion
Our results support our hypothesis that both the stable characteristics of individuals and changing socio-economic circumstances have a significant impact on the probability of their being able to identify the happiest period in life, and on its length. As far as fairly stable individual characteristics such as personality traits or cultural background are concerned, our results paint a rather complex picture. More extroverted people are less likely to be able to identify the happiest period in their life, but where they do so this period tends to be relatively long. The happiest period in life is also comparatively long for more conscientious and agreeable individuals. In addition, the latter group is more likely to identify the happiest period in their lives, which also applies to more open and neurotic individuals. Finally, more open people tend to experience a comparatively short happiest period. Our results also reveal significant regional differences in people’s ability to identify the happiest period in their lives, confirming the existence of cultural differences when it comes to the perception of happiness.
Next, we also show that changing circumstances relating to people’s economic situations, family events and health status tend to have a significant positive impact on the probability of their being able to identify the happiest period in their lives, but also to reduce its length. At the same time, and as prior research (Frey & Stutzer, 2002; Van Praag & Ferrer-i-Carbonell, 2011) has shown, these are important determinants of levels of happiness, with some of them affecting happiness positively and some negatively. The likelihood of people being able to identify the happiest period in their lives is, however, significantly lower for people who are more satisfied with their existing social network. This might be linked to the role of social ties in stabilising levels of happiness over a lifetime (Becker et al., 2019). Interestingly, of all the factors we analysed that change over the course of a lifetime, only being in a relationship (whether married or not) has the effect of prolonging the happiest period in a person’s life. Moreover, as previous studies have demonstrated, being in a relationship increases people’s level of happiness (Clark & Oswald, 1994; Angelini et al., 2012; Cuñado & de Gracia, 2012; Becker et al., 2019).
As far as changes in employment status are concerned, our results could be considered mixed. Employed and self-employed people are less likely to be able to identify the happiest period in their lives, while for unemployed people, homemakers and others the effects of employment status are insignificant. This might be linked to the fact that we measured employment status at the point of interview, i.e. when respondents were, on average, 70 (see Table A1), thus referring to later stages of the life course rather than earlier. As far as the length of the happiest period in people’s lives is concerned, both statuses relating to economic activity—employment and unemployment—shorten this period, as does being retired, with unemployment exerting the strongest negative effect. While the results for unemployment and retirement might be linked to previous studies pointing to their negative impact on happiness levels (e.g. Cuñado & de Gracia, 2012; Horner, 2024), the effect of employment is rather puzzling. Such a result might be explained by the fact that employment is not directly linked to happiness, with the relationship rather being mediated by workplace characteristics and job satisfaction (Eren & Aşıcı, 2017), and work–life balance. Although our dataset does not include retrospective information on these factors, they could provide additional insight into why employment appears to shorten the happiest period and are worth exploring in future research.
As for our second hypothesis, we indeed find evidence that not only positive but also negative experiences and events increase the likelihood of people being able to identify the happiest period in their lives, which might seem counterintuitive. Specifically, divorced people, those who had lost a partner, and those in poor health are significantly more likely to be able to identify their happiest period. At the same time, and as previous research has shown, such family events are usually connected with lower levels of happiness (Clark & Oswald, 1994; Baranowska & Matysiak, 2011; Cuñado & de Gracia, 2012; Eren & Aşıcı, 2017). Moreover, individuals with experience of hardship, such as financial difficulty, hunger or discrimination are more likely to be able to identify the happiest period in their lives. In general, our findings suggest the conclusion that it is easier for people to distinguish between happier and unhappier periods in their lives if they have been exposed to painful experiences at some point in the past. This pattern may be interpreted in light of Frijda’s (1988) laws of emotion. In particular, the law of comparative feeling suggests that emotional evaluation depends on contrasts with reference states. Hence, individuals experiencing divorce, partner loss, or poor health may evaluate past life periods against their current adverse condition, thereby intensifying the salience of earlier ‘happiest’ phases. This indicates that links between life course trajectories and reported levels of happiness should not be neglected in future research.
Our finding that negative circumstances and events such as unemployment, losing a partner, or divorce had the effect of curtailing the happiest periods in people’s lives is in line with intuition. However, in respect of other, seemingly positive events such as buying a house, getting married and childbirth, our results are somewhat puzzling. We would propose three non-mutually exclusive explanations for this outcome. The first is that people are likely to link the happiest period of their lives specifically and precisely to such events. The second is that such positive events may cause increased stress, contributing to the curtailment of the happiest periods in people’s lives. The third draws on post-achievement depression (Kępiński, 1974), in which reaching a long-pursued goal can lead to emotional flattening once the striving phase ends. Buying a home, marriage, or childbirth, as major, effortful goals, may make the pursuit phase retrospectively feel like the ‘happiest period’, with mood declining after completion.
Some limitations to our study and potential directions for future studies should also be noted. One relates to the subjectivity of the metric used. The concept of the ‘happiest period’ is inherently subjective and may be interpreted differently by respondents. For example, social expectations might play a part in determining a respondent’s choice of the happiest period in their life. Also, retrospective recollections tend to be positively biased (Walker, Skowronski & Thompson, 2003). Nevertheless, negative life events still emerge as significant predictors of the timing and duration of the happiest period.
Next, since our analysis focuses on the timing and duration of the self-identified happiest period, it does not capture its intensity or within-period variability. SHARE life-history data do not provide year-by-year measures of happiness for retrospectively identified periods. While one can find longitudinal well-being assessments across survey waves, these do not necessarily correspond to the reported happiest spell. Therefore, future research could provide a more nuanced understanding of happiness intensity over the life course, with a specific focus on the happiest period in life. Similarly, it is worth exploring the potential heterogeneity across the sociodemographic as well as cultural subgroups to better understand the rationale of the choice of the happiest period.
Additionally, although our analysis includes a rich set of explanatory variables, some potential predictors of the timing and duration of the happiest period, such as death of a close family member or a friend, foreclosure of a mortgage, more detailed retrospective information on physical and psychological health, job satisfaction, or relationship quality, are not available in SHARE. The same applies to retrospective information on the subjective financial situation of the household. We suggest that future research could incorporate these additional characteristics to provide a more comprehensive understanding of the determinants of the happiest periods over the life course.
Moreover, during interviews, respondents were shown a calendar detailing key events in their life; bias related to this exposure might increase the probability of such socially validated events being included in the happiest period of people’s lives. We were, however, able to partly control for the impact of social expectations through the use of regional dummies. Finally, it should be noted that the majority of our sample is made up of people 60 and above. On the one hand, this benefits our study because of their greater life experience and the likelihood of them having experienced key life events. However, it is important to recognize that the natural decrease in cognitive capacity, including memory, that accompanies ageing may have affected the precision of the answers provided by our older respondents. Consequently, individuals with very low cognitive abilities or extremely low well-being are less likely to participate in SHARE, which may lead to underrepresentation of these groups in our analyses.
6. Conclusions
Overall, our findings suggest that many individuals recall their happiest life period as occurring in their twenties, but the occurrence and length of this period depend both on individual personality traits and, equally importantly, on changing life circumstances. Paradoxically, the experience of negative life events may enhance the clarity with which individuals later identify their happiest period, suggesting that contrast and adversity play a role in shaping retrospective evaluations of well-being over the ageing process. These results also highlight the value of complementing traditional, momentary measures of happiness with a life-course perspective that considers the probability of certain periods being remembered as happier than others. This underexplored approach captures the fluctuating and retrospective nature of happiness, particularly in later life, and offers meaningful insights. As a subjective and reflective measure, it merits further investigation, including assessments of its reliability and validity. Importantly, in the context of ageing societies in Europe, understanding the determinants of the happiest periods in life can inform social and economic policies aimed at promoting successful ageing. Policies that support social engagement, financial security and access to resources that reduce the impact of negative life events may help extend periods of high subjective well-being and contribute to more resilient and fulfilling life trajectories in older age.
Acknowledgements
This paper uses data from SHARE Waves 3 and 7 releases 7.1.0 and 7.1.1. respectively, see Börsch-Supan et al. (2013) for methodological details. The SHARE data collection has been funded mainly by the European Commission (see www.share-project.org for a full list of funding institutions).
Appendices
Appendix
Table A1.
Explanatory variables and their descriptive statistics (means for continuous variables and shares of respondents for binary and categorical variables)
| Variable | Description | Mean (st. dev.)/percentage | |
|---|---|---|---|
| Logit | Cox | ||
| Female | Dummy, 1 if a female | 59.04 | 64.41 |
| Education | Years of education | 11.01 (4.40) | 11.13 (4.37) |
| Household income | Household income per capita at the point of interview (Euro) | 14,999.19 (18,209.08) | - |
| Homeowner | Dummy, 1 if they became the owner of a house or apartment in this year | - | 32.19 |
| Age at interview | Age at the point of interview | 69.95 (9.27) | - |
| Age at start | Age at the beginning of the happiest period in their life | - | 26.15 (13.00) |
| Current job situation | |||
| Retired | Categorical variable with five levels describing the employment status at the point of interview | 67.08 | - |
| Employed or self-employed | 19.30 | ||
| Unemployed | 1.70 | ||
| Permanently sick or disabled | 2.35 | ||
| Homemaker | 7.92 | ||
| Other | 1.65 | ||
| In work | Dummy, 1 if respondent worked in this year | - | 83.96 |
| Retirement | Dummy, 1 if respondent was retired in this year | - | 32.27 |
| Unemployment | Dummy, 1 if respondent was unemployed in this year | - | 3.61 |
| Health status | |||
| Excellent | Categorical variable with four levels describing health status at point of interview | 5.88 | - |
| Very good or good | 53.61 | ||
| Fair | 29.92 | ||
| Poor | 10.59 | ||
| Illness | Dummy, 1 if respondent was seriously ill or disabled in this year | - | 10.31 |
| Ever had a partner | Dummy, 1 if has ever had either a married or unmarried partner | 96.25 | - |
| Relationship | Dummy, 1 if was in a married or unmarried relationship in this year | - | 87.98 |
| Wedding | Dummy, 1 if got married in this year | - | 55.74 |
| Ever lost a partner | Dummy, 1 if lost a partner | 16.75 | - |
| Death of a partner | Dummy, 1 if lost a partner in this year | - | 11.56 |
| Ever got divorced | Dummy, 1 if got divorced | 17.52 | - |
| Divorce | Dummy, 1 if got divorced in this year | - | 6.84 |
| Had children | Dummy, 1 if had children | 90.82 | - |
| Child | Dummy, 1 if respondent’s child was born or adopted in this year | - | 68.05 |
| Had grandchildren | Dummy, 1 if had grandchildren | 69.79 | - |
| Network Satisfaction | Satisfaction with social network, where 0 means completely dissatisfied and 10 means completely satisfied | 9.00 (1.20) | - |
| Religiosity | |||
| Very religious | Categorical variable with three levels, very religious means a person prays at least a couple of times a week, religious means a person prays at most once a week, and not religious a person who never prays | 36.36 | - |
| Religious | 22.50 | ||
| Not religious | 41.14 | ||
| Experienced financial problems | Have had a distinct period of financial hardship | 31.36 | 39.90 |
| Experienced hunger | Have had a distinct period during which they experienced hunger | 5.74 | 6.86 |
| Experienced discrimination | Have been a victim of discrimination or persecution | 5.50 | 7.07 |
| Extroversion | Extroversion score, where the greater the score is, the more extroverted the person is | 3.50 (0.94) | 3.49 (0.94) |
| Neuroticism | Neuroticism score, where the greater the score is, the more neurotic the person is | 2.64 (1.02) | 2.73 (1.04) |
| Openness | Openness score, where the greater the score, is the more open the person is | 3.31 (0.97) | 3.38 (0.98) |
| Agreeableness | Agreeableness score, where the greater the score, the more agreeable the person is | 3.72 (0.81) | 3.72 (0.81) |
| Conscientiousness | Conscientiousness score, where the greater the score, the more conscientious the person is | 4.11 (0.79) | 4.12 (0.79) |
Table A2.
Detailed results of the test of the proportional hazards assumption based on Schoenfeld residuals.
| Variable | rho | chi2 | df | Prob > chi2 |
|---|---|---|---|---|
| Female | −0.01 | 0.26 | 1 | 0.61 |
| Education | −0.03 | 9.80 | 1 | 0.00 |
| Homeowner | 0.01 | 0.73 | 1 | 0.39 |
| Age at start | −0.01 | 0.26 | 1 | 0.61 |
| In work | −0.02 | 3.05 | 1 | 0.08 |
| Retirement | 0.01 | 0.97 | 1 | 0.32 |
| Unemployment | 0.00 | 0.03 | 1 | 0.87 |
| Illness | 0.02 | 5.28 | 1 | 0.02 |
| Relationship | 0.00 | 0.00 | 1 | 0.98 |
| Wedding | 0.02 | 2.33 | 1 | 0.13 |
| Divorce | 0.04 | 18.31 | 1 | 0.00 |
| Partner’s death | 0.15 | 183.46 | 1 | 0.00 |
| Child | 0.01 | 0.77 | 1 | 0.38 |
| Experienced financial problems | 0.00 | 0.14 | 1 | 0.71 |
| Experienced hunger | 0.00 | 0.00 | 1 | 0.94 |
| Experienced discrimination | −0.01 | 0.94 | 1 | 0.33 |
| Extroversion | 0.02 | 4.30 | 1 | 0.04 |
| Neuroticism | 0.03 | 7.58 | 1 | 0.01 |
| Openness | −0.03 | 7.68 | 1 | 0.01 |
| Agreeableness | 0.00 | 0.23 | 1 | 0.63 |
| Conscientiousness | 0.03 | 7.79 | 1 | 0.01 |
| Scandinavia | −0.01 | 1.91 | 1 | 0.17 |
| Western Europe | −0.01 | 0.24 | 1 | 0.63 |
| East Central Europe | −0.02 | 4.75 | 1 | 0.03 |
| South East Europe | 0.01 | 1.24 | 1 | 0.27 |
| South West Europe | . | . | 1 | . |
| Global test | 316.82 | 25 | 0.00 |