

Exchange-traded funds are widely regarded as one of the most important innovations in global financial markets in recent decades, and as one of the most successful developments in the history of financial investing (Charupat & Miu, 2013). They have been gaining growing interest from both institutional and retail investors. For institutional investors, they function mainly as efficient hedging instruments and tools for liquidity management (EFAMA, 2023). Retail investors, in turn, tend to use them both as speculative trading products and as long-term investment vehicles in the context of savings and retirement planning.
The growing popularity of ETFs—primarily as passively managed investment vehicles, i.e., designed to replicate the performance of a specific index or benchmark—is evidenced by both the substantial increase in assets under management (AUM) (USD 16.99 trillion at the end of June 2025 (ETFGI, 2025a)) and the significant net inflow of capital (USD 1.88 trillion in 2024 alone (ETFGI, 2025b)). This development has led to a systematic increase in the importance of ETFs, especially in the U.S. collective investment institutions’ market. According to ICI (2025) total net assets of ETFs accounted for 26% of assets managed by all types registered investment companies at year-end 2024.
The popularity of ETFs is increasing also in Europe, although not as dynamically as in the U.S. Assets under management in the European ETF market amounted to EUR 2.20 trillion as of the end of the first half of 2025 (Glow, 2025), still they represent only 16.2% of total long-term UCITS (open-ended funds) net assets in Europe (as of year-end 2024) (EFAMA, 2025). The recent growth has been driven in part by retail investors, mainly young cohorts, who increasingly make use of savings plans and digital investment platforms offered by both neobrokers and traditional distributors (BlackRock, 2025).
The rising importance of ETFs is also clearly visible on stock exchanges. Over the last decade, the average daily share of ETFs in total U.S. stock market trading amounted to 27.2%, while during periods of market turbulence (e.g. in 2022 and 2023) it exceeded 30%, as investors—especially institutional ones—turned to ETFs to transfer and hedge risks quickly and efficiently (ICI, 2025). Similarly, in Europe ETF secondary market trading volumes have risen during periods of market stress. In March 2020 European ETFs traded 443 billion USD, i.e. 231% more than the average monthly volume in 2019, and on April 7, 2025 total volume spiked to 52.5 billion USD—around four times the 2024 daily average (BlackRock, 2025). These increased volumes show that investors seek the liquidity and transparency provided by ETFs in order to manage risk or to generate extraordinary gains in a turbulent market. A similar pattern is visible on the WSE where ETF trading volume increased from PLN 0.77 billion to PLN 1.48 billion in the years 2020–2024.
Trading ETFs involves two types of costs: direct and indirect. Among the latter premiums/discounts deserve special attention, as their impact on the investment result may be significant, yet ambiguous. Depending on the relationship between the market price and NAV, they can reduce returns (if buying at a premium and selling at a discount), enhance them (in the opposite case) or have no effect on performance (if the premium or discount remains unchanged) (Clancy, et al., 2021). Deviations between the market value of an ETF and the sum of its underlying securities are usually small and short-term owing to the creation/redemption process carried out by authorized participants on the primary market depending on investors’ demand, and the activity of market makers on the secondary market. The role they play in providing liquidity and correcting ETF mispricings makes these entities crucial to the ETF price alignment mechanism that is indispensable for the proper functioning of the ETF market (Kirilenko, et al., 2025).
On the other hand, arbitrageurs can utilize such discrepancies by taking opposite positions in the underlying portfolio and ETF units and then closing them through the creation/redemption process (Hilliard, 2014). Although the arbitrage mechanism largely eliminates or at least reduces deviations in an ETF’s price from its NAV, such discrepancies persist and—importantly—tend to be more pronounced in emerging markets, in funds holding international or illiquid securities, and particularly during periods of market turmoil.
According to the classical framework of finance, investors are assumed to behave rationally, which enables markets to operate efficiently and ensures that the prices of financial instruments reflect their fundamental values (Fama, 1970, 1998). The Efficient Market Hypothesis posits that the current market price of a given security should converge toward its intrinsic value. In the context of ETF valuation, this assumption implies that market prices and NAVs should be closely aligned. Any pricing deviations that emerge are expected to be exploited by arbitrageurs.
Pricing efficiency of ETFs is one of the key research areas on these financial instruments, alongside topics such as their tracking ability, performance, effects on underlying securities (Charupat & Miu, 2013); arbitrage opportunities (Gaba & Kumar, 2021); liquidity and volatility associated with ETFs, factors affecting the flows of funds into ETFs, the relationship between ETFs and volatility, ESG ETFs and behavioural finance and ETFs (Joshi & Dash, 2024). Other prominent themes include the active vs. passive funds debate, the impact of ETFs on market structures, their role as an investment alternative, financial market efficiency, and portfolio strategies (Malhotra, 2024).
Although the existence of premiums/discounts in ETF market is well documented for developed economies, it is much less recognized in emerging markets, especially in Europe (cf. next section). Therefore, this article focuses on the following research questions: (1) Are mispricings observed in the Polish market similar to those identified in other emerging markets? (2) Which categories of ETFs exhibit the highest and the lowest pricing efficiency? (3) Do funds listed on the WSE typically trade at a premiumor at a discount? (4) Is there a positive relationship between the size of equity ETF premiums/discounts and stock market volatility? (5) Do average asset-weighted and turnover-weighted deviations differ from equal-weighted ones?
The main aim of this paper is to investigate the pricing efficiency of all ETFs listed on the WSE over the last fifteen years, free of survivorship bias, i.e. from the beginning of their listing on this exchange. The analysis covers a wide range of stock market conditions, from the turbulences following the downgrade of the U.S. sovereign credit rating and the eurozone debt crisis in 2011, to the market stress triggered by the introduction of new tariff policies by U.S. President Donald Trump in April 2025.
Our main findings can be summarized as follows. First, deviations of the ETF market prices on the WSE from their respective NAVs tend to be relatively modest, and are similar to those observed in other emerging markets. The largest mispricings occur in leveraged funds, and in ETFs with exposure to foreign equity markets, while fixed income ETFs tracking Polish Treasury indices are the most effectively priced. Second, our study confirms the positive relationship between the size of equity ETF premiums/discounts and stock market volatility, particularly during market downturns. Third, average asset-weighted and turnover-weighted deviations are slightly lower than equal-weighted ones, implying that the actual costs for investors holding and, in particular, trading ETFs (since premiums/discounts are one of the elements of ETF total cost of ownership) are generally lower than those indicated by non-weighted deviations.
We contribute to the expanding research on ETFs in emerging markets in many ways. First, our study addresses a gap in the literature on European emerging markets, by analysing the pricing efficiency of these investment vehicles on the Polish market—one of the most dynamically developing in this region—over a relatively long period (2010–2025). Second, our sample contains four different types of ETFs: Polish and international equity, leveraged equity, and fixed-income funds. Third, we calculate both the actual and absolute deviations in an ETF price from its NAV, which makes it possible to assess not only the direction of deviations (positive or negative), but also their magnitude. Finally, we compute asset- and turnover-weighted averages, a scarce approach in the literature, which is crucial for assessing ETF pricing efficiency from the point of view of investors who hold and trade them.
The remainder of the paper is organized as follows. The next section presents a literature review, followed by a description of the data and research sample. The subsequent section outlines the methodology, and the next presents empirical findings and discussion. The final section concludes with the most important findings, study limitations, and further research directions.
The first studies examining deviations between ETF market prices and their net asset values (NAVs) appeared in the early 21st century, including the works of Ackert & Tian (2000, 2008), Elton, Gruber, Comer & Li (2002), Hughen (2003), and Jares & Lavin (2004). However, most of these studies focused on single ETFs or a limited sample—primarily equity funds investing in the U.S. market.
Subsequent research became more in-depth, encompassing a larger number of funds, including not only those with exposure to the U.S. market but also to foreign developed equity markets. Engle & Sarkar (2006) found that domestic ETFs generally exhibit small and transitory deviations, while international ETFs display higher and more persistent premiums or discounts due to arbitrage barriers. Delcoure & Zhong (2007) documented significant deviations in price-to-NAV ratios, which they attributed to excessive price volatility of ETFs. These deviations typically resolved within two trading days. In this context, Aber, Li, & Can (2009), who examined the price volatility and tracking ability of iShares ETFs, found that these ETFs traded more frequently at a premium than at a discount and exhibited relatively high intraday price volatility. Fulkerson & Jordan (2013) found that price-to-NAV deviations persisted for up to five trading days with some mean reversion. Hilliard (2014), based on a study of 801 ETFs representing various asset classes, also confirmed that domestic ETFs trade close to their NAV, while international ETFs often trade at premiums due to segmented liquidity and asynchronous trading. Building on this idea, Petajisto (2017) demonstrated that ETFs with liquid underlying securities are valued more efficiently, while those with illiquid or international assets exhibit persistent premiums. He further presented an investment strategy exploiting such emerging premiums/discounts. His conclusions were based on the broadest research sample, encompassing over 1,800 ETFs listed on U.S. exchanges.
Research indicates that liquidity plays a key role in ETF valuation. Broman (2016) and Piccotti (2018) emphasized that ETFs with more liquid underlying assets exhibit smaller premiums and discounts and lower tracking errors. In turn, ETFs with less liquid holdings are more prone to pricing inefficiencies. This finding is particularly relevant for niche ETFs, such as those focusing on clean energy or green bonds, as highlighted by Dias et al. (2024).
Levy & Liberman (2013), analysing intraday prices of 17 equity ETFs on the U.S. market, identified specific parts of the trading day during which NAVs, exchange rates, premiums and discounts, and the S&P 500 index exert a special influence on ETF prices. During synchronous trading hours with other markets, ETF prices are largely determined by their NAV returns, whereas during non-synchronous hours, the S&P 500 index exerts a dominant influence. This suggests an overreaction to U.S. market returns after the close of foreign markets. Marshall, Nguyen & Visaltanachoti (2010) also analysed the efficiency of intraday valuations, although their study focused only on two highly liquid instruments based on the S&P 500 index. Moreover, they demonstrated that differences in NAVs are generally smaller than the observed mispricing. Finally, they found no statistically significant relationship between the occurrence of arbitrage opportunities and the discrepancies between ETF market prices and their NAVs.
Research on the pricing efficiency of ETFs listed on emerging markets remains fragmented and often based on narrow samples. Most studies focus on ETFs listed on local exchanges, conventional ETFs tracking global stock indices, as well as those based on domestic benchmarks and regulated by national law. In particular, attention has been given to the analysis of Shariah-compliant Islamic ETFs (Yap, Lau & Ismail, 2021; Diaw, 2019; Almudhaf & Alhashel, 2020). Some studies focus on ETFs dedicated to emerging markets but listed in the U.S. exchanges. Rodriguez (2014), based on observations of iShares ETFs tracking Brazilian, Mexican, and Peruvian market indices, found that although these ETFs exhibit a close relationship between NAV and market price, other pricing factors are also important. He noted that ETFs in his sample were more often traded at a premium than at a discount, and that deviations from NAV typically persist for at least one day. Kreis, Licht & Useche (2016), examining a group of seven Latin American ETFs listed on the NYSE, documented significant deviations between ETF prices and their underlying assets across all ETFs. These deviations were generally larger than those in developed markets (e.g., the U.S.) and could be exploited through a long-short trading strategy.
Research on the Turkish market remains fragmented. Kayali (2007) analysed the pricing efficiency of the Dow Jones Istanbul 20 (DJIST)—the first ETF listed on the Istanbul Stock Exchange tracking the performance of the Dow Jones Turkey Titans 20 Index. He found evidence of efficient pricing in the Turkish market, as indicated by a strong relationship between the two series, with the ETF trading on average at a premium. He documented small price deviations of the analysed ETF from its NAV, with a limited number of significant discrepancies, most of which disappeared within two days.
Charteris (2013, 2014) conducted studies on the pricing efficiency of ETFs listed on the South African market relative to their NAV. She concluded that the market is efficient and that average price deviations from NAV—more frequently premiums—are transitory and do not persist for more than two trading days. In two subsequent co-authored studies she broadened the analysis of the South African market by incorporating several error-representation measures (Strydom, Charteris & McCullough, 2015) and expanded her research to include other emerging markets, namely Brazil, India, and South Korea (Charteris et al., 2014). Further studies on ETF valuation in the South African market were conducted by Badenhorst (2016) and Kunjal, Peerbhai & Muzindutsi (2021).
Lin, Chan & Hsu (2006) examined the pricing efficiency of ETFs in the Taiwanese market. Their analysis of deviations between market prices and NAVs, as well as absolute mispricing, showed that the Taiwan Top 50 Tracker Fund (TTT) exhibited high pricing efficiency and tended to trade at a slight premium. Jiang, Guo & Lan (2010) investigated the pricing efficiency of the Shanghai 50 ETF (SSE 50 ETF), the first ETF in China. The results demonstrate that ETF market prices and NAVs are cointegrated and there is unidirectional causality from price to NAV. They found that the SSE 50 ETF tends to trade at a small premium, but this premium is not statistically significant. The deviations do not persist over time and disappear within three trading days. Do et al. (2021) conducted analysis of one-minute data points for the valuations of the VFMVN30 ETF on the Vietnamese market, concerning intraday NAV. Their results indicated that the instrument displayed a small pricing deviation. This deviation was persistent, with limited variation across one-minute intervals. Reddy & Dabholkar (2020) studied the pricing efficiency of 39 equity ETFs tracking domestic as well as foreign market indices, listed on the two Indian exchanges—NSE and BSE. They concluded that the ETF market in India is partially efficient (most funds are traded at a premium), but there still exist arbitrage opportunities to market makers and investors. The results of an autoregression analysis showed that ETFs require between one and four days for the deviation between the NAV and market price to disappear. Malhorta & Sinha (2023) examined the pricing efficiency of 35 Indian ETFs that aim to mirror broader domestic indices before and during the COVID-19 pandemic. They found that mean deviation increased throughout the pandemic, and pricing inefficiencies shifted from discount to premium.
Al-Nassar (2021) compared the pricing efficiency of two domestic ETFs with exposure to the Falcom 30 and HSBC 20 indices, listed on the Tadawul exchange—with that of the iShares MSCI Saudi Arabia ETF, listed on the NYSE. By analysing the extent and characteristics of deviations between market prices and NAVs, he observed that all ETFs exhibited substantial mispricing, particularly in the case of domestic funds, with deviations persisting for at least three days. Premiums and discounts were further exacerbated during periods of market turbulence. Almudhaf (2019) also investigated ETF valuations in the region, comparing market prices and NAVs in selected Gulf Cooperation Council (GCC) markets (Saudi Arabia, Kuwait, Qatar) and confirmed the presence of pricing inefficiencies.
Academic articles concerning ETFs listed on the WSE have primarily focused on legal and regulatory aspects, as well as the development and functioning of these instruments in the Polish regulated market. Empirical studies on ETF pricing efficiency on the WSE have so far focused mainly on the quality of their replication of index performance—e.g. Chodnicka & Jaworski (2012) and Miziołek & Feder-Sempach (2018). Mitrenga (2013) remains the only researcher to have examined ETF pricing efficiency on the WSE directly, focusing on a single fund (Lyxor ETF WIG20) during its initial listing period (2010–2012). He observed that premiums occurred more often than a discounts, with an average values 38 and 43 bps, respectively. The correction of the resulting deviations occurred faster in the case of discounts (3 days on average), while premiums persisted longer (almost 4 days). To the best of the authors’ knowledge, no comprehensive study of ETF pricing efficiency relative to NAV on the WSE—covering all such instruments and the entire period of their listing—has been conducted to date.
In our research, we use mainly two types of data on exchange-traded funds: (1) net asset values per unit (NAV) (in case of Beta ETFs—per investment certificate of a closed-end portfolio fund, and in case of Lyxor/Amundi ETFs—per unit of a sub-fund of foreign open-ended investment fund), and (2) official closing market prices at the end-of-the day (P_EOTD). Unlike some other studies (e.g. Petajisto, 2017), we do not use midquote prices (i.e. average of the bid price and the ask price at market close) due to unavailability of bid–ask data. All data were obtained from Bloomberg. We use daily, weekly and monthly NAVs and P_EOTD values. In total, our sample comprises 20,340 daily, 4233 weekly, and 981 monthly ETF observations.
The study contains all daily observations, including those where the deviations between the NAV and the P_EOTD market price were exceeded 10%. Unlike some studies (e.g. Petajisto, 2017; Piccotti, 2018), which exclude differences above 20% on the assumption that they reflect data errors, we chose to retain such observations in the research sample. This decision reflects the fact that large premiums/discounts occur relatively often in emerging equity markets and in ETFs exposed to them (as opposed to developed markets)—mainly due to their immaturity and low liquidity, especially during significant turbulence.
Additionally, we obtained monthly data on ETFs’ AUM from Chamber of Fund and Asset Management reports. Basic statistics about funds and number of observations are presented in Table 1.
Basic information about exchange-traded funds in research sample and number of observations
| Fund* | Investment management company (IMC)* | Investment category** | Replicated index*** | Assets under management*** (PLN millions) | Number of observations | ||
|---|---|---|---|---|---|---|---|
| daily | weekly | monthly | |||||
| Lyxor WIG20 UCITS ETF | Lyxor International AM | PE-NL | WIG20 | N/A**** | 2645 | 553 | 127 |
| Amundi S&P 500 II UCITS ETF EUR Dist | Amundi AM | FE-NL | S&P 500 Net Total Return | N/A***** | 3476 | 726 | 168 |
| Amundi DAX III UCITS ETF Acc | Amundi AM | FE-NL | DAX | N/A***** | 3476 | 726 | 168 |
| Beta ETF WIG20TR PFIZ | AgioFunds TFI | PE-NL | WIG20TR | 133.22 | 1586 | 329 | 76 |
| Beta ETF mWIG40TR PFIZ | AgioFunds TFI | PE-NL | mWIG40TR | 346.80 | 1419 | 295 | 68 |
| Beta ETF WIG20short PFIZ | AgioFunds TFI | PE-NL | WIG20short | 49.28 | 1362 | 283 | 66 |
| Beta ETF WIG20lev PFIZ | AgioFunds TFI | E-L | WIG20lev | 52.77 | 1303 | 270 | 63 |
| Beta ETF Nasdaq-100 PLN-Hedged PFIZ | AgioFunds TFI | FE-NL | Nasdaq-100 Notional Net Total Return | 38.92 | 1063 | 220 | 51 |
| Beta ETF S&P 500 PLN-Hedged PFIZ | AgioFunds TFI | FE-NL | S&P 500 Net Total Return | 45.04 | 1038 | 215 | 50 |
| Beta ETF WIGtech PFIZ | AgioFunds TFI | PE-NL | WIGtech | N/A****** | 649 | 134 | 31 |
| Beta ETF sWIG80TR PFIZ | AgioFunds TFI | PE-NL | sWIG80TR | 109.32 | 848 | 176 | 41 |
| Beta ETF TBSP PFIZ | AgioFunds TFI | FI | TBSP | 78.10 | 826 | 171 | 40 |
| Beta ETF Obligacji 6M PFIZ | AgioFunds TFI | FI | GPWB-BWZ | 46.33 | 333 | 69 | 16 |
| Beta ETF Nasdaq-100 3xlev PFIZ | AgioFunds TFI | E-L | Nasdaq-100 3x Leveraged Notional Net Total Return | 26.33 | 158 | 33 | 8 |
| Beta ETF Nasdaq-100 2xshort PFIZ | AgioFunds TFI | E-L | Nasdaq-100 2x Short Total Return | 4.11 | 158 | 33 | 8 |
- name of the fund/name of the IMC at the end of the research period or end of operations.
- PE-NL—Polish equity—non-leveraged, FE-NL—foreign equity—non-leveraged, E-L—equity-leveraged, FI—fixed income.
- at the end of April 2025 or on the day of termination of operation.
- fund was delisted 28th April 2021.
- fund reports only total AUM, data on AUM in relation to WSA listing are not available.
- fund was converted into Beta ETF Obligacji 6M on 29th December 2023.
The overall study period covers almost 15 years, i.e. from September 2010 (the debut of first ETF on WSE) to the end of April 2025. The average operating period of the funds within the research period was 65 months, ranging from 168 (Amundi S&P 500 II UCITS ETF and Amundi DAX III UCITS ETF) to 8 months (Beta ETF Nasdaq-100 3xlev and Beta ETF Nasdaq-100 2xshort).
Our sample covers all 15 exchange-traded funds listed on WSE in the study period. It is free of survivorship bias, as it includes both 13 ETFs operating at the end of the research period (live funds) and 2 that had ceased operations (one liquidated, and another converted into a new fund). Total AUM of 11 live funds (except for Amundi ETFs for which no data was available) amounted to 930.22 PLN million at the end of the research period. Figure 1 presents the time series of the number of ETFs included in the sample and their total AUM. Both the number of funds and their net assets began to grow significantly in 2019, coinciding with the launch of the first Beta ETFs.

Number of ETFs in the research sample and their AUM
* - except for Amundi ETFs (no available data)
Source: own study
The research sample includes 13 equity ETFs and two fixed income funds, all of which are passively managed. Among the equity funds, seven have exposure to the Polish equity market, tracking the performance of WSE indices, and six have international exposure, tracking major U.S. and German stock indices—S&P 500, Nasdaq-100, and DAX. The two fixed-income funds replicate the performance of Polish Treasury bond indices (TBSP and GPWB-BWZ). All ETFs in the sample were classified into four peer groups (sub-samples) based on two criteria: investment exposure and the use of leverage: Polish equity funds—non-leveraged (PE-NL ETFs) (6 ETFs), foreign equity funds—non-leveraged (FE-NL ETFs) (4 ETFs), equity funds—leveraged (E-L ETFs) (3 ETFs), and fixed-income funds—Polish government bonds (FI-PGB ETFs) (2 ETFs).
Most of the funds (12) are domestic ETFs (operating in the legal form of closed-end funds) registered in Poland, with the WSE as their primary listing venue, and AgioFunds TFI as their manager. Three ETFs are sub-funds of the foreign open-end investment funds compliant with UCITS Directive. Two of them, still operating, are currently managed by Amundi Asset Management and cross-listed on various European trading platforms, while one—already liquidated—was formerly managed by Lyxor International Asset Management.
In our study, we apply the standard methodology, calculating the ETF unit price premium or discount as the percentage deviation between the closing market price and NAV:
When this deviation is positive, this means that the ETF unit is valued at a premium, and when it is negative, it is priced at a discount. Pricing efficiency requires that an ETF’s closing market price equals its NAV on average. Any systematic deviation of the market price from the NAV—whether positive or negative—indicates pricing inefficiency. In order to assess whether a given ETF is priced efficiently, the analysis considered not only the nominal value but also the magnitude of absolute mispricing (following Lin, Chan & Hsu (2006).
After calculating the absolute value of premiums/discounts for each ETF in the sample (based on daily, weekly, and monthly data), these values were averaged (equal-weighted) across funds within each peer-group to obtain the average deviation of market price from NAV and the average volatility of these deviations for each category. Then, monthly average premiums/discounts were calculated for the entire study period in order to document their time-series evolution to see whether the pricing efficiency of ETFs has changed over time.
Although equal-weighted average absolute deviations of ETF closing market prices relative to their NAVs represent the standard approach in research on pricing efficiency, this measure has certain limitations. It makes it possible to assess the extent to which market valuations of funds diverge from their net asset values, but it does not take into account the investors’ perspective—neither their trading activity (measured by the ETF turnover), nor their level of involvement (measured by the ETF AUM). To address this, two alternative average premium/discount values were also calculated, i.e. the turnover-weighted premium/discount average (TWPD) (for the period in which at least two ETFs operated on the market, i.e. from June 2011) and asset(value)-weighted premium/discount (AWPD) average (for the period in which at least two ETFs with AUM data were operating, i.e. from January 2019). The former was computed by weighting each fund by its total market turnover in a given month, and the latter by weighting each fund by its average monthly AUM. Petajisto (2017) calculated it in a slightly different, simplified manner, weighting each fund by its average market capitalization over the research period. These ratios better represent the average inefficiencies faced by investors who trade and hold ETFs in their portfolios.
The analysis of premiums and discounts for ETFs listed on the WSE during the examined period, based on daily observations, reveals several significant patterns (Table 2, Panel A). The vast majority of ETFs trade at a premium relative to NAV, as evidenced by positive values of both the mean and median deviations and by the greater number of trading days with a premium. The highest positive means and medians are recorded for two funds tracking the U.S. market indices, namely Amundi S&P 500 II UCITS ETF and Beta ETF Nasdaq-100 2xshort. Conversely, only one fund, Beta ETF Nasdaq-100 3xlev, exhibits a negative mean (−0.10%) and one of the three negative medians (−0.34%), consistent with its trading at a discount during the majority (57.59%) of sessions. A similar tendency toward discount trading is also observed for the Beta ETF S&P 500 PLN-Hedged and Beta ETF Nasdaq-100 PLN-Hedged.
Descriptive statistics of premium/discount (in nominal and absolute terms) for ETFs listed on WSE (based on daily observations in September 2010–April 2025 period)
| Fund | Mean (%) | Median (%) | Std. dev. (%) | Minimum (%) | Maximum (%) | Range (p.p.) | Skewness | Days with premium (%) | Days with no deviations (%)* | Days with discount (%) |
|---|---|---|---|---|---|---|---|---|---|---|
| Panel A: Premiums/discounts in nominal terms | ||||||||||
| Lyxor WIG20 UCITS ETF | 0.06 | 0.03 | 0.81 | −3.58 | 18.91 | 22.49 | 12.58 | 52.32 | 1.25 | 46.43 |
| Amundi S&P 500 II UCITS ETF EUR Dist | 0.31 | 0.25 | 0.9 | −8.87 | 10.10 | 18.97 | 0.59 | 64.44 | 0.55 | 35.01 |
| Amundi DAX III UCITS ETF Acc | 0.09 | 0.06 | 0.62 | −4.88 | 10.38 | 15.26 | 3.8 | 56.50 | 1.07 | 42.43 |
| Beta ETF WIG20TR PFIZ | 0.06 | 0.00 | 0.47 | −2.53 | 11.87 | 14.40 | 13.89 | 38.27 | 35.75 | 25.98 |
| Beta ETF mWIG40TR PFIZ | 0.04 | 0.00 | 0.28 | −1.46 | 4.45 | 5.90 | 3.87 | 49.33 | 22.97 | 27.70 |
| Beta ETF WIG20short PFIZ | 0.03 | 0.00 | 0.32 | −2.65 | 5.66 | 8.31 | 3.78 | 48.97 | 4.04 | 46.99 |
| Beta ETF WIG20lev PFIZ | 0.08 | 0.00 | 0.63 | −3.82 | 5.54 | 9.36 | 3.48 | 49.35 | 8.60 | 42.06 |
| Beta ETF Nasdaq-100 PLN-Hedged PFIZ | 0.02 | −0.03 | 1.02 | −10.37 | 5.48 | 15.85 | −0.66 | 47.32 | 0.56 | 52.12 |
| Beta ETF S&P 500 PLN-Hedged PFIZ | 0.04 | −0.01 | 0.82 | −8.87 | 5.18 | 14.05 | −0.75 | 48.36 | 1.25 | 50.39 |
| Beta ETF WIGtech PFIZ | 0.05 | 0.04 | 0.43 | −3.10 | 1.40 | 4.50 | −1.00 | 58.24 | 2.00 | 39.75 |
| Beta ETF sWIG80TR PFIZ | 0.09 | 0.02 | 0.38 | −2.29 | 3.03 | 5.32 | 2.09 | 64.27 | 6.13 | 29.60 |
| Beta ETF TBSP PFIZ | 0.08 | 0.08 | 0.20 | −2.28 | 1.19 | 3.48 | −1.86 | 66.83 | 3.87 | 29.30 |
| Beta ETF Obligacji 6M PFIZ | 0.03 | 0.03 | 0.07 | −0.17 | 0.35 | 0.52 | 0.16 | 66.67 | 4.80 | 28.53 |
| Beta ETF Nasdaq-100 3xlev PFIZ | −0.10 | −0.34 | 3.43 | −26.28 | 16.19 | 42.47 | −1.84 | 41.77 | 0.63 | 57.59 |
| Beta ETF Nasdaq-100 2xshort PFIZ | 0.28 | 0.33 | 2.97 | −9.73 | 30.13 | 39.86 | 6.19 | 60.13 | 0.00 | 39.87 |
| Panel B: Premiums/discounts in absolute terms | ||||||||||
| Lyxor WIG20 UCITS ETF | 0.39 | 0.29 | 0.72 | 0.00 | 18.91 | 18.91 | 17.35 | N/A | N/A | N/A |
| Amundi S&P 500 II UCITS ETF EUR Dist | 0.66 | 0.48 | 0.68 | 0.00 | 10.10 | 10.10 | 3.79 | N/A | N/A | N/A |
| Amundi DAX III UCITS ETF Acc | 0.36 | 0.24 | 0.52 | 0.00 | 10.38 | 10.38 | 7.50 | N/A | N/A | N/A |
| Beta ETF WIG20TR PFIZ | 0.14 | 0.04 | 0.45 | 0.00 | 11.87 | 11.87 | 15.58 | N/A | N/A | N/A |
| Beta ETF mWIG40TR PFIZ | 0.14 | 0.06 | 0.24 | 0.00 | 4.45 | 4.45 | 6.56 | N/A | N/A | N/A |
| Beta ETF WIG20short PFIZ | 0.17 | 0.10 | 0.27 | 0.00 | 5.66 | 5.66 | 8.72 | N/A | N/A | N/A |
| Beta ETF WIG20lev PFIZ | 0.32 | 0.16 | 0.54 | 0.00 | 5.54 | 5.54 | 5.30 | N/A | N/A | N/A |
| Beta ETF Nasdaq-100 PLN-Hedged PFIZ | 0.70 | 0.51 | 0.74 | 0.00 | 10.37 | 10.37 | 3.66 | N/A | N/A | N/A |
| Beta ETF S&P 500 PLN-Hedged PFIZ | 0.54 | 0.36 | 0.61 | 0.00 | 8.87 | 8.87 | 4.21 | N/A | N/A | N/A |
| Beta ETF WIGtech PFIZ | 0.30 | 0.23 | 0.30 | 0.00 | 3.10 | 3.10 | 2.36 | N/A | N/A | N/A |
| Beta ETF sWIG80TR PFIZ | 0.22 | 0.12 | 0.33 | 0.00 | 3.03 | 3.03 | 3.91 | N/A | N/A | N/A |
| Beta ETF TBSP PFIZ | 0.15 | 0.12 | 0.15 | 0.00 | 2.28 | 2.28 | 4.39 | N/A | N/A | N/A |
| Beta ETF Obligacji 6M PFIZ | 0.06 | 0.04 | 0.05 | 0.00 | 0.35 | 0.35 | 1.52 | N/A | N/A | N/A |
| Beta ETF Nasdaq-100 3xlev PFIZ | 1.97 | 1.32 | 2.82 | 0.00 | 26.28 | 26.28 | 5.46 | N/A | N/A | N/A |
| Beta ETF Nasdaq-100 2xshort PFIZ | 1.37 | 0.80 | 2.65 | 0.01 | 30.13 | 30.12 | 8.54 | N/A | N/A | N/A |
Note: the deviation of ETF quotes from NAV on these days did not exceed +/− 0.05%
Source: own study
An examination of the listing structure, focusing on the frequency of premium occurrences, identifies a group of funds for which trading at a premium relative to NAV is the prevailing condition, observed in over 60% of sessions. This group includes: Beta ETF sWIG80TR (64.27% of days with a premium), Amundi S&P 500 II UCITS ETF (64.44%), Beta ETF TBSP (66.83%), and Beta ETF Obligacji 6M (66.67%). These funds are further characterized by relatively low volatility of premiums/discounts and a narrow range of fluctuations, suggesting greater pricing stability and the effective operation of potential arbitrage mechanisms. Particularly noteworthy are the fixed-income funds (Beta ETF TBSP and Beta ETF Obligacji 6M), whose statistics (including median values of 0.08% and 0.03%, and premium/discount volatility of 0.20% and 0.07%, respectively), confirm their stability and consistent trading at a small, positive premium. The high and stable proportion of trading sessions at a premium for these ETFs may result from the nature of their underlying indices and specific characteristics of long-term investments in such asset classes. Investors seem willing to accept a persistent, modest overvaluation in exchange for liquidity and convenient access to these exposures. By contrast, the three funds replicating the Nasdaq-100 index exhibit the highest standard deviations of premiums/discounts, with discounts exceeding 10% observed only for these funds.
The trading efficiency of Beta ETF WIG20TR and Beta ETF mWIG40TR is particularly noteworthy, as these funds differ significantly from the others in the frequency of near-zero deviations (not exceeding +/−0.05%) between market price and NAV. For the former, this phenomenon occurs in 35.75% of trading days, and for the latter in 22.97% of trading days, whereas for the other funds the corresponding ratio does not exceed 8.6%. Furthermore, these funds exhibit relatively low volatility and a narrow range of premium/discount fluctuations (with standard deviations of ETF-to-NAV deviations amounting to 0.47% and 0.28%, respectively).
Descriptive statistics of absolute deviations of the market prices from NAVs for each ETF in the research sample are reported in Panel B of Table 2. Mean absolute premiums across all ETFs based on daily observations range from 0.06% (Beta ETF Obligacji 6M) to 1.97% (Beta ETF Nasdaq-100 3xlev). For most funds, the mean absolute premium remains below 0.5%, indicating that they are generally priced efficiently. This finding is corroborated by the median premium/discount values, which are significantly lower than means for all funds. The means are inflated by high extreme values, as evidenced by the skewness of the data. All funds exhibit strong or very strong right-sided skewness, indicating that the premium/discount distribution is highly or very highly asymmetric, with the vast majority of results below the mean. Although outliers (very high premiums or discounts) occur sporadically, their magnitudes are substantial—exceeding 10% or even 20%. Such episodes are relatively common in emerging markets, particularly for funds investing in foreign equities. Overall, the dispersion of results around the average is limited, with the exception of leveraged ETFs linked to the Nasdaq-100 index, for which it reaches notably high levels.
A disaggregation of the data from the entire 15-year research horizon into three five-year subperiods enabled the identification of differences in the behaviour of NAV premiums and discounts relative to market prices (Table 3). While the results for the first two subperiods (Panel A and Panel B)—covering a limited sample of three ETF series—do not point to the presence of material valuation discrepancies, the final subperiod (2020–2025, Panel C) displays a distinctly different pattern. The absolute levels of premiums and discounts were considerably higher, particularly for the series tracking the WIG20 index and for the Amundi fund benchmarked to the S&P index. The standard deviations of premiums and discounts for these three instruments were also several times greater.
Descriptive statistics of absolute premiums/discounts for ETF listed on the WSE across three subperiods (daily data, September 2010–April 2025)
| IMC | Lyxor/Amundi AM | AgioFunds TFI (Beta ETFs) | |||||||||||||
|---|---|---|---|---|---|---|---|---|---|---|---|---|---|---|---|
| Fund | WIG20 | DAX | S&P 500 | WIG20TR | mWIG40TR | WIG20 short | WIG20lev | Nasdaq 100 | S&P 500 | WIG tech | sWIG80TR | TBSP | Obligacji 6M | Nasdaq 100 3xlev | Nasdaq 100 2xshort |
| Panel A: 2010–2014 | |||||||||||||||
| Mean (%) | 0.34 | 0.38 | 0.62 | N/A | N/A | N/A | N/A | N/A | N/A | N/A | N/A | N/A | N/A | N/A | N/A |
| Median (%) | 0.28 | 0.21 | 0.47 | N/A | N/A | N/A | N/A | N/A | N/A | N/A | N/A | N/A | N/A | N/A | N/A |
| Std. dev. (%) | 0.34 | 0.54 | 0.72 | N/A | N/A | N/A | N/A | N/A | N/A | N/A | N/A | N/A | N/A | N/A | N/A |
| Minimum (%) | 0.00 | 0.00 | 0.00 | N/A | N/A | N/A | N/A | N/A | N/A | N/A | N/A | N/A | N/A | N/A | N/A |
| Maximum (%) | 3.73 | 7.34 | 10.10 | N/A | N/A | N/A | N/A | N/A | N/A | N/A | N/A | N/A | N/A | N/A | N/A |
| Range (p.p.) | 3.73 | 7.34 | 10.10 | N/A | N/A | N/A | N/A | N/A | N/A | N/A | N/A | N/A | N/A | N/A | N/A |
| Skewness | 4.20 | 5.42 | 5.83 | N/A | N/A | N/A | N/A | N/A | N/A | N/A | N/A | N/A | N/A | N/A | N/A |
| Panel B: 2015–2019 | |||||||||||||||
| Mean (%) | 0.36 | 0.33 | 0.50 | 0.03 | 0.15 | 0.22 | N/A | N/A | N/A | N/A | N/A | N/A | N/A | N/A | N/A |
| Median (%) | 0.28 | 0.26 | 0.37 | 0.00 | 0.09 | 0.12 | N/A | N/A | N/A | N/A | N/A | N/A | N/A | N/A | N/A |
| Std. dev. (%) | 0.40 | 0.33 | 0.46 | 0.10 | 0.19 | 0.24 | N/A | N/A | N/A | N/A | N/A | N/A | N/A | N/A | N/A |
| Minimum (%) | 0.00 | 0.00 | 0.00 | 0.00 | 0.00 | 0.01 | N/A | N/A | N/A | N/A | N/A | N/A | N/A | N/A | N/A |
| Maximum (%) | 6.26 | 3.96 | 4.45 | 0.93 | 0.96 | 0.83 | N/A | N/A | N/A | N/A | N/A | N/A | N/A | N/A | N/A |
| Range (p.p.) | 6.26 | 3.96 | 4.45 | 0.93 | 0.96 | 0.83 | N/A | N/A | N/A | N/A | N/A | N/A | N/A | N/A | N/A |
| Skewness | 6.21 | 3.48 | 2.44 | 5.66 | 2.25 | 1.26 | N/A | N/A | N/A | N/A | N/A | N/A | N/A | N/A | N/A |
| Panel C: 2020–2025 | |||||||||||||||
| Mean (%) | 0.62 | 0.31 | 0.68 | 0.16 | 0.14 | 0.17 | 0.32 | 0.70 | 0.54 | 0.30 | 0.22 | 0.15 | 0.06 | 1.97 | 1.37 |
| Median (%) | 0.37 | 0.21 | 0.40 | 0.06 | 0.06 | 0.10 | 0.16 | 0.51 | 0.36 | 0.23 | 0.12 | 0.12 | 0.04 | 1.32 | 0.80 |
| Std. dev. (%) | 1.75 | 0.35 | 0.84 | 0.49 | 0.25 | 0.28 | 0.54 | 0.74 | 0.61 | 0.30 | 0.33 | 0.15 | 0.05 | 2.82 | 2.65 |
| Minimum (%) | 0.00 | 0.00 | 0.00 | 0.00 | 0.00 | 0.00 | 0.00 | 0.00 | 0.00 | 0.00 | 0.00 | 0.00 | 0.00 | 0.00 | 0.01 |
| Maximum (%) | 18.91 | 2.60 | 8.87 | 11.87 | 4.45 | 5.66 | 5.54 | 10.37 | 8.87 | 3.10 | 3.03 | 2.28 | 0.35 | 26.28 | 30.13 |
| Range (p.p.) | 18.91 | 2.60 | 8.87 | 11.87 | 4.45 | 5.66 | 5.54 | 10.37 | 8.87 | 3.10 | 3.03 | 2.28 | 0.35 | 26.28 | 30.12 |
| Skewness | 8.83 | 2.99 | 4.16 | 14.60 | 6.66 | 8.80 | 5.30 | 3.66 | 4.21 | 2.36 | 3.91 | 4.39 | 1.52 | 5.46 | 8.54 |
Source: own study
A further breakdown of this subperiod into consecutive one-year intervals reveals that these elevated discrepancies were primarily driven by the pandemic year (2020)—similarly to the Malhorta & Sinha (2023) study, and to a lesser extent by developments in 2022 (the outbreak of the war in Ukraine) and 2025 (the tariff measures introduced by President Trump). These findings provide strong evidence of an association between inflated NAV premiums and discounts and heightened market volatility during periods of pronounced financial turbulence.
Average absolute deviations of ETF market prices from their NAVs within investment categories, using daily data, are highly diversified (Table 4). The largest deviations occur in leveraged equity funds (E-L ETFs). These funds also show the greatest volatility in premiums or discounts. This indicates not only that their market prices are frequently misaligned with NAVs, but also that they fluctuate considerably around them. Significantly smaller average deviation is recorded for non-leveraged Polish equity funds replicating WSE indices (PE-NL ETFs). By comparison, non-leveraged foreign equity funds (FE-NL ETFs) exhibit much larger average absolute premiums and discounts. Fixed income funds tracking indices of Polish government bonds are definitely the most efficiently priced, with both mean and median deviations being the lowest among the research sample and volatility of premiums/discounts negligible. Across all funds categories, the distribution of absolute premiums and discounts is strongly right-skewed, indicating that deviation of ETFs market prices from NAV is much more often lower than the average level.
Descriptive statistics of average absolute premium/discount within investment categories (based on daily observations in September 2010–April 2025 period)
| Investment category of ETFs | Mean (%) | Median (%) | Std. dev. (%) | Minimum (%) | Maximum (%) | Range (p.p.) | Skewness |
|---|---|---|---|---|---|---|---|
| Polish equity—non-leveraged | 0.23 | 0.14 | 0.39 | 0.00 | 7.84 | 7.84 | 9.08 |
| Foreign equity—non-leveraged | 0.57 | 0.40 | 0.64 | 0.00 | 9.93 | 9.93 | 4.79 |
| Equity—leveraged | 1.22 | 0.76 | 2.00 | 0.01 | 20.65 | 20.64 | 6.43 |
| Fixed income—Polish government bonds | 0.10 | 0.08 | 0.10 | 0.00 | 1.32 | 1.32 | 2.96 |
Source: own study
To ensure robustness, we re-examined the results using alternative data intervals—weekly and monthly—in order to validate the findings derived from daily data, and to mitigate potential microstructure issues. The outcomes based on weekly observations closely mirror those obtained from the daily data presented in Table 4. The values of the mean, median, and standard deviation for all categories are almost identical, whereas the minimum and maximum values are slightly lower. Furthermore, the distributions of premiums/discounts, while still exhibiting pronounced right skewness, display a somewhat reduced degree of asymmetry. When analysed at the monthly frequency, the results remain broadly consistent with those obtained based on daily and weekly intervals. The mean and median values of deviations are slightly higher in certain categories—particularly in non-leveraged foreign equity ETFs and leveraged equity ETFs—while they are marginally lower in fixed income ETFs. The asymmetry of the deviation distributions is reduced, yet they continue to exhibit a pronounced positive skew. The volatility of premiums/discounts is comparable to that observed in shorter intervals. To sum up, across all observation frequencies, the study points to a generally high degree of pricing efficiency for the ETFs examined. The highest efficiency is observed in funds tracking Polish government bond indices, while the lowest is in leveraged equity funds.
An examination of the absolute mean deviations of ETF prices from their NAVs over the research period reveals that, for the most part, they remained within the range of 0.2% to 0.7% (Figure 2). Substantially higher levels were observed only on three occasions, each coinciding with episodes of heightened volatility in international and domestic equity markets: in the autumn of 2011, following the downgrade of the U.S. sovereign credit rating by Standard & Poor’s and in the face of the growing sovereign debt crisis in Europe; in March 2020 after the outbreak of the Covid-19 pandemic; and in April 2025 following the introduction of new U.S. tariff policies by President Donald Trump. In the last two episodes, the average premium/discount exceeded 1%, although this mispricing proved relatively short-lived. In contrast, in 2011, the inefficiency of ETFs’ valuations, although not as elevated, persisted for a longer period (from August to November). Conversely, the average premium/discount occasionally fell below 0.2% - notably at the end of 2010, coinciding with the initial listing of Lyxor ETF WIG20 on the WSE, and in the autumn of 2019, reflecting the high pricing efficiency of the Beta ETF WIG20TR.
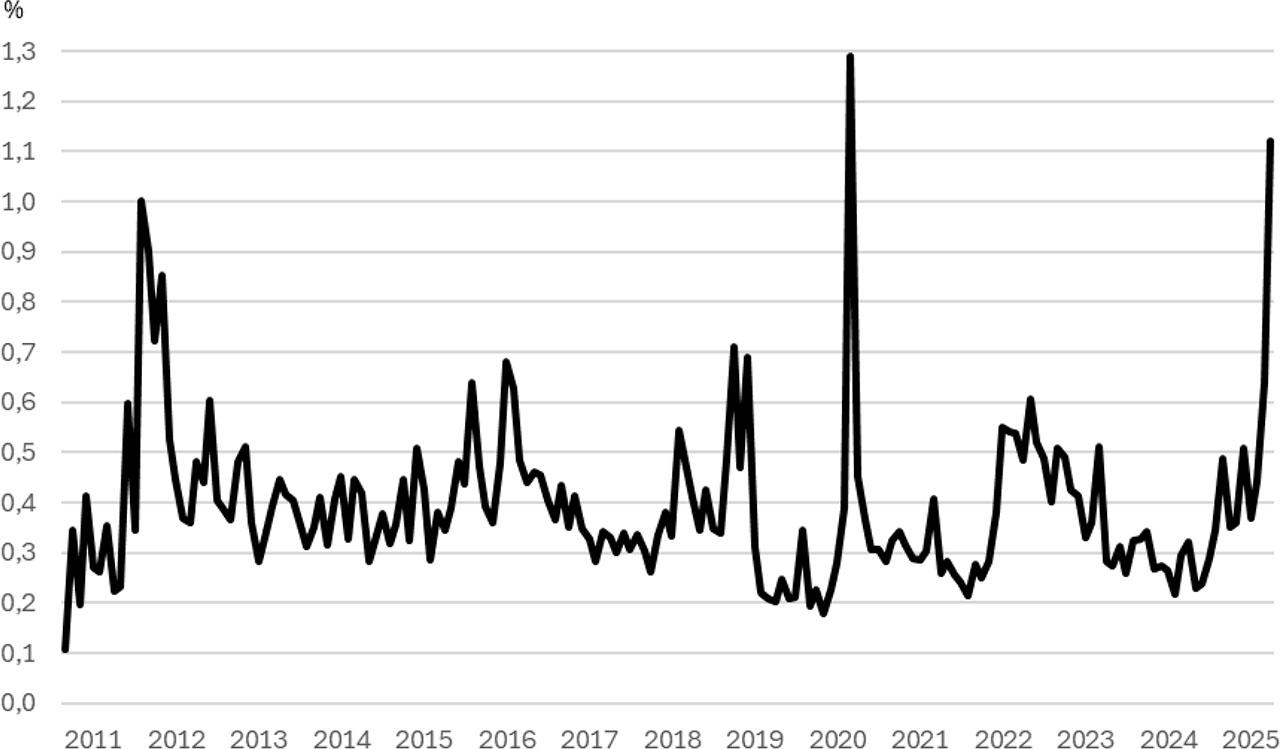
Average equal-weighted absolute premium/discounts for ETFs in research sample (September 2010–April 2025)
Source: own study
These findings are broadly consistent with the outcomes of prior studies of ETFs listed on domestic stock exchanges in emerging markets (Lin, Chan & Hsu, 2006; Kayali, 2007; Charteris, 2013 and 2014). A greater prevalence of ETFs trading at a premium has likewise been identified in comprehensive studies of developed markets (e.g., Hilliard, 2014; Petajisto, 2017). Moreover, the literature documents significantly elevated premiums and discounts during periods of market turbulence (Hughen, 2003; Ben-David et al., 2017; Al-Nassar, 2021).
By contrast, direct comparison with the only empirical study of the Polish market (Mitrenga, 2013), is not warranted, as that analysis was limited to a single ETF over a relatively short horizon of slightly more than two years.
A comparison of equal-weighted and asset-weighted average premiums and discounts indicates that the latter were slightly lower than the former for most of the sample period (75%) (Figure 3). An exception was observed at the beginning of this period (2019 and the first half of 2020) when asset-weighted averages exceeded the equal-weighted ones. This pattern was driven by the Lyxor WIG20 UCITS ETF, which exhibited higher premiums/discounts than other funds while simultaneously accounting for a relatively large share of assets compared with the Beta ETFs. In subsequent years, the relationship reversed, as the largest ETFs—Beta ETF WIG20TR and Beta ETF mWIG40TR—displayed lower premiums and discounts relative to their peers. The average difference between asset- and equal-weighted premiums/discounts was (-7 bps), with the largest differences occurring during periods of increased market volatility. The largest negative difference (-75 bps) was observed in April 2025, driven by relatively small premiums/discounts in the largest ETFs replicating the performance of WIG20TR and mWIG40TR indices, alongside large premiums/discounts in smaller funds, especially leveraged ones linked to the Nasdaq-100 index (over 3 p.p.). Conversely, the largest positive difference (+69 bps) was recorded in March 2020, attributable to the substantial average discount of the Lyxor WIG20 UCITS ETF (3.3 p.p.), which at that time was the dominant fund in terms of NAV.

Average equal-weighted and asset-weighted absolute premium/discounts for 13 ETFs* in research sample (January 2019-April 2025**)
* - all ETFs in research sample with exception of two Lyxor/Amundi funds (AUM data not available)
** - period in which data on AUM of at least two ETFs was available
Source: own study
The situation differed slightly when turnover-weighted averages were considered. As presented in Figure 4, the differences between turnover- and equal-weighted premiums and discounts were modest, averaging (-4 bps). Negative discrepancies persisted for most of the research period (74%). Consistent with the turnover-weighted analysis of the extreme values emerged in conditions of market turbulence. The largest negative difference (-36 bps) occurred in September 2011, when the highest turnover was recorded in the Lyxor ETF WIG20, whose pricing was substantially more efficient than that of funds tracking the S&P 500 and DAX indices. By contrast, in April 2025 the turnover-weighted averages exceeded the equal-weighted measures by 15 bps as the funds with the largest market price deviations from NAV—particularly—leveraged ETFs on the Nasdaq-100 index—were also among those most actively traded on the WSE.

Average equal-weighted and turnover-weighted absolute premium/discounts for all ETFs in research sample (May 2011–April 2025*)
* - period in which at least two ETFs were listed on WSE
Source: own study
Findings concerning asset-weighted premiums/discounts are in line with research carried out by Petajisto (2017). He showed that value-weighted premiums/discounts for US-listed ETFs were slightly smaller than equal-weighted.
This article examined the pricing efficiency of 15 exchange-traded funds listed on the WSE during the period 2010–2025. This study reflects the growing importance of ETFs not only in developed markets but also in emerging ones, including Poland. Yet, the issue of valuation efficiency has received relatively little attention in the context of emerging markets, and where it has been addressed, the focus has often been on funds providing exposure to emerging markets but traded on stock exchanges in developed countries, mainly the NYSE. By analysing the entire population of ETFs listed on the WSE over the past 15 years—including equity and fixed-income funds, domestic and international exposures, and both unleveraged and leveraged products—this study contributes to filling the gap in the literature on emerging market ETFs.
The results indicate that the deviations of ETF market prices from their respective NAVs are generally modest and comparable to those observed in other emerging markets. Substantially elevated daily premiums/discounts (exceeding 1%) are relatively rare and particularly prevalent in leveraged and inverse leveraged funds; while relatively large deviations are also recorded in ETFs with exposure to foreign equity markets. Fixed income ETFs that track Polish Treasury indices are the most effectively priced. Comparable discrepancies across investment categories are also evident in the volatility of premiums and discounts. This dimension is particularly relevant, as the standard deviation of premiums/discounts can at times provide a more accurate measure of indirect trading costs than their averages. Indeed, some active investors may prefer a larger but relatively stable premium or discount to a smaller yet more volatile one, since the former entails lower round-trip transaction costs in the form of brokers’ commissions.
Our study also confirmed the positive relationship between the size of equity ETF premiums/discounts and stock market volatility (especially during market downturns)—e.g. in 2011 after the downgrade of the U.S. sovereign credit rating by Standard & Poor’s, in 2020 following the outbreak of the pandemic Covid-19, and in 2025 as a result of the introduction of new U.S. tariff policies by President Donald Trump. ETFs listed on the WSE, similar to their counterparts traded on exchanges in other emerging and developed countries, adjust rapidly to shifts in market sentiment.
The standard approach to examine ETF pricing efficiency across the market—based on equal-weighted average deviations of their market prices relative to NAVs—was extended by incorporating two additional measures, rarely used in the literature, that better capture the investor perspective and more accurately reflect the average costs borne by fund participants. This was achieved by computing asset-weighted and turnover-weighted absolute deviations of ETF market prices from the NAV of their underlying securities. It turned out that, since the beginning of 2021, the asset-weighted average premium or discount has been lower than the equal-weighted measure. This implies that the costs borne by investors holding ETFs—given that premiums/discounts constitute one component of the total cost of ownership—are generally lower than those assessed by non-weighted estimates. Similar patterns emerge when turnover-weighted premiums/discounts are considered, although the average differences relative to equal-weighted measures were generally slightly lower. This conclusion is particularly relevant for the most active investors, who trade ETFs frequently, as premiums and discounts constitute additional implicit costs of trading, incurred alongside explicit costs such as trading commission and bid-ask spreads.
A main limitation of this study is the absence of analysis of the determinants of premiums/discounts on the WSE. This omission is deliberate, as such research requires separate, more elaborate, and in-depth investigation to be carried out in the future. The same applies to the examination of the persistence of deviations of the ETF market prices and their NAVs. Other limitations include the lack of an analysis of intraday premiums/discounts, since measures based solely on end-of-day market prices represent only a closing snapshot and may not accurately depict how precisely ETFs tracked their NAVs during the whole trading session. Such detailed research could potentially alter some of the results and conclusions; however, such examination is currently not feasible for the Polish market due to the lack of intraday net asset value (iNAV) data. The absence of mid-quote prices at market close likewise precludes research based on this metric, although it is often used in developed markets where such data are typically available. Finally, extending the analysis to other emerging markets in the CEE or Southeastern Europe emerging markets could further enhance the representativeness of the results.