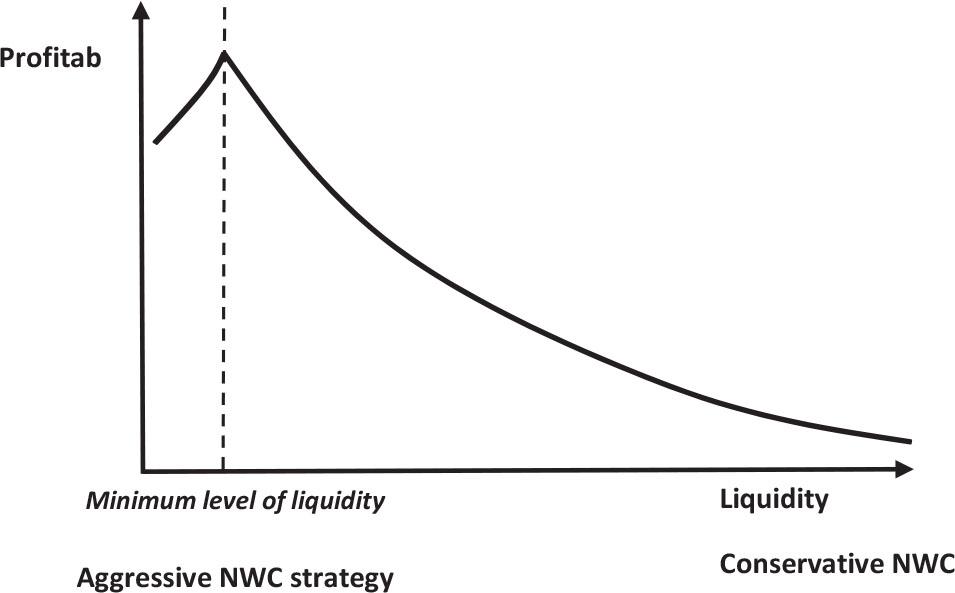
Figure 1.

Correlation matrix for portfolios based on asset levels
| Assets < average | CR | CCC |
|---|---|---|
| ROE | 0.1195 *** | −0.0754 *** |
| ROA | 0.2406 *** | −0.0452 *** |
OLS model for lower-than-average sales and liquidity influencing profitability
| Sales < average | |||||||
|---|---|---|---|---|---|---|---|
| Endogenous | Constant | CCC | lnA | Adj. R2 | F-stat | N | Heteroskedasticity-corrected |
| ROE | −0.0519 | −0.00005 *** | 0.0084 | 0.9799 | 33383.3 *** | 1365 | Yes |
| ROA | −0.1053 ** | −0.000001 *** | 0.0113 *** | 0.8613 | 4418.782 *** | 1423 | Yes |
Correlation matrix for portfolios based on sales levels
| Sales < average | CR | CCC |
|---|---|---|
| ROE | 0.1386 *** | −0.0748 *** |
| ROA | 0.2513 *** | −0.0514 *** |
Correlation matrix for portfolios based on NWC management
| Aggressive strategy of NWC | CR | CCC |
|---|---|---|
| ROE | 0.2163 *** | −0.2396 *** |
| ROA | 0.3319 *** | −0.2152 *** |
| Moderate strategy of NWC | CR | CCC |
| ROE | 0.0196 | −0.1873 *** |
| ROA | 0.1107 *** | −0.1396 *** |
| Conservative strategy of NWC | CR | CCC |
| ROE | −0.1722 *** | −0.1351 *** |
| ROA | −0.1248 *** | −0.1661 *** |
OLS model for moderate strategy and liquidity influencing profitability
| Moderate strategy CR <1;2> | |||||||
|---|---|---|---|---|---|---|---|
| Endogenous | Constant | CCC | lnA | Adj. R2 | F-stat | N | Heteroskedasticity-corrected |
| ROE | 0.0151 | −0. 000002 *** | 0.0049 | 0.2222 | 90.8459 *** | 630 | Yes |
| ROA | 0.0290 | −0.00001 *** | 0.0010 | 0.0755 | 26.8555 *** | 634 | Yes |
OLS model for higher-than-average levels of assets and liquidity's influence on profitability
| Assets > average | |||||||
|---|---|---|---|---|---|---|---|
| Endogenous | Constant | CCC | lnS | Adj. R2 | F-stat | N | Heteroskedasticity-corrected |
| ROE | 0.1112 | 0.0002 | 0.0003 | 0.0112 | 0.6802 | ||
| ROA | 0.1006 * | 0.00002 | −0.0040 | 0.0115 | 0.6993 | 123 | Yes |
Data statistics based on the sales and asset levels
| Sales < average | Sales > average | Assets < average | Assets > average | |
|---|---|---|---|---|
| No observations | 1467 | 203 | 1612 | 124 |
| S | 172,490 | 8,661,400 | 289,860 | 12,608,600 |
| A | 360,058 | 22,677,400 | 338,439 | 37,107,500 |
| ROE | 0.0324 | 0.1283 | 0.0320 | 0.1266 |
| ROA | −0.0046 | 0.0375 | −0.0076 | 0.0474 |
| CR | 8.5807 | 1.2657 | 8.1184 | 1.3483 |
| CCC | 55.0209 | 21.6628 | 50.6639 | 35.7730 |
OLS model for lower-than-average asset levels and liquidity's influence on profitability
| Assets < average | |||||||
|---|---|---|---|---|---|---|---|
| Endogenous | Constant | CCC | lnS | Adj. R2 | F-stat | N | Heteroskedasticity-corrected |
| ROE | −0.2268 *** | 0.00004 *** | 0.0252 *** | 0.5769 | 984.2930 *** | 1443 | Yes |
| ROA | −0.0968 *** | −0.000007 *** | 0.0114 *** | 0.0967 | 81.3111 *** | 1501 | Yes |
OLS model for aggressive strategy and liquidity influencing profitability
| Aggressive strategy CR<1 | |||||||
|---|---|---|---|---|---|---|---|
| Endogenous | Constant | CCC | lnA | Adj. R2 | F-stat | N | Heteroskedasticity-corrected |
| ROE | −0.6374 *** | −0.00004 *** | 0.0487 *** | 0.0799 | 19.3458 *** | 423 | No |
| ROA | −0.3433 *** | −0.00004 *** | 0.0249 *** | 0.7777 | 819.7838 *** | 469 | Yes |
The construction of portfolios based on determinants
| Factor | Range |
|---|---|
| Aggressive net working capital strategy | CR<1 |
| Moderate net working capital strategy | CR <1;2> |
| Conservative net working capital strategy | CR>2 |
| High level of sales | S > 1,204,375 (average value for a whole sample) |
| Low level of sales | S < 1,204,375 (average value for a whole sample) |
| High level of assets | A > 2,964,799 (average value for a whole sample) |
| Low level of assets | A < 2,964,799 (average value for a whole sample) |
OLS model for conservative NWC strategy and liquidity influencing profitability
| Conservative strategy CR>2 | |||||||
|---|---|---|---|---|---|---|---|
| Endogenous | Constant | CCC | lnA | Adj. R2 | F-stat | N | Heteroskedasticity-corrected |
| ROE | 0.0084 | 0.000001 | 0.0076 | 0.0021 | 1.5601 | 513 | Yes |
| ROA | 0.1753 *** | 0.000003 *** | −0.0079 ** | 0.0421 | 12.4182 *** | 520 | Yes |
Mean values for portfolios related to net working capital strategies
| Aggressive strategy | Moderate strategy | Conservative strategy | |
|---|---|---|---|
| No observations | 509 | 650 | 573 |
| S | 1,845,840 | 1,468,680 | 340,971 |
| A | 7,131,500 | 15,457,106 | 893,946 |
| ROE | −0.0303 | 0.057 | 0.0749 |
| ROA | −0.1097 | 0.0282183 | 0.0577 |
| CR | 0.5874 | 1.41579 | 20.9465 |
| CCC | 7.2225 | 447.072 | 2315.95 |
OLS model for higher-than-average sales levels and liquidity that influences profitability
| Sales > average | |||||||
|---|---|---|---|---|---|---|---|
| Endogenous | Constant | CCC | lnA | Adj. R2 | F-stat | N | Heteroskedasticity-corrected |
| ROE | 0.4132 | −0.0004 | −0.0181 | 0.0081 | 1.8168 | 201 | No |
| ROA | 0.0620 | 0.00006 | −0.0016 | 0.0059 | 0.5885 | 201 | No |
