

Table 1.
The summary of the results of the MDH tests
| Interval | 1 minute | 5 minutes | 30 minutes | All intervals | |||||||
|---|---|---|---|---|---|---|---|---|---|---|---|
| Cryptocurrency | Windows tested | Efficient windows | Efficiency change rate | Windows tested | Efficient windows | Efficiency change rate | Windows tested | Efficient windows | Efficiency change rate | Efficient windows | Efficiency change rate |
| Polygon | 709 | 97% | 2% | 97% | 2% | ||||||
| Avalanche | 571 | 90% | 7% | 697 | 94% | 3% | 709 | 95% | 2% | 94% | 4% |
| Chainlink | 571 | 83% | 8% | 697 | 96% | 4% | 709 | 90% | 5% | 90% | 6% |
| Bitcoin Cash | 571 | 83% | 8% | 697 | 91% | 5% | 709 | 95% | 3% | 90% | 5% |
| Solana | 571 | 72% | 12% | 697 | 95% | 3% | 709 | 97% | 3% | 89% | 6% |
| Cardano | 571 | 74% | 9% | 697 | 93% | 5% | 709 | 96% | 3% | 89% | 5% |
| BNB | 571 | 87% | 8% | 697 | 87% | 6% | 709 | 83% | 5% | 85% | 6% |
| Shiba Inu | 571 | 83% | 9% | 684 | 92% | 5% | 686 | 75% | 7% | 83% | 7% |
| Polkadot | 51 | 96% | 4% | 687 | 82% | 7% | 83% | 7% | |||
| NEAR Protocol | 571 | 53% | 8% | 684 | 93% | 4% | 700 | 90% | 6% | 80% | 6% |
| Ethereum | 571 | 44% | 7% | 697 | 93% | 5% | 709 | 95% | 2% | 80% | 5% |
| Bitcoin | 571 | 39% | 9% | 697 | 89% | 5% | 709 | 99% | 1% | 78% | 5% |
| XRP | 571 | 23% | 4% | 685 | 82% | 6% | 709 | 91% | 5% | 68% | 5% |
| TRON | 41 | 63% | 16% | 709 | 30% | 7% | 32% | 8% | |||
| Toncoin | 406 | 31% | 9% | 160 | 15% | 3% | 25 | 22% | 15% | 26% | 8% |
| Dogecoin | 380 | 3% | 2% | 697 | 24% | 5% | 709 | 24% | 3% | 20% | 3% |
| Average | 544 | 59% | 8% | 572 | 80% | 5% | 663 | 79% | 5% | 74% | 5% |
[i] Note: The column ‘Windows tested’ refers to a number of windows for which the MDH tests were performed using the rolling window method. The column ‘Efficient windows’ indicates a part of windows for which the MDH tests indicated weak-form efficiency. The column ‘Efficiency change rate’ informs about a part of windows in which the MDH tests changed their indication from efficiency to inefficiency and from inefficiency to efficiency.
Table 2.
Correlation coefficients for the percentage of efficient windows and the efficiency change rate
| Test/result | Coefficient | p-value | ||
|---|---|---|---|---|
| Interval | Spearman | Kendall | Spearman | Kendall |
| 1 min | 0.17 | 0.10 | 0.59 | 0.62 |
| 5 min | −0.58 | −0.52 | 0.02 | 0.01 |
| 30 min | −0.84 | −0.72 | 0.00 | 0.00 |
[i] Note: Spearman’s rho and Kendall’s tau correlation coefficients, as well as their p-values, computed for the percentage of efficient windows and the efficiency change rate from Table 1 are presented for each interval.
Table 3.
Correlation coefficients for the ranks of cryptocurrencies
| Test/result | Coefficient | p-value | ||||||
|---|---|---|---|---|---|---|---|---|
| Spearman | Interval | 1 min | 5 min | 30 min | Interval | 1 min | 5 min | 30 min |
| 1 min | 1.00 | 1 min | 1.00 | |||||
| 5 min | 0.21 | 1.00 | 5 min | 0.49 | 1.00 | |||
| 30 min | −0.79 | −0.04 | 1.00 | 30 min | 0.00 | 0.88 | 1.00 | |
| Kendall | Interval | 1 min | 5 min | 30 min | Interval | 1 min | 5 min | 30 min |
| 1 min | 1.00 | 1 min | 1.00 | |||||
| 5 min | 0.10 | 1.00 | 5 min | 0.68 | 1.00 | |||
| 30 min | −0.59 | 0.03 | 1.00 | 30 min | 0.00 | 0.92 | 1.00 | |
[i] Note: Spearman’s rho and Kendall’s tau correlation coefficients calculated for the ranks of cryptocurrencies in terms of the percentage of efficient windows in different intervals.
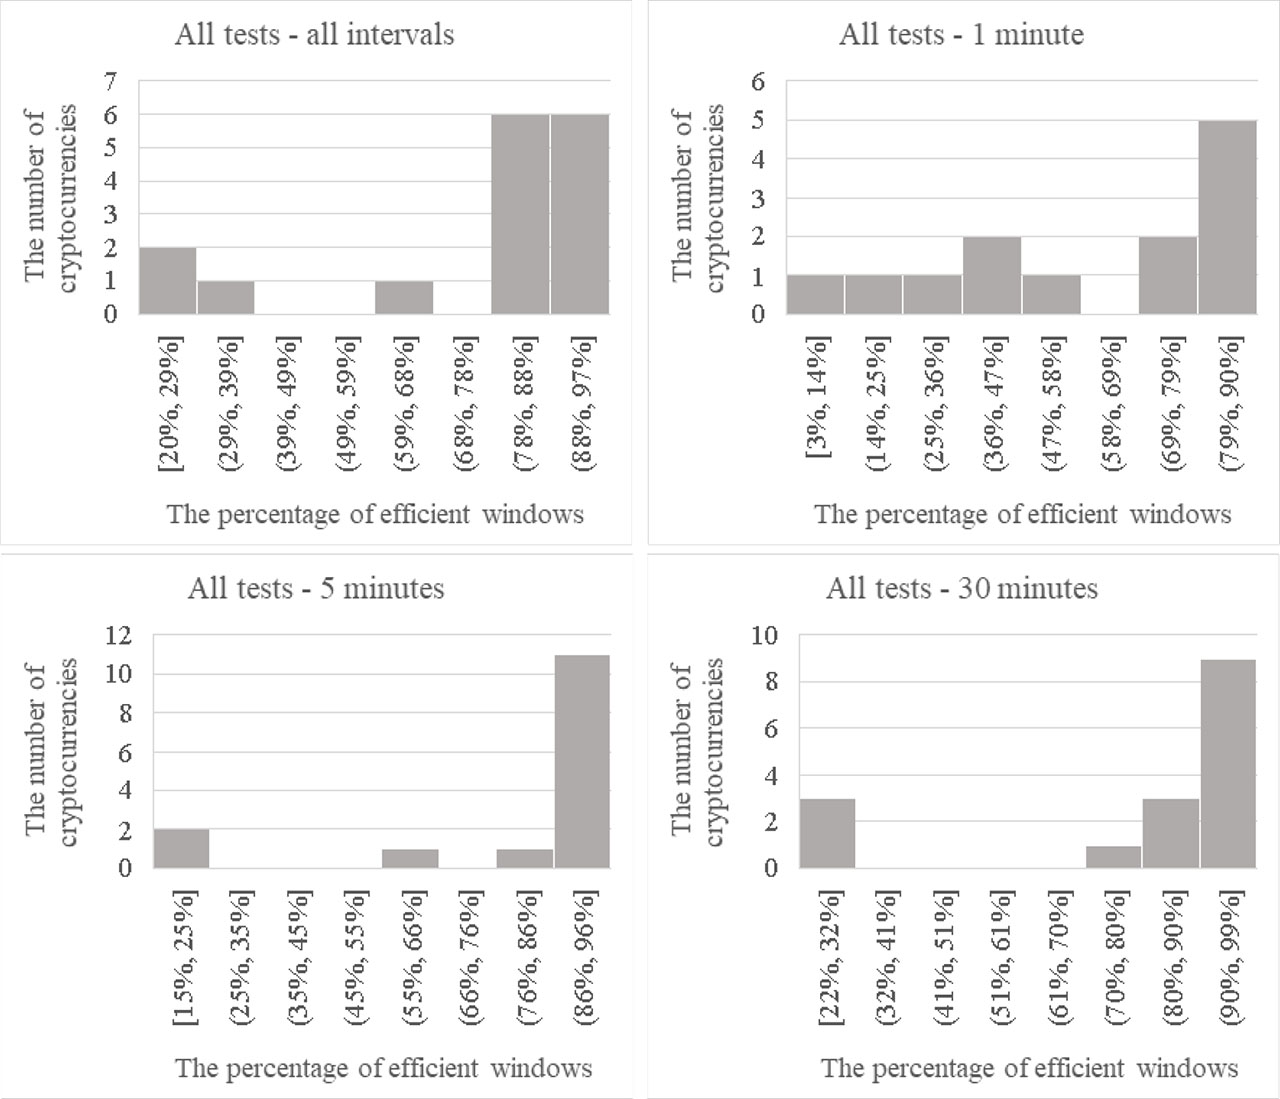
Figure 1.
The histograms of the percentage of efficient windows
Note: The headers of distributions refer to the intervals considered.
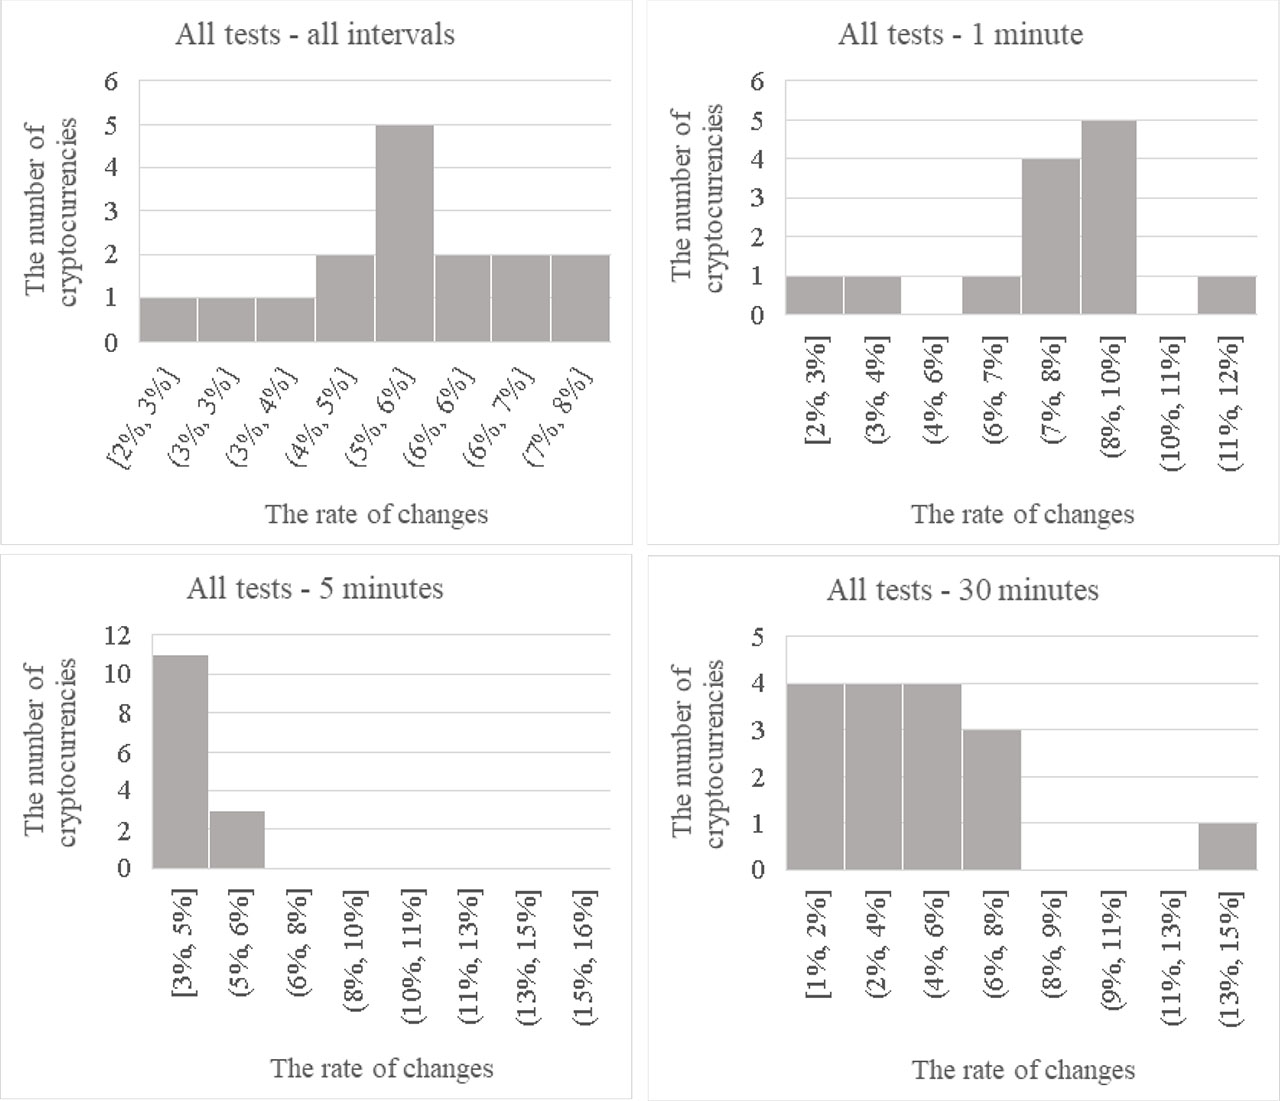
Figure 2.
The histograms of the rate of changes
Note: The headers of distributions refer to the intervals considered.
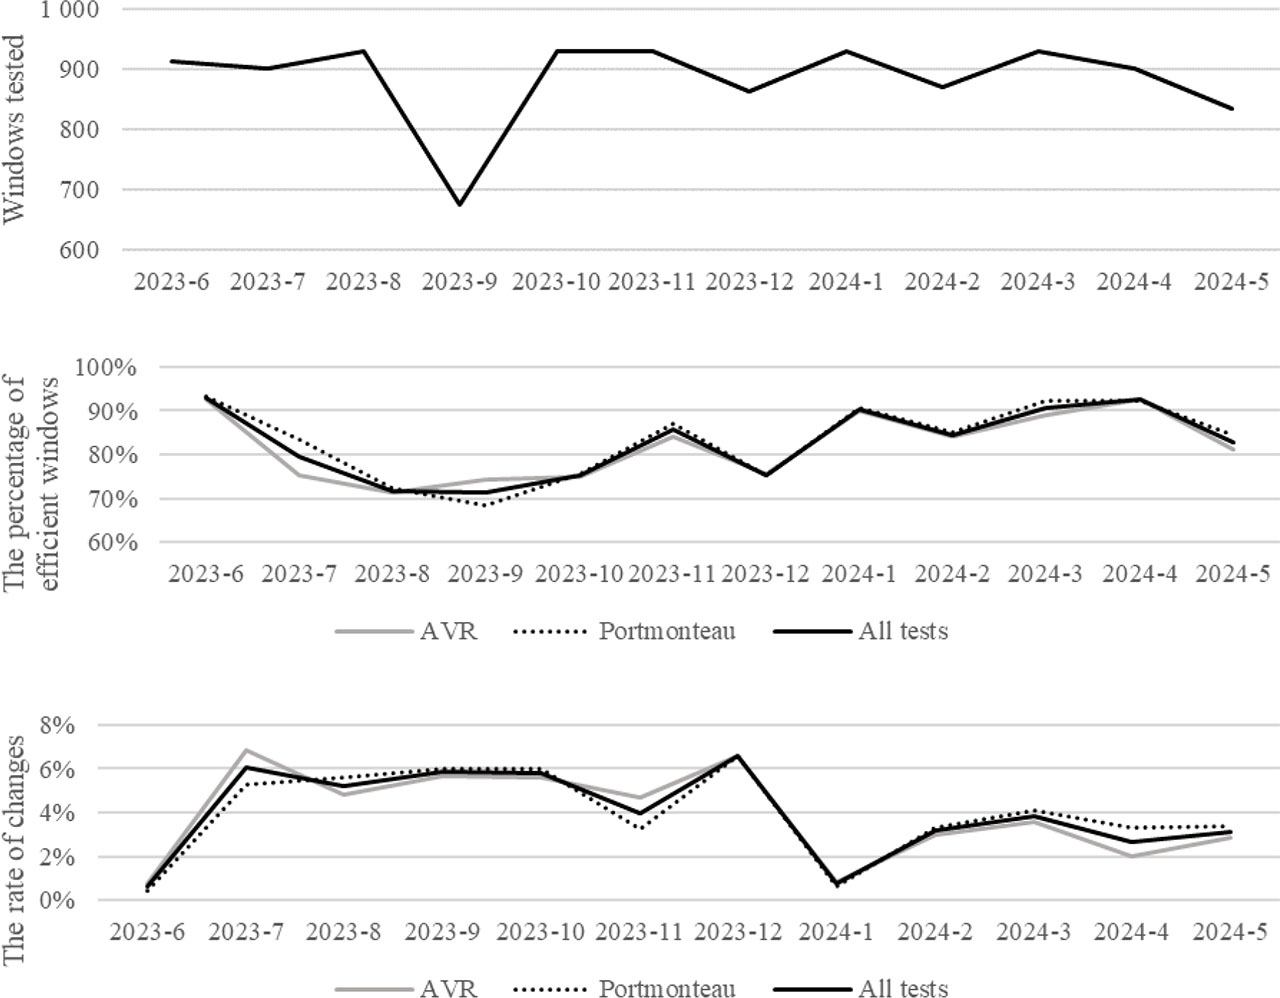
Figure 3.
The results of the MDH tests over consecutive months for a 30-minute interval
Note: ‘Portmonteau’ stands for the automatic Portmanteau test for serial correlation proposed by Escanciano and Lobato (2009). ‘AVR’ is an abbreviation for the wild bootstrapped automatic variance ratio test under conditional heteroskedasticity proposed by Kim (2009). ‘All tests’ refers to both tests together.
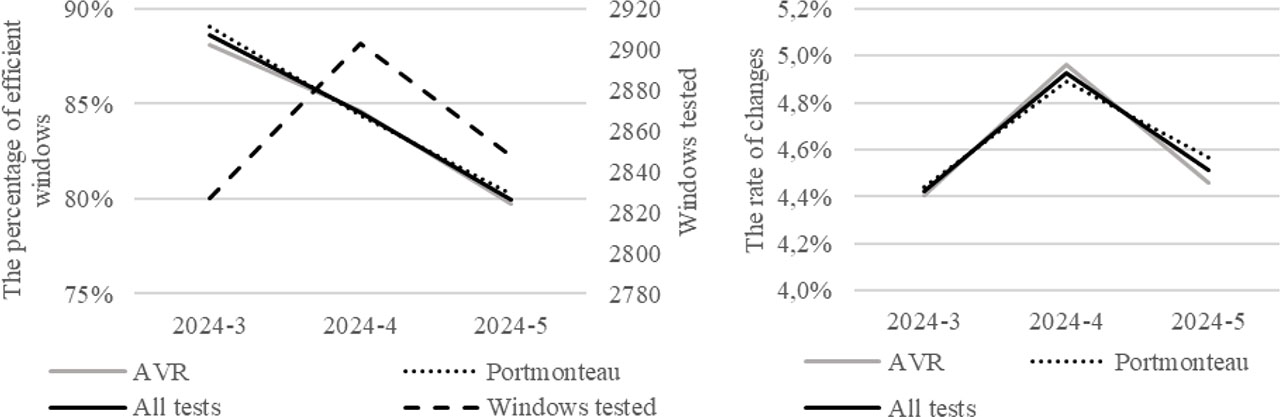
Figure 4.
The results of the MDH tests over consecutive months for a 5-minute interval
Note: ‘Portmonteau’ stands for the automatic Portmanteau test for serial correlation proposed by Escanciano and Lobato (2009). ‘AVR’ is an abbreviation for the wild bootstrapped automatic variance ratio test under conditional heteroskedasticity proposed by Kim (2009). ‘All tests’ refers to both tests together.
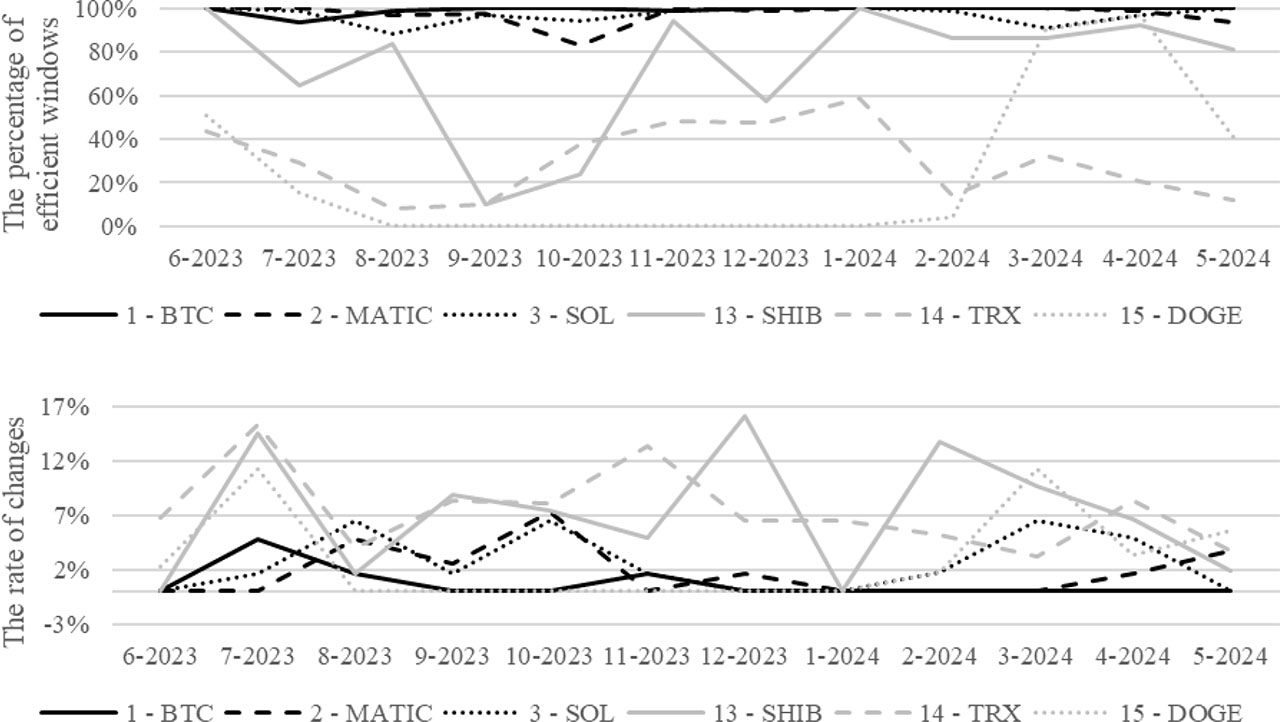
Figure 5.
The results of the MDH tests for the three most efficient and three least efficient cryptocurrencies over consecutive months for a 30-minute interval
Note: The numbers refer to the ranking of efficiency based on the results presented in Table 1. Codes refer to cryptocurrencies in the efficiency ranking: Bitcoin (BTC), Polygon (MATIC), Solana (SOL), Shiba Inu (SHIB), TRON (TRX), and Dogecoin (DOGE).
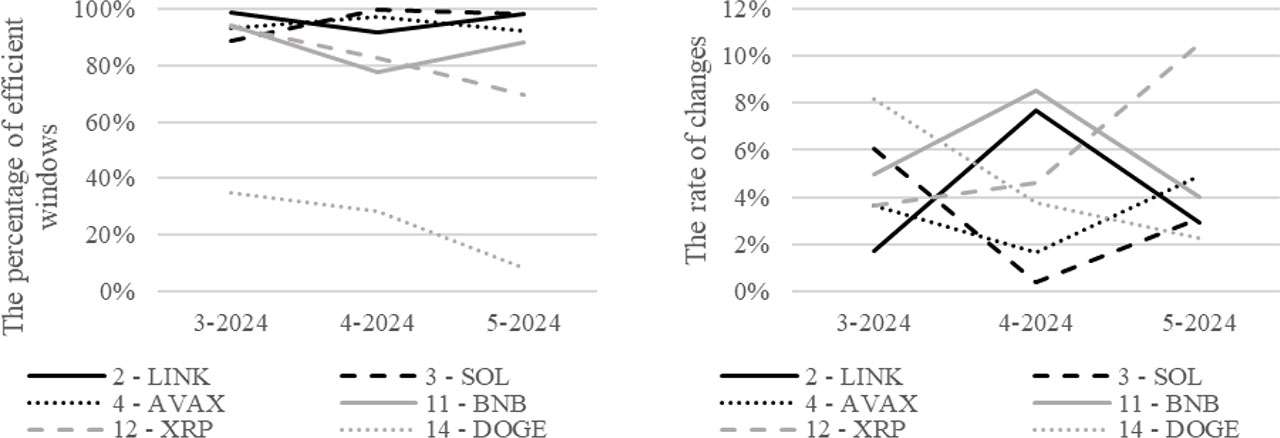
Figure 6.
The results of the MDH tests for three most efficient and three least efficient cryptocurrencies over consecutive months for a 5-minute interval
Note: The numbers refer to the ranking of efficiency based on the results presented in Table 1. Codes refer to cryptocurrencies in the efficiency ranking: Chainlink (LINK), Solana (SOL), Avalanche (AVAX), BNB (BNB), XRP (XRP), and Dogecoin (DOGE).