

Figure 1.
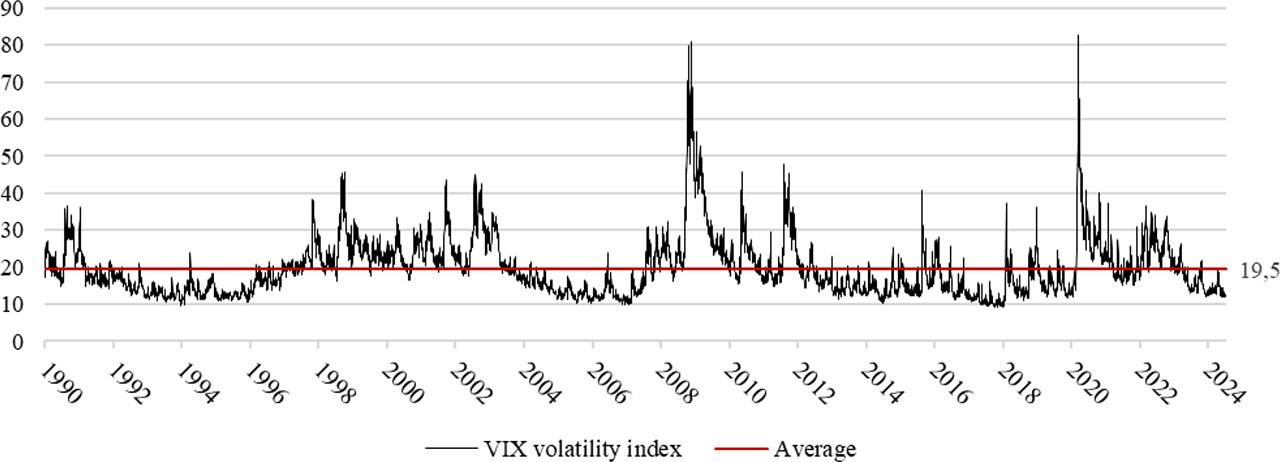
Figure 2.
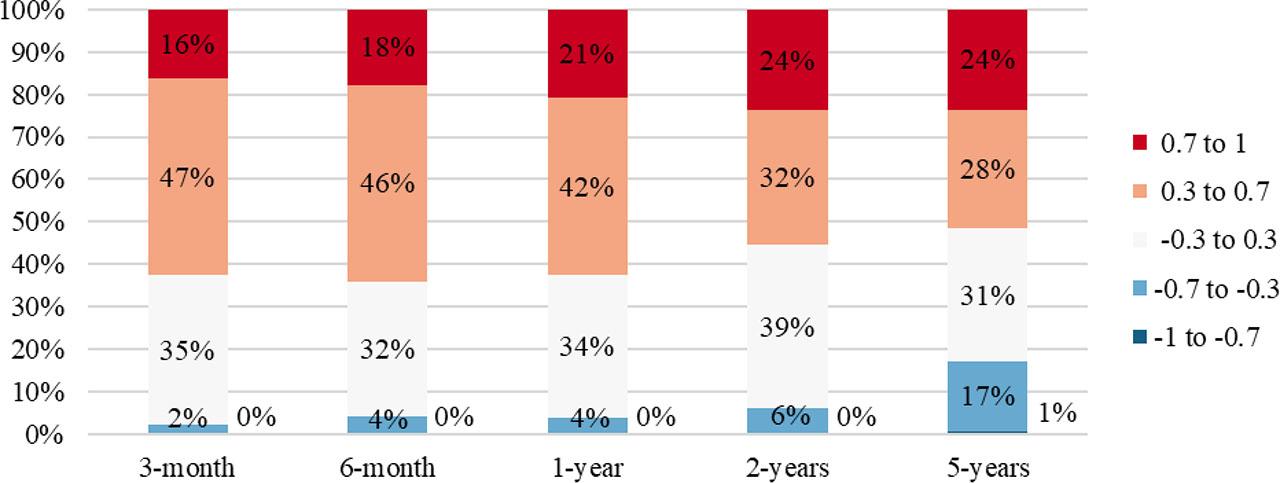
Figure 3.
Figure 4.
Rule of thumb for interpreting the size of a correlation coefficient
| Size of correlation | Interpretation |
|---|---|
| .90 to 1.00 (−.90 to −1.00) | Very high positive (negative) correlation |
| .70 to .90 (−.70 to −.90) | High positive (negative) correlation |
| .50 to .70 (−.50 to −.70) | Moderate positive (negative) correlation |
| .30 to .50 (−.30 to −.50) | Low positive (negative) correlation |
| .00 to .30 (.00 to −.30) | Negligible correlation |
Selected asset classes and data series and source description
| Broad asset classes | Selected asset class | Representative ticker(s) or index | Sample period and frequency |
|---|---|---|---|
| U.S. equities | U.S. broad equity | Index: Wilshire 5000 Total Market Index, Close; Data series: WILL5000PR – FRED | 1970-12-31 to 1979-11-30 – monthly, 1979-12-03 to 2024-03-28 – daily |
| U.S. Large cap (S&P 500 index) | Ticker: SPY - SPDR S&P 500 ETF Trust, Close; Data series: SPY – Yahoo Finance | 1980-01-02 to 2024-05-10 – daily | |
| U.S. sectoral equities | Tickers: XLE, XLU, XLK, XLB, XLP, XLY, XLI, XLV, XLF - Select Sectors SPDR Funds, all Close; Data series: all – Yahoo Finance; IYR - iShares U.S. Real Estate ETF, all Close; Data series: all – Yahoo Finance Index: S&P Communication Services Select Sector Index, Close; Data series: ^SP500-50 – Yahoo Finance | XLE, XLU, XLK, XLB, XLP, XLY, XLI, XLV, XLF - 1998-12-22 to 2024-04-05 – daily; IYR - 2000-06-19 to 2024-04-05 – daily; ^SP500-50 - 1993-05-04 to 2024-04-05 – daily. | |
| U.S. growth equities | Ticker: IUSG - iShares Core S&P U.S. Growth ETF, Close; Data series: IUSG - Yahoo Finance | 2000-07-28 to 2024-04-08 – daily | |
| U.S. value equities | Ticker: IUSV - iShares Core S&P U.S. Value ETF, Close; Data series: IUSV – Yahoo Finance | 2000-08-04 to 2024-04-05 – daily | |
| International equities | Developed countries’ equities ex.-U.S. | Ticker: VEA - Vanguard FTSE Developed Markets Index Fund ETF Shares, Close; Data series: VEA – Yahoo Finance | 2007-07-26 to 2024-04-05 – daily |
| EU equities | Ticker: EZU - iShares MSCI Eurozone ETF, Close; Data series: EZU – Yahoo Finance | 2000-07-31 to 2024-04-05 – daily | |
| Japan equities | Ticker: EWJ - iShares MSCI Japan ETF, Close; Data Series: EWJ – Yahoo Finance | 1996-03-18 to 2024-04-05 – daily | |
| Developing countries’ equities ex.-China | Ticker: EMXC - iShares MSCI Emerging Markets ex China ETF, Close; Data Series: EMXC – Yahoo Finance | 2017-07-26 to 2024-04-05 – daily | |
| Metals such as gold, silver, platinum and copper | Gold | Index: LBMA Gold Price PM ($/ozt); Data Series: Global Gold price - Historical Data (1979-Present) – Kaggle | 1985-01-01 to 2023-10-06 - daily |
| Silver | Index: LBMA Silver Price ($/ozt); Data Series: Daily Silver prices (1968 – 2022) – Kaggle | 1968-01-02 to 2022-04-21 - daily | |
| Platinum | Index: Platinum London PM Fix ($/ozt); Data Series: Daily London Fix Prices 1990 – 2024 – Kaggle | 1990-04-02 to 2023-10-09 – daily | |
| Copper | Index: FRED Global price of Copper ($/ton); Data Series: PCOPPUSDM – FRED | 1991-01-01 to 2024-02-01 – monthly | |
| Oil, Energy, and Agriculture commodities – exposure | Oil | Ticker: DBO - Invesco DB Oil Fund, Close; Data Series: DBO – Yahoo Finance | 2007-01-05 to 2024-04-05 – daily |
| Uranium | Ticker: URA - Global X Uranium ETF, Close; Data Series: URA – Yahoo Finance | 2010-11-05 to 2024-04-05 – daily | |
| Agriculture commodities | Ticker: DBA - Invesco DB Agriculture Fund, Close; Data Series: DBA – Yahoo Finance | 2007-01-05 to 2024-04-05 – daily | |
| Alternative investment – exposure | Cryptocurrency – Bitcoin | Ticker: GBTC - Grayscale Bitcoin Trust ETF (BTC), Close; Data Series: GBTC – Yahoo Finance | 2015-05-11 to 2024-04-08 – daily |
| Government bonds – exposure | U.S. Long-term bonds | Ticker: TLT - iShares 20+ Year Treasury Bond ETF), Close; Data Series: TLT – Yahoo Finance | 2002-07-30 to 2024-04-19 – daily |
| U.S. Mid-term bonds | Ticker: IEF - iShares 7–10 Year Treasury Bond ETF, Close; Data Series: IEF – Yahoo Finance | 2002-07-30 to 2024-04-19 – daily | |
| U.S. Inflation-linked bonds | Ticker: TIP - iShares TIPS Bond ETF, Close; Data Series: TIP – Yahoo Finance | 2003-12-05 to 2024-04-19 – daily | |
| Developing countries’ government bonds | Ticker: EMB - iShares J.P. Morgan USD Emerging Markets Bond ETF, Close; Data Series: EMB – Yahoo Finance | 2007-12-19 to 2024-04-19 – daily | |
| Corporate bonds - exposure | U.S. Corporate bonds | Ticker: VCIT - Vanguard Intermediate-Term Corporate Bond Index Fund ETF Shares, Close; Data Series: VCIT – Yahoo Finance | 2009-11-23 to 2024-04-19 – daily |
| International corporate bonds | Ticker: CEMB - iShares J.P. Morgan EM Corporate Bond ETF, Close; Data Series: CEMB – Yahoo Finance | 2012-04-19 to 2024-04-19 – daily | |
| Mixed bonds – exposure | T-Bills, Corporate, MBS and Agency Bonds | Ticker: BND - Vanguard Total Bond Market Index Fund, Close; Data Series: BND – Yahoo Finance | 2007-04-10 to 2024-04-19 – daily |
| Broad-based short-term investment grade | Ticker: BSV - Vanguard Short-Term Bond Index Fund ETF Shares, Close; Data Series: BSV – Yahoo Finance | 2007-04-10 to 2024-04-19 – daily |
The number of transition pairs with a change in the sign of correlation and the strength of correlation for each rolling period
| 3-month | 6-month | 1 year | 2 years | 5 years | |
|---|---|---|---|---|---|
| x=pos, y=pos | 341 | 356 | 364 | 308 | 242 |
| x=pos, y=neg | 11 | 15 | 21 | 17 | 67 |
| x=neg, y=pos | 64 | 33 | 39 | 53 | 2 |
| x=neg, y=neg | 51 | 63 | 43 | 89 | 92 |
| Share of asset pairs which do not change the sign of the correlation | 16% | 10% | 13% | 15% | 17% |
| x<0.3; x>−0.3; y>−0.3; y<0.3 – weak correlation during both periods | 238 | 196 | 126 | 114 | 140 |
| x<0.3; x>−0.3; y<−0.3; y>0.3 – weak correlation during VIX<20, stronger correlation during VIX>20 | 82 | 90 | 104 | 75 | 42 |
| x>0.3; x<−0.3; y>−0.3; y<0.3 – stronger correlation during VIX<20, weak correlation during VIX>20 | 12 | 19 | 31 | 40 | 56 |
| x>0.3; x<−0.3; y<−0.3; y>0.3 – stronger correlation during both periods | 135 | 162 | 206 | 238 | 165 |
| Share of asset pairs which changed correlation both from weak to stronger and from stronger to weak | 20% | 23% | 29% | 25% | 24% |
Summary statistics of asset yearly rolling returns
| Count | Mean | Std | Min | Max | |
|---|---|---|---|---|---|
| BND | 4,036 | 0.028 | 0.050 | −0.168 | 0.180 |
| BSV | 4,034 | 0.020 | 0.029 | −0.077 | 0.135 |
| CEMB | 2,770 | 0.026 | 0.070 | −0.187 | 0.294 |
| DBA | 4,091 | 0.002 | 0.185 | −0.470 | 0.642 |
| DBO | 4,091 | 0.027 | 0.363 | −0.646 | 1.374 |
| EMB | 3,859 | 0.046 | 0.102 | −0.257 | 0.644 |
| EMXC | 1,433 | 0.041 | 0.199 | −0.319 | 0.875 |
| EWJ | 6,809 | 0.036 | 0.204 | −0.434 | 0.854 |
| EZU | 5,707 | 0.062 | 0.227 | −0.591 | 0.814 |
| GBTC | 1,990 | 1.835 | 3.404 | −0.891 | 33.085 |
| gold | 9,854 | 0.059 | 0.150 | −0.292 | 0.709 |
| IEF | 5,218 | 0.033 | 0.066 | −0.181 | 0.205 |
| IUSG | 5,709 | 0.092 | 0.192 | −0.513 | 0.825 |
| IUSV | 5,703 | 0.090 | 0.167 | −0.508 | 0.797 |
| IYR | 5,736 | 0.101 | 0.211 | −0.592 | 1.250 |
| PCOPPUSDM | 8,373 | 0.081 | 0.312 | −0.581 | 1.486 |
| platinum | 8,147 | 0.047 | 0.219 | −0.543 | 0.978 |
| silver | 10,438 | 0.045 | 0.303 | −0.700 | 1.712 |
| SPY | 10,932 | 0.103 | 0.163 | −0.486 | 0.750 |
| TIP | 4,877 | 0.034 | 0.057 | −0.134 | 0.206 |
| TLT | 5,218 | 0.045 | 0.130 | −0.358 | 0.434 |
| URA | 3,122 | −0.035 | 0.381 | −0.600 | 1.776 |
| VCIT | 3,373 | 0.037 | 0.062 | −0.182 | 0.211 |
| VEA | 3,951 | 0.049 | 0.191 | −0.525 | 0.787 |
| WILL5000PR | 11,282 | 0.101 | 0.168 | −0.488 | 0.817 |
| XLB | 6,111 | 0.093 | 0.191 | −0.545 | 1.017 |
| XLE | 6,111 | 0.108 | 0.264 | −0.595 | 1.166 |
| XLF | 6,111 | 0.073 | 0.235 | −0.721 | 1.507 |
| XLI | 6,111 | 0.095 | 0.191 | −0.555 | 0.995 |
| XLK | 6,111 | 0.111 | 0.253 | −0.638 | 0.878 |
| XLP | 6,111 | 0.074 | 0.112 | −0.299 | 0.452 |
| XLU | 6,111 | 0.081 | 0.153 | −0.463 | 0.504 |
| XLV | 6,111 | 0.090 | 0.129 | −0.337 | 0.557 |
| XLY | 6,111 | 0.106 | 0.193 | −0.495 | 1.003 |
| ^SP500-50 | 7,532 | 0.052 | 0.228 | −0.58 | 0.755 |
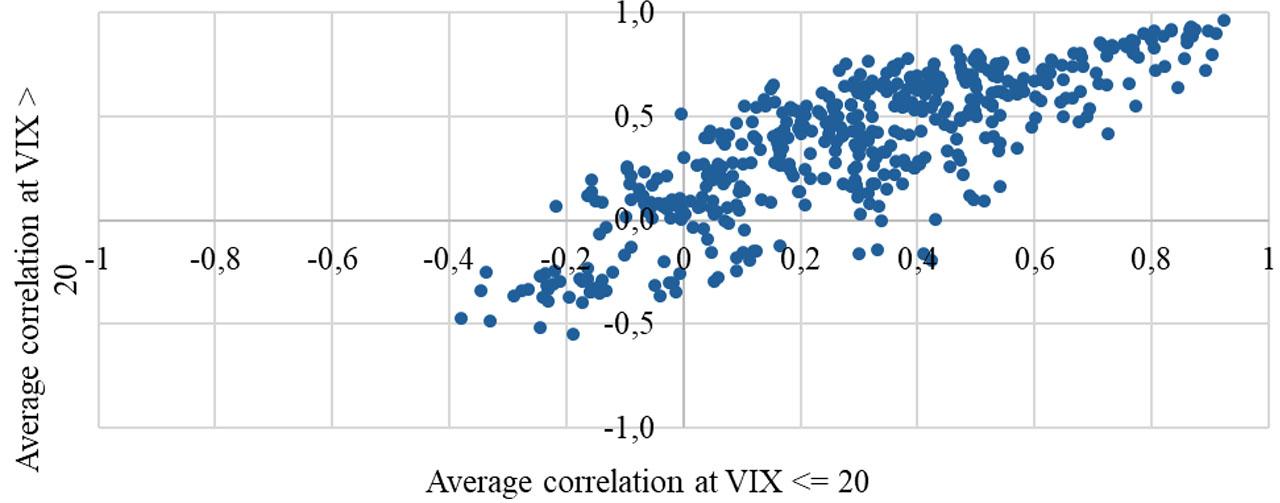
Average absolute difference of average correlation during VIX>20 and VIX<20 per different periods
| Asset class pair | 3-month | 6-month | 1-year | 2-year | 5-year |
|---|---|---|---|---|---|
| International equities-Alternative investment | 0.301 | 0.269 | 0.125 | 0.160 | n/a |
| International equities-Government bonds | 0.140 | 0.109 | 0.168 | 0.202 | 0.125 |
| International equities-Mixed bonds | 0.243 | 0.058 | 0.147 | 0.247 | 0.066 |
| International equities-Corporate bonds | 0.268 | 0.155 | 0.265 | 0.213 | 0.096 |
| International equities-Metals such as gold, silver, platinum and copper | 0.119 | 0.094 | 0.220 | 0.167 | 0.105 |
| U.S. equities-International equities | 0.112 | 0.150 | 0.123 | 0.120 | 0.078 |
| U.S. equities-Oil. Energy. and Agriculture commodities | 0.157 | 0.137 | 0.215 | 0.112 | 0.181 |
| U.S. equities-Alternative investment | 0.229 | 0.186 | 0.229 | 0.165 | n/a |
| U.S. equities-Government bonds | 0.143 | 0.153 | 0.216 | 0.169 | 0.195 |
| U.S. equities-Mixed bonds | 0.173 | 0.119 | 0.144 | 0.203 | 0.138 |
| U.S. equities-Corporate bonds | 0.203 | 0.198 | 0.218 | 0.169 | 0.075 |
| U.S. equities-Metals such as gold, silver, platinum and copper | 0.071 | 0.111 | 0.177 | 0.203 | 0.323 |
| Oil, Energy, and Agriculture commodities - International equities | 0.110 | 0.137 | 0.207 | 0.118 | 0.103 |
| Oil, Energy, and Agriculture commodities - Alternative investment | 0.257 | 0.35 | 0.224 | 0.374 | n/a |
| Oil, Energy, and Agriculture commodities - Government bonds | 0.149 | 0.086 | 0.123 | 0.123 | 0.110 |
| Oil, Energy, and Agriculture commodities - Mixed bonds | 0.135 | 0.04 | 0.130 | 0.087 | 0.164 |
| Oil, Energy, and Agriculture commodities - Corporate bonds | 0.167 | 0.059 | 0.129 | 0.193 | 0.168 |
| Oil, Energy, and Agriculture commodities - Metals such as gold, silver, platinum and copper | 0.129 | 0.146 | 0.122 | 0.164 | 0.057 |
| Alternative investment - Government bonds | 0.181 | 0.227 | 0.149 | 0.227 | n/a |
| Alternative investment - Mixed bonds | 0.042 | 0.272 | 0.062 | 0.353 | n/a |
| Alternative investment - Corporate bonds | 0.158 | 0.087 | 0.167 | 0.168 | n/a |
| Alternative investment - Metals such as gold, silver, platinum and copper | 0.183 | 0.180 | 0.234 | 0.174 | n/a |
| Government bonds-Mixed bonds | 0.072 | 0.058 | 0.128 | 0.125 | 0.034 |
| Government bonds-Corporate bonds | 0.084 | 0.066 | 0.113 | 0.119 | 0.043 |
| Government bonds-Metals such as gold, silver, platinum and copper | 0.095 | 0.116 | 0.16 | 0.093 | 0.261 |
| Mixed bonds-Corporate bonds | 0.084 | 0.051 | 0.072 | 0.154 | 0.030 |
| Mixed bonds-Metals such as gold, silver, platinum and copper | 0.084 | 0.067 | 0.095 | 0.173 | 0.050 |
| Corporate bonds-Metals such as gold, silver, platinum and copper | 0.170 | 0.085 | 0.106 | 0.090 | 0.187 |
| The absolute value of the correlation difference at VIX >20 and at VIX <= 20, the average value of the difference across all asset pairs | 0.139 | 0.132 | 0.173 | 0.160 | 0.160 |
Regression results for 1-year rolling correlation of 1-year rolling returns, asset pairs with difference >0_30 of average correlation between different volatility regimes
| No. | Ticker Pair | R^2 | Intcpt. | Slope | P-value | Stand. Err. | Avg Corr VIX <=20 | Avg Corr VIX > 20 | Avg Corr VIX > 30 | Abs. difference at VIX > 20 and VIX <=20 | T-val. | Conf Int Lower | Conf Int Upper | Shapiro-Wilk Stat | Shapiro-Wilk P-value | Breusch-Pagan Stat | Breusch-Pagan P-value | Durbin-Watson Stat |
|---|---|---|---|---|---|---|---|---|---|---|---|---|---|---|---|---|---|---|
| 1 | TLT-XLU | 0.26 | 0.81 | −0.03 | 0.00 | 0.001 | 0.42 | −0.19 | −0.32 | 0.61 | −41.56 | −0.032 | −0.029 | 0.960 | 0.000 | 364 | 0.000 | 0.0158 |
| 2 | IEF-XLU | 0.25 | 0.79 | −0.03 | 0.00 | 0.001 | 0.41 | −0.16 | −0.33 | 0.57 | −40.35 | −0.031 | −0.028 | 0.961 | 0.000 | 189 | 0.000 | 0.0150 |
| 3 | DBO-XLU | 0.20 | −0.31 | 0.02 | 0.00 | 0.001 | 0.00 | 0.51 | 0.59 | 0.52 | 31.46 | 0.023 | 0.027 | 0.953 | 0.000 | 15 | 0.000 | 0.0124 |
| 4 | CEMB-XLY | 0.22 | −0.29 | 0.03 | 0.00 | 0.001 | 0.15 | 0.65 | 0.72 | 0.50 | 26.74 | 0.030 | 0.035 | 0.966 | 0.000 | 41 | 0.000 | 0.0185 |
| 5 | EMB-XLY | 0.22 | −0.23 | 0.03 | 0.00 | 0.001 | 0.15 | 0.63 | 0.73 | 0.48 | 32.36 | 0.026 | 0.030 | 0.962 | 0.000 | 78 | 0.000 | 0.0146 |
| 6 | GBTC-^SP500-50 | 0.25 | −0.10 | 0.03 | 0.00 | 0.001 | 0.28 | 0.75 | 0.78 | 0.48 | 24.52 | 0.026 | 0.031 | 0.899 | 0.000 | 36 | 0.000 | 0.0209 |
| 7 | IEF-IYR | 0.15 | 0.69 | −0.03 | 0.00 | 0.001 | 0.33 | −0.14 | −0.39 | 0.47 | −29.62 | −0.028 | −0.025 | 0.923 | 0.000 | 5 | 0.027 | 0.0082 |
| 8 | IYR-TLT | 0.15 | 0.66 | −0.03 | 0.00 | 0.001 | 0.30 | −0.16 | −0.38 | 0.46 | −29.76 | −0.028 | −0.025 | 0.942 | 0.000 | 39 | 0.000 | 0.0083 |
| 9 | VEA-^SP500-50 | 0.19 | −0.05 | 0.02 | 0.00 | 0.001 | 0.27 | 0.72 | 0.84 | 0.46 | 29.73 | 0.023 | 0.026 | 0.942 | 0.000 | 149 | 0.000 | 0.0112 |
| 10 | CEMB-EWJ | 0.15 | −0.02 | 0.03 | 0.00 | 0.001 | 0.32 | 0.77 | 0.80 | 0.45 | 21.54 | 0.024 | 0.028 | 0.927 | 0.000 | 2 | 0.201 | 0.0121 |
| 11 | DBO-XLP | 0.21 | −0.21 | 0.02 | 0.00 | 0.001 | 0.10 | 0.55 | 0.65 | 0.45 | 32.37 | 0.023 | 0.026 | 0.961 | 0.000 | 19 | 0.000 | 0.0130 |
| 12 | GBTC-URA | 0.27 | −0.24 | 0.03 | 0.00 | 0.001 | 0.14 | 0.58 | 0.73 | 0.44 | 25.62 | 0.026 | 0.031 | 0.980 | 0.000 | 46 | 0.000 | 0.0232 |
| 13 | BSV-XLU | 0.10 | 0.57 | −0.02 | 0.00 | 0.001 | 0.43 | 0.00 | 0.04 | 0.43 | −21.10 | −0.017 | −0.014 | 0.976 | 0.000 | 709 | 0.000 | 0.0058 |
| 14 | VCIT-XLU | 0.16 | 0.82 | −0.02 | 0.00 | 0.001 | 0.51 | 0.09 | 0.14 | 0.42 | −24.45 | −0.025 | −0.021 | 0.963 | 0.000 | 976 | 0.000 | 0.0129 |
| 15 | PCOPPUSDM-XLV | 0.23 | −0.22 | 0.03 | 0.00 | 0.001 | 0.12 | 0.54 | 0.66 | 0.42 | 42.07 | 0.025 | 0.027 | 0.955 | 0.000 | 176 | 0.000 | 0.0136 |
| 16 | GBTC-silver | 0.14 | −0.03 | 0.02 | 0.00 | 0.001 | 0.16 | 0.57 | 0.61 | 0.41 | 14.61 | 0.014 | 0.019 | 0.911 | 0.000 | 4 | 0.048 | 0.0104 |
| 17 | PCOPPUSDM-WILL5000PR | 0.18 | −0.26 | 0.03 | 0.00 | 0.001 | 0.14 | 0.55 | 0.70 | 0.41 | 41.07 | 0.027 | 0.030 | 0.930 | 0.000 | 232 | 0.000 | 0.0092 |
| 18 | GBTC-PCOPPUSDM | 0.18 | 0.01 | 0.02 | 0.00 | 0.001 | 0.30 | 0.70 | 0.76 | 0.40 | 19.53 | 0.021 | 0.025 | 0.919 | 0.000 | 31 | 0.000 | 0.0139 |
| 19 | BND-XLU | 0.07 | 0.58 | −0.01 | 0.00 | 0.001 | 0.50 | 0.10 | 0.22 | 0.40 | −16.83 | −0.013 | −0.011 | 0.971 | 0.000 | 852 | 0.000 | 0.0039 |
| 20 | CEMB-EZU | 0.10 | 0.10 | 0.02 | 0.00 | 0.001 | 0.38 | 0.78 | 0.86 | 0.40 | 17.27 | 0.020 | 0.025 | 0.912 | 0.000 | 126 | 0.000 | 0.0079 |
| 21 | GBTC-XLY | 0.28 | 0.08 | 0.02 | 0.00 | 0.001 | 0.37 | 0.75 | 0.79 | 0.39 | 26.36 | 0.021 | 0.024 | 0.917 | 0.000 | 44 | 0.000 | 0.0245 |
| 22 | DBA-XLV | 0.20 | −0.23 | 0.02 | 0.00 | 0.001 | 0.04 | 0.43 | 0.53 | 0.38 | 30.87 | 0.019 | 0.022 | 0.982 | 0.000 | 39 | 0.000 | 0.0119 |
| 23 | CEMB-IUSG | 0.16 | 0.05 | 0.02 | 0.00 | 0.001 | 0.36 | 0.74 | 0.77 | 0.38 | 21.92 | 0.021 | 0.025 | 0.899 | 0.000 | 10 | 0.002 | 0.0125 |
| 24 | DBA-XLP | 0.18 | −0.19 | 0.02 | 0.00 | 0.001 | 0.09 | 0.47 | 0.58 | 0.38 | 29.48 | 0.020 | 0.023 | 0.966 | 0.000 | 14 | 0.000 | 0.0109 |
| 25 | URA-^SP500-50 | 0.22 | −0.06 | 0.03 | 0.00 | 0.001 | 0.29 | 0.67 | 0.77 | 0.38 | 28.82 | 0.024 | 0.027 | 0.962 | 0.000 | 8 | 0.004 | 0.0190 |
| 26 | EMB-EWJ | 0.10 | −0.01 | 0.02 | 0.00 | 0.001 | 0.24 | 0.61 | 0.64 | 0.38 | 20.57 | 0.017 | 0.021 | 0.931 | 0.000 | 65 | 0.000 | 0.0061 |
| 27 | BND-IYR | 0.07 | 0.68 | −0.01 | 0.00 | 0.001 | 0.54 | 0.17 | 0.15 | 0.37 | −16.58 | −0.016 | −0.012 | 0.913 | 0.000 | 361 | 0.000 | 0.0037 |
| 28 | BSV-IYR | 0.10 | 0.65 | −0.02 | 0.00 | 0.001 | 0.49 | 0.12 | 0.00 | 0.37 | −20.49 | −0.017 | −0.014 | 0.946 | 0.000 | 479 | 0.000 | 0.0055 |
| 29 | IUSG-PCOPPUSDM | 0.18 | −0.04 | 0.02 | 0.00 | 0.001 | 0.28 | 0.65 | 0.75 | 0.37 | 34.90 | 0.022 | 0.024 | 0.912 | 0.000 | 140 | 0.000 | 0.0100 |
| 30 | IYR-URA | 0.18 | 0.08 | 0.02 | 0.00 | 0.001 | 0.36 | 0.72 | 0.79 | 0.36 | 25.31 | 0.020 | 0.023 | 0.948 | 0.000 | 0 | 0.892 | 0.0144 |
| 31 | VCIT-XLY | 0.08 | −0.22 | 0.02 | 0.00 | 0.001 | 0.04 | 0.40 | 0.30 | 0.36 | 16.52 | 0.017 | 0.022 | 0.962 | 0.000 | 0 | 0.521 | 0.0061 |
| 32 | EZU-PCOPPUSDM | 0.16 | 0.08 | 0.02 | 0.00 | 0.001 | 0.35 | 0.71 | 0.80 | 0.36 | 31.80 | 0.019 | 0.022 | 0.909 | 0.000 | 154 | 0.000 | 0.0084 |
| 33 | DBO-IYR | 0.14 | −0.09 | 0.02 | 0.00 | 0.001 | 0.18 | 0.54 | 0.63 | 0.36 | 25.49 | 0.019 | 0.022 | 0.930 | 0.000 | 35 | 0.000 | 0.0083 |
| 34 | EZU-^SP500-50 | 0.13 | 0.00 | 0.02 | 0.00 | 0.001 | 0.29 | 0.65 | 0.77 | 0.36 | 29.13 | 0.020 | 0.023 | 0.937 | 0.000 | 251 | 0.000 | 0.0069 |
| 35 | TLT-XLE | 0.12 | 0.04 | −0.02 | 0.00 | 0.001 | −0.19 | −0.55 | −0.65 | 0.36 | −26.26 | −0.019 | −0.016 | 0.956 | 0.000 | 1 | 0.299 | 0.0065 |
| 36 | DBA-EWJ | 0.13 | −0.23 | 0.02 | 0.00 | 0.001 | 0.06 | 0.42 | 0.55 | 0.36 | 24.49 | 0.020 | 0.023 | 0.930 | 0.000 | 110 | 0.000 | 0.0075 |
| 37 | PCOPPUSDM-XLY | 0.17 | −0.25 | 0.03 | 0.00 | 0.001 | 0.12 | 0.47 | 0.67 | 0.35 | 35.23 | 0.024 | 0.027 | 0.938 | 0.000 | 33 | 0.000 | 0.0096 |
| 38 | EWJ-TIP | 0.09 | −0.40 | 0.02 | 0.00 | 0.001 | −0.16 | 0.20 | 0.25 | 0.35 | 21.03 | 0.017 | 0.021 | 0.937 | 0.000 | 67 | 0.000 | 0.0045 |
| 39 | silver-XLV | 0.20 | −0.40 | 0.02 | 0.00 | 0.001 | −0.10 | 0.26 | 0.41 | 0.35 | 36.31 | 0.021 | 0.023 | 0.967 | 0.000 | 43 | 0.000 | 0.0107 |
| 40 | DBA-XLY | 0.16 | −0.27 | 0.02 | 0.00 | 0.001 | 0.04 | 0.40 | 0.53 | 0.35 | 27.12 | 0.020 | 0.024 | 0.949 | 0.000 | 47 | 0.000 | 0.0092 |
| 41 | PCOPPUSDM-SPY | 0.15 | −0.20 | 0.03 | 0.00 | 0.001 | 0.17 | 0.52 | 0.66 | 0.35 | 37.52 | 0.024 | 0.027 | 0.922 | 0.000 | 168 | 0.000 | 0.0077 |
| 42 | CEMB-VEA | 0.11 | 0.22 | 0.02 | 0.00 | 0.001 | 0.47 | 0.82 | 0.86 | 0.35 | 17.80 | 0.017 | 0.022 | 0.888 | 0.000 | 97 | 0.000 | 0.0084 |
| 43 | EWJ-URA | 0.19 | −0.13 | 0.03 | 0.00 | 0.001 | 0.25 | 0.59 | 0.73 | 0.35 | 26.14 | 0.025 | 0.029 | 0.950 | 0.000 | 4 | 0.047 | 0.0157 |
| 44 | EMB-EZU | 0.09 | 0.09 | 0.02 | 0.00 | 0.001 | 0.32 | 0.67 | 0.70 | 0.35 | 19.36 | 0.016 | 0.020 | 0.914 | 0.000 | 122 | 0.000 | 0.0054 |
| 45 | TLT-XLP | 0.12 | 0.35 | −0.02 | 0.00 | 0.001 | 0.05 | −0.29 | −0.45 | 0.35 | −26.44 | −0.023 | −0.020 | 0.926 | 0.000 | 9 | 0.003 | 0.0065 |
| 46 | EZU-silver | 0.17 | −0.07 | 0.02 | 0.00 | 0.001 | 0.19 | 0.53 | 0.61 | 0.34 | 31.46 | 0.018 | 0.020 | 0.949 | 0.000 | 38 | 0.000 | 0.0088 |
| 47 | DBA-VCIT | 0.10 | 0.62 | −0.02 | 0.00 | 0.001 | 0.34 | 0.00 | −0.27 | 0.34 | −18.95 | −0.023 | −0.018 | 0.938 | 0.000 | 57 | 0.000 | 0.0081 |
| 48 | EWJ-IYR | 0.17 | −0.10 | 0.02 | 0.00 | 0.001 | 0.19 | 0.53 | 0.62 | 0.34 | 33.59 | 0.020 | 0.022 | 0.955 | 0.000 | 8 | 0.004 | 0.0091 |
| 49 | silver-VEA | 0.20 | −0.03 | 0.02 | 0.00 | 0.001 | 0.21 | 0.55 | 0.69 | 0.34 | 28.22 | 0.017 | 0.019 | 0.952 | 0.000 | 146 | 0.000 | 0.0114 |
| 50 | EMB-IUSG | 0.13 | 0.06 | 0.02 | 0.00 | 0.001 | 0.31 | 0.65 | 0.70 | 0.34 | 23.00 | 0.017 | 0.020 | 0.908 | 0.000 | 54 | 0.000 | 0.0075 |
| 51 | TIP-XLY | 0.09 | −0.33 | 0.02 | 0.00 | 0.001 | −0.10 | 0.24 | 0.32 | 0.34 | 21.67 | 0.017 | 0.020 | 0.964 | 0.000 | 65 | 0.000 | 0.0048 |
| 52 | silver-TLT | 0.11 | 0.32 | −0.02 | 0.00 | 0.001 | 0.06 | −0.28 | −0.52 | 0.33 | −23.31 | −0.021 | −0.018 | 0.971 | 0.000 | 195 | 0.000 | 0.0055 |
| 53 | IEF-XLP | 0.13 | 0.39 | −0.02 | 0.00 | 0.001 | 0.09 | −0.24 | −0.44 | 0.33 | −26.77 | −0.023 | −0.020 | 0.948 | 0.000 | 18 | 0.000 | 0.0067 |
| 54 | IUSG-silver | 0.15 | −0.18 | 0.02 | 0.00 | 0.001 | 0.08 | 0.41 | 0.50 | 0.33 | 29.90 | 0.018 | 0.021 | 0.971 | 0.000 | 2 | 0.169 | 0.0078 |
| 55 | DBA-TLT | 0.10 | 0.23 | −0.02 | 0.00 | 0.001 | −0.01 | −0.34 | −0.53 | 0.33 | −20.89 | −0.020 | −0.017 | 0.967 | 0.000 | 0 | 0.784 | 0.0056 |
| 56 | DBA-IUSG | 0.17 | −0.07 | 0.02 | 0.00 | 0.001 | 0.19 | 0.52 | 0.62 | 0.33 | 28.49 | 0.018 | 0.020 | 0.957 | 0.000 | 1 | 0.351 | 0.0102 |
| 57 | TLT-XLV | 0.12 | 0.25 | −0.02 | 0.00 | 0.001 | −0.04 | −0.36 | −0.49 | 0.33 | −26.59 | −0.022 | −0.019 | 0.929 | 0.000 | 39 | 0.000 | 0.0067 |
| 58 | URA-XLY | 0.18 | −0.03 | 0.03 | 0.00 | 0.001 | 0.34 | 0.67 | 0.78 | 0.32 | 25.42 | 0.024 | 0.028 | 0.923 | 0.000 | 22 | 0.000 | 0.0149 |
| 59 | GBTC-WILL5000PR | 0.23 | 0.18 | 0.02 | 0.00 | 0.001 | 0.43 | 0.75 | 0.80 | 0.32 | 23.25 | 0.018 | 0.021 | 0.890 | 0.000 | 5 | 0.021 | 0.0189 |
| 60 | platinum-XLV | 0.15 | −0.22 | 0.02 | 0.00 | 0.001 | 0.07 | 0.39 | 0.46 | 0.32 | 32.13 | 0.019 | 0.022 | 0.951 | 0.000 | 272 | 0.000 | 0.0082 |
| 61 | EMB-XLF | 0.12 | 0.04 | 0.02 | 0.00 | 0.001 | 0.30 | 0.62 | 0.70 | 0.32 | 22.75 | 0.017 | 0.021 | 0.944 | 0.000 | 234 | 0.000 | 0.0075 |
| 62 | IUSV-PCOPPUSDM | 0.14 | 0.04 | 0.02 | 0.00 | 0.001 | 0.32 | 0.63 | 0.72 | 0.31 | 30.19 | 0.019 | 0.021 | 0.906 | 0.000 | 18 | 0.000 | 0.0077 |
| 63 | IYR-VCIT | 0.14 | 0.94 | −0.02 | 0.00 | 0.001 | 0.73 | 0.42 | 0.37 | 0.31 | −22.93 | −0.018 | −0.015 | 0.897 | 0.000 | 289 | 0.000 | 0.0114 |
| 64 | GBTC-IUSV | 0.17 | 0.06 | 0.02 | 0.00 | 0.001 | 0.34 | 0.65 | 0.71 | 0.31 | 19.18 | 0.019 | 0.023 | 0.862 | 0.000 | 46 | 0.000 | 0.0128 |
| 65 | TLT-^SP500-50 | 0.09 | 0.40 | −0.02 | 0.00 | 0.001 | 0.11 | −0.19 | −0.46 | 0.31 | −22.15 | −0.022 | −0.018 | 0.960 | 0.000 | 14 | 0.000 | 0.0047 |
| 66 | EWJ-XLU | 0.13 | −0.40 | 0.02 | 0.00 | 0.001 | −0.09 | 0.22 | 0.41 | 0.30 | 29.87 | 0.020 | 0.023 | 0.978 | 0.000 | 192 | 0.000 | 0.0069 |
| 67 | EMB-XLI | 0.08 | 0.18 | 0.02 | 0.00 | 0.001 | 0.39 | 0.69 | 0.73 | 0.30 | 18.23 | 0.014 | 0.018 | 0.882 | 0.000 | 196 | 0.000 | 0.0048 |
| 68 | CEMB-WILL5000PR | 0.11 | 0.24 | 0.02 | 0.00 | 0.001 | 0.47 | 0.78 | 0.81 | 0.30 | 18.15 | 0.016 | 0.020 | 0.889 | 0.000 | 46 | 0.000 | 0.0087 |
| 69 | EMB-VEA | 0.08 | 0.20 | 0.02 | 0.00 | 0.001 | 0.40 | 0.70 | 0.72 | 0.30 | 18.21 | 0.014 | 0.017 | 0.905 | 0.000 | 79 | 0.000 | 0.0049 |
| 70 | EMB-XLV | 0.14 | −0.05 | 0.02 | 0.00 | 0.001 | 0.21 | 0.51 | 0.67 | 0.30 | 24.53 | 0.017 | 0.020 | 0.962 | 0.000 | 198 | 0.000 | 0.0086 |
| 71 | EZU-TIP | 0.08 | −0.28 | 0.02 | 0.00 | 0.001 | −0.07 | 0.23 | 0.31 | 0.30 | 19.54 | 0.015 | 0.018 | 0.958 | 0.000 | 60 | 0.000 | 0.0040 |
| 72 | IUSG-TIP | 0.06 | −0.19 | 0.02 | 0.00 | 0.001 | 0.00 | 0.30 | 0.33 | 0.30 | 17.90 | 0.014 | 0.017 | 0.953 | 0.000 | 97 | 0.000 | 0.0034 |
| 73 | DBA-SPY | 0.14 | 0.03 | 0.02 | 0.00 | 0.001 | 0.26 | 0.56 | 0.63 | 0.30 | 24.94 | 0.016 | 0.018 | 0.928 | 0.000 | 31 | 0.000 | 0.0080 |
| 74 | IYR-PCOPPUSDM | 0.16 | −0.14 | 0.02 | 0.00 | 0.001 | 0.18 | 0.47 | 0.64 | 0.30 | 32.04 | 0.020 | 0.023 | 0.955 | 0.000 | 4 | 0.058 | 0.0085 |
| 75 | CEMB-XLI | 0.09 | 0.28 | 0.02 | 0.00 | 0.001 | 0.50 | 0.80 | 0.84 | 0.30 | 16.33 | 0.015 | 0.019 | 0.845 | 0.000 | 64 | 0.000 | 0.0071 |
| 76 | URA-XLF | 0.19 | 0.12 | 0.02 | 0.00 | 0.001 | 0.43 | 0.72 | 0.82 | 0.30 | 26.02 | 0.020 | 0.024 | 0.936 | 0.000 | 3 | 0.070 | 0.0156 |
1-year rolling volatility implications on annual rolling asset returns correlation, sample table of regression results_
| Ticker Pair | TLT-XLU | IEF-XLU | DBO-XLU | CEMB-XLY | EMB-XLY | GBTC-^SP500-50 | IEF-IYR | IYR-TLT | VEA-^SP500-50 |
|---|---|---|---|---|---|---|---|---|---|
| R^2 | 0.26 | 0.25 | 0.20 | 0.22 | 0.22 | 0.25 | 0.15 | 0.15 | 0.19 |
| Intercept | 0.81 | 0.79 | −0.31 | −0.29 | −0.23 | −0.10 | 0.69 | 0.66 | −0.05 |
| Slope | −0.03 | −0.03 | 0.02 | 0.03 | 0.03 | 0.03 | −0.03 | −0.03 | 0.02 |
| P-value | 0.00 | 0.00 | 0.00 | 0.00 | 0.00 | 0.00 | 0.00 | 0.00 | 0.00 |
| Standard Error | 0.001 | 0.001 | 0.001 | 0.001 | 0.001 | 0.001 | 0.001 | 0.001 | 0.001 |
| Avg Corr VIX <= 20 | 0.42 | 0.41 | 0.00 | 0.15 | 0.15 | 0.28 | 0.33 | 0.30 | 0.27 |
| Avg Corr VIX > 20 | −0.19 | −0.16 | 0.51 | 0.65 | 0.63 | 0.75 | −0.14 | −0.16 | 0.72 |
| Avg Corr VIX > 30 | −0.32 | −0.33 | 0.59 | 0.72 | 0.73 | 0.78 | −0.39 | −0.38 | 0.84 |
| Absolute difference at VIX > 20 and VIX <= 20 | 0.61 | 0.57 | 0.52 | 0.50 | 0.48 | 0.48 | 0.47 | 0.46 | 0.46 |
| T-value | −41.56 | −40.35 | 31.46 | 26.74 | 32.36 | 24.52 | −29.62 | −29.76 | 29.73 |
| Conf Int Lower | −0.032 | −0.031 | 0.023 | 0.030 | 0.026 | 0.026 | −0.028 | −0.028 | 0.023 |
| Conf Int Upper | −0.029 | −0.028 | 0.027 | 0.035 | 0.030 | 0.031 | −0.025 | −0.025 | 0.026 |
| Shapiro-Wilk Stat | 0.960 | 0.961 | 0.953 | 0.966 | 0.962 | 0.899 | 0.923 | 0.942 | 0.942 |
| Shapiro-Wilk P-value | 0.000 | 0.000 | 0.000 | 0.000 | 0.000 | 0.000 | 0.000 | 0.000 | 0.000 |
| Breusch-Pagan Stat | 364 | 189 | 15 | 41 | 78 | 36 | 5 | 39 | 149 |
| Breusch-Pagan P-value | 0.000 | 0.000 | 0.000 | 0.000 | 0.000 | 0.000 | 0.027 | 0.000 | 0.000 |
| Durbin-Watson Stat | 0.0158 | 0.0150 | 0.0124 | 0.0185 | 0.0146 | 0.0209 | 0.0082 | 0.0083 | 0.0112 |