

Figure 1.
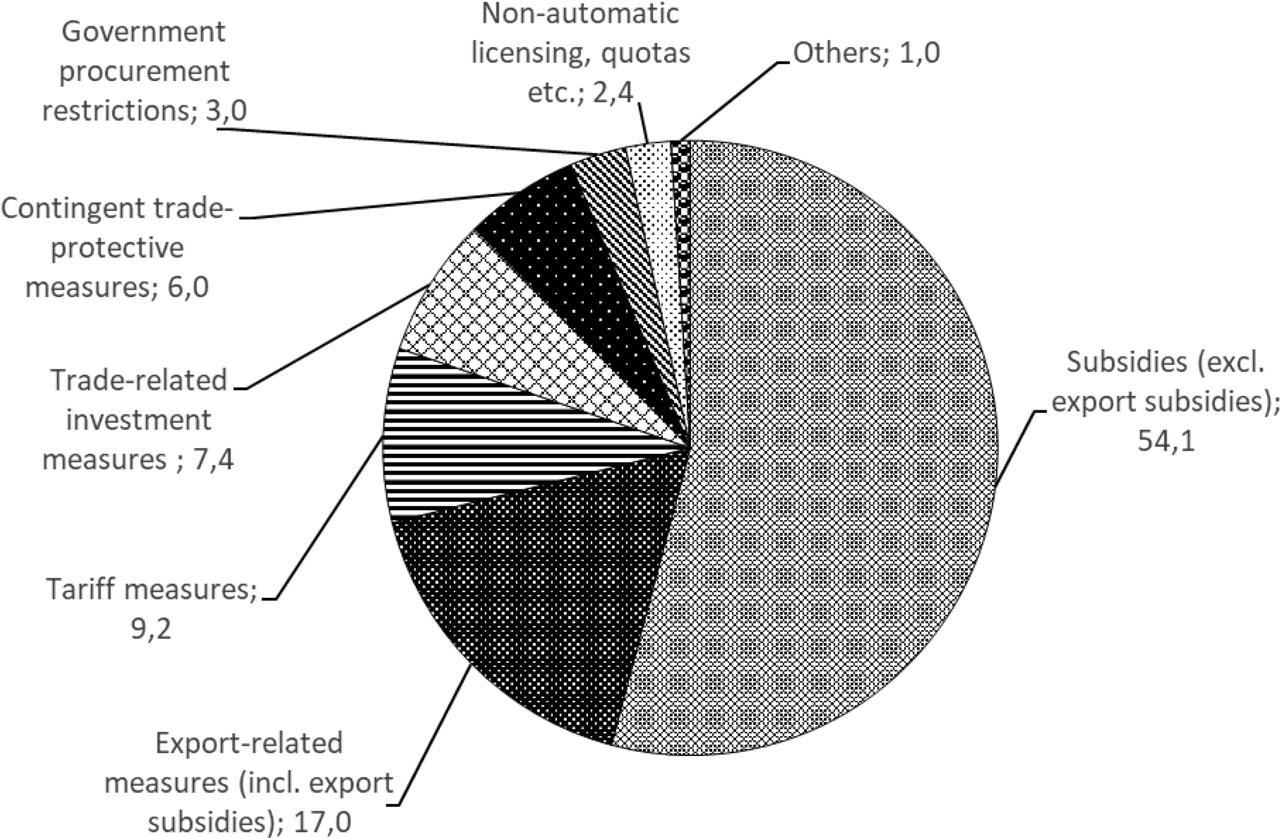
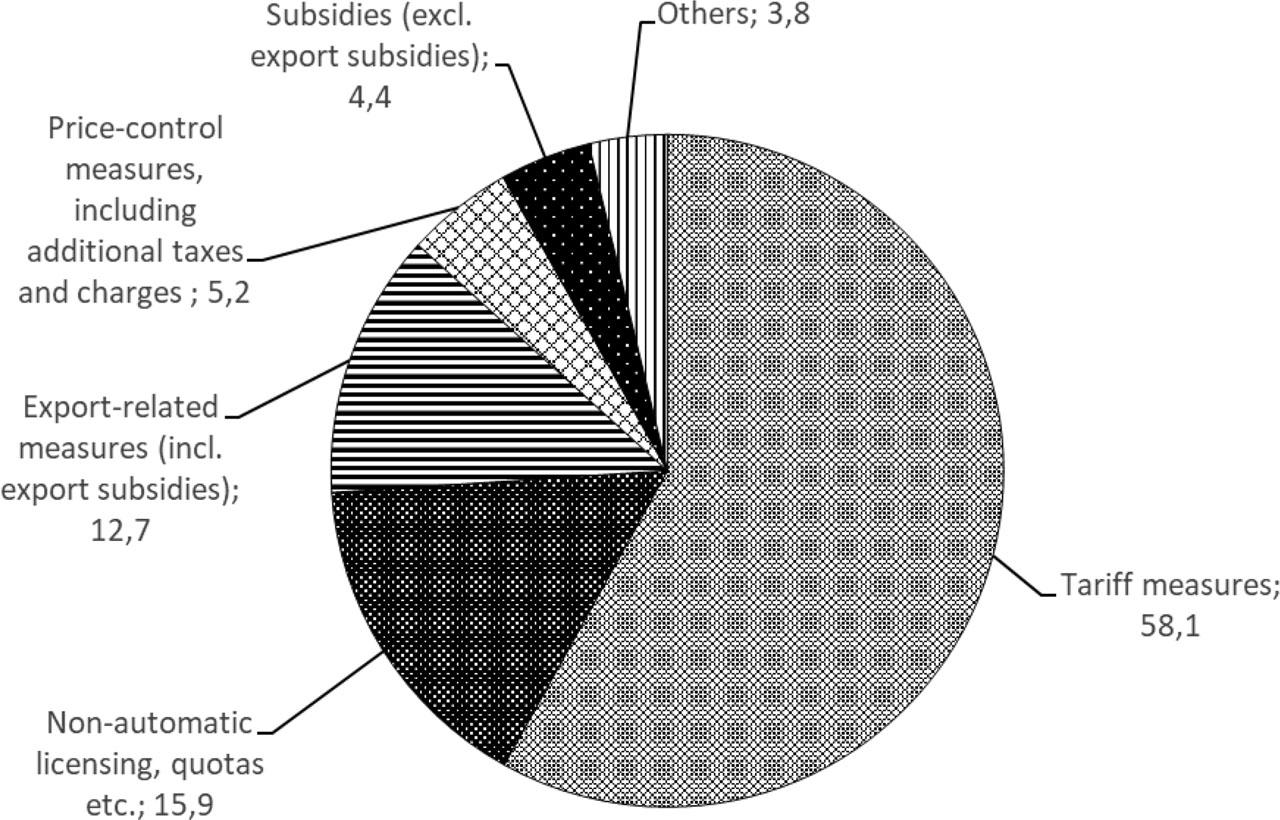
Figure 2.
Countries most contributing and affected by trade interventions in 2010–2022
| No. | Countries most contributing to interventions | Countries most affected by interventions | ||||||
|---|---|---|---|---|---|---|---|---|
| Liberalising policy instruments | Harmful policy instruments | Liberalising policy instruments | Harmful policy instruments | |||||
| Country | Interventions | Country | Interventions | Country | Interventions | Country | Interventions | |
| 1 | Brazil | 814 | USA | 7,790 | China | 3,886 | Germany | 13,035 |
| 2 | India | 712 | China | 5,619 | USA | 3,503 | Italy | 12,608 |
| 3 | Russia | 439 | Brazil | 5,403 | Germany | 3,118 | France | 12,571 |
| 4 | Argentina | 428 | Germany | 1,819 | United Kingdom | 2,886 | United Kingdom | 11,841 |
| 5 | Spain | 382 | India | 1,497 | Italy | 2,860 | Japan | 11,558 |
| 6 | Italy | 381 | Italy | 1,388 | France | 2,768 | Republic of Korea | 11,509 |
| 7 | France | 376 | Canada | 1,379 | Republic of Korea | 2,600 | Spain | 11,363 |
| 8 | Germany | 375 | France | 1,227 | India | 2,553 | China | 11,272 |
| 9 | Netherlands | 375 | Spain | 1,121 | Japan | 2,543 | USA | 11,155 |
| 10 | Hungary | 375 | United Kingdom | 1,014 | Netherlands | 2,474 | Netherlands | 11,011 |
Implementation of non-tariff measures in the EU, US and Chinese trade in goods by category (UNCTAD-MAST classification, as of 11 November, 2020)
| Specification | EU | USA | China | |
|---|---|---|---|---|
| Sanitary and phytosanitary measures | A | 22 | 14 | 36 |
| B | 15 | 12 | 39 | |
| C | 7.5 | 8.7 | 4.1 | |
| Technical barriers to trade | A | 90 | 72 | 88 |
| B | 88 | 81 | 91 | |
| C | 4.1 | 3.3 | 4.5 | |
| Pre-shipment inspection and other formalities | A | 3 | 4 | 14 |
| B | 4 | 7 | 47 | |
| C | 1 | 1.4 | 1.1 | |
| Quantitative restrictions | A | 53 | 20 | 54 |
| B | 66 | 28 | 75 | |
| C | 1.6 | 1 | 1.6 | |
| Price-control measures | A | 0 | 15 | 17 |
| B | 0 | 14 | 23 | |
| C | 0 | 1.2 | 1.1 | |
| Export-related measures | A | 3 | 23 | 73 |
| B | 5 | 32 | 81 | |
| C | 2 | 2.1 | 4.2 | |
Trade policy orientation based on Ehrlich (2010)
| Classification criterion | Oppose protectionism | Support protectionism |
|---|---|---|
| Oppose fair trade | I | III |
| Free trade | Traditional protectionism | |
| Support fair trade | II | IV |
| Fair trade | Neoprotectionism | |
Use of non-tariff measures in the EU, USA and China by sectora (as of 11 November, 2020)
| Country | Total | Agriculture (HS 1–24) | Natural resources (HS 25–27) | Manufacturing (HS 28–97) | ||||||||
|---|---|---|---|---|---|---|---|---|---|---|---|---|
| A | B | C | A | B | C | A | B | C | A | B | C | |
| EU | 92 | 89 | 6.3 | 98 | 98 | 15.5 | 64 | 86 | 4.0 | 92 | 89 | 5.0 |
| USA | 77 | 83 | 4.1 | 100 | 100 | 16.1 | 100 | 100 | 2.4 | 74 | 80 | 2.6 |
| China | 90 | 92 | 6.8 | 100 | 100 | 22.8 | 90 | 98 | 4.7 | 89 | 90 | 5.4 |
Number and structure of implemented interventions in the world goods trade in 2010–2022
| Year | Total | Liberalising policy instruments | Harmful policy instruments | ||
|---|---|---|---|---|---|
| Number | Total=100 | Number | Total=100 | ||
| 2010 | 2,945 | 457 | 15.5 | 2,488 | 84.5 |
| 2011 | 2,994 | 465 | 15.5 | 2,529 | 84.5 |
| 2012 | 3,306 | 509 | 15.4 | 2,797 | 84.6 |
| 2013 | 3,094 | 471 | 15.2 | 2,623 | 84.8 |
| 2014 | 3,111 | 439 | 14.1 | 2,672 | 85.9 |
| 2015 | 3,215 | 528 | 16.4 | 2,687 | 83.6 |
| 2016 | 2,787 | 512 | 18.4 | 2,275 | 81.6 |
| 2017 | 2,865 | 495 | 17.3 | 2,370 | 82.7 |
| 2018 | 2,921 | 511 | 17.5 | 2,410 | 82.5 |
| 2019 | 2,714 | 420 | 15.5 | 2,294 | 84.5 |
| 2020 | 4,802 | 811 | 16.9 | 3,991 | 83.1 |
| 2021 | 4,393 | 628 | 14.3 | 3,765 | 85.7 |
| 2022 | 4,556 | 1,028 | 22.6 | 3,528 | 77.4 |