

Table 1
Selected scenarios
| Scenarios | CO2 tax | Coal-based electricity production | No restrictions for other energy resources | Other energy mix restrictions |
|---|---|---|---|---|
| BAU | Yes | No limits (coal = 91%) | Yes | No (gas = 3% oil = 2% biomass = 2% hydro = 1% wind = 0.3% other = 0.9%) |
| Coal | Yes | Fixed at the 2019 level | Yes | No |
| coal_0 | No | Fixed at the 2019 level | Yes | No |
| mix_biomass | Yes | Exogenous decrease in 2024 and 2030 | No | Exogenous increase of biomass-based electricity to reach 23% in 2030 |
| mix_wind | Yes | Exogenous decrease in 2024 and 2030 | No | Exogenous increase of wind-based electricity to reach 23% in 2030 |
[i] BAU, business-as-usual.
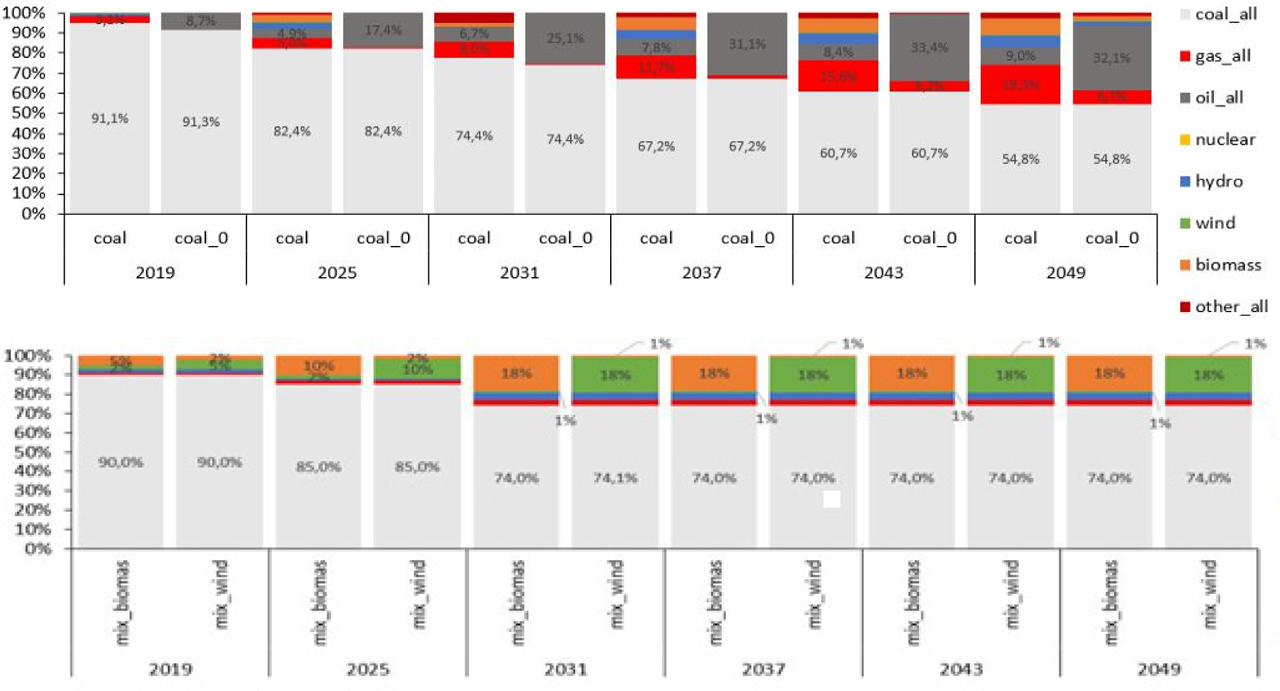
Figure 1
Electricity production structure
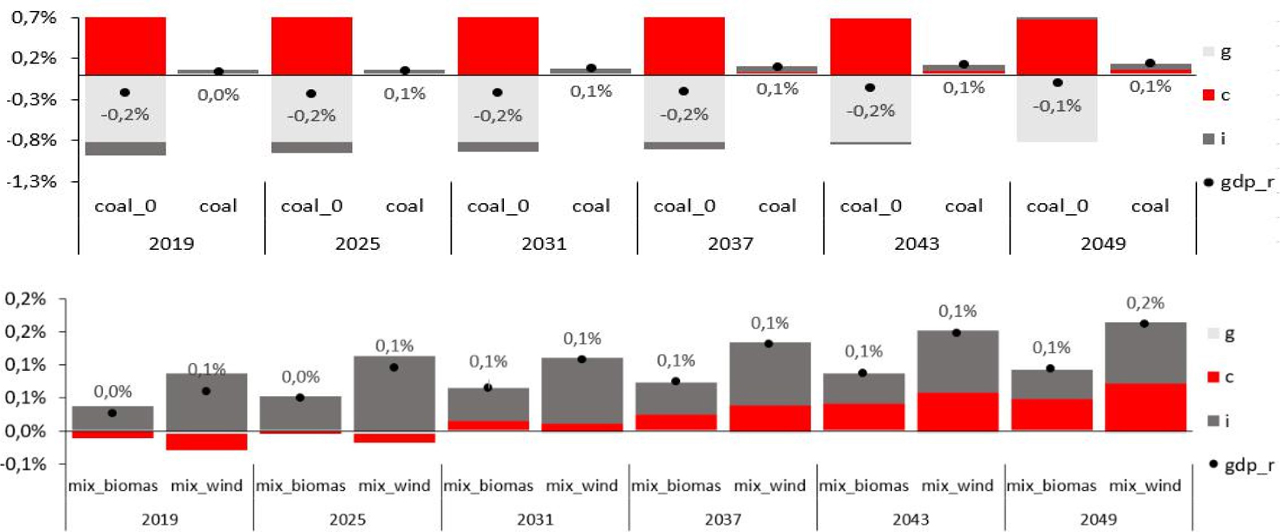
Figure 2
Macroeconomic indicators change in relation to BAU (g – public consumption, c-private consumption, i – investment, gdp_r – real GDP). BAU, business-as-usual; GDP, gross domestic product