

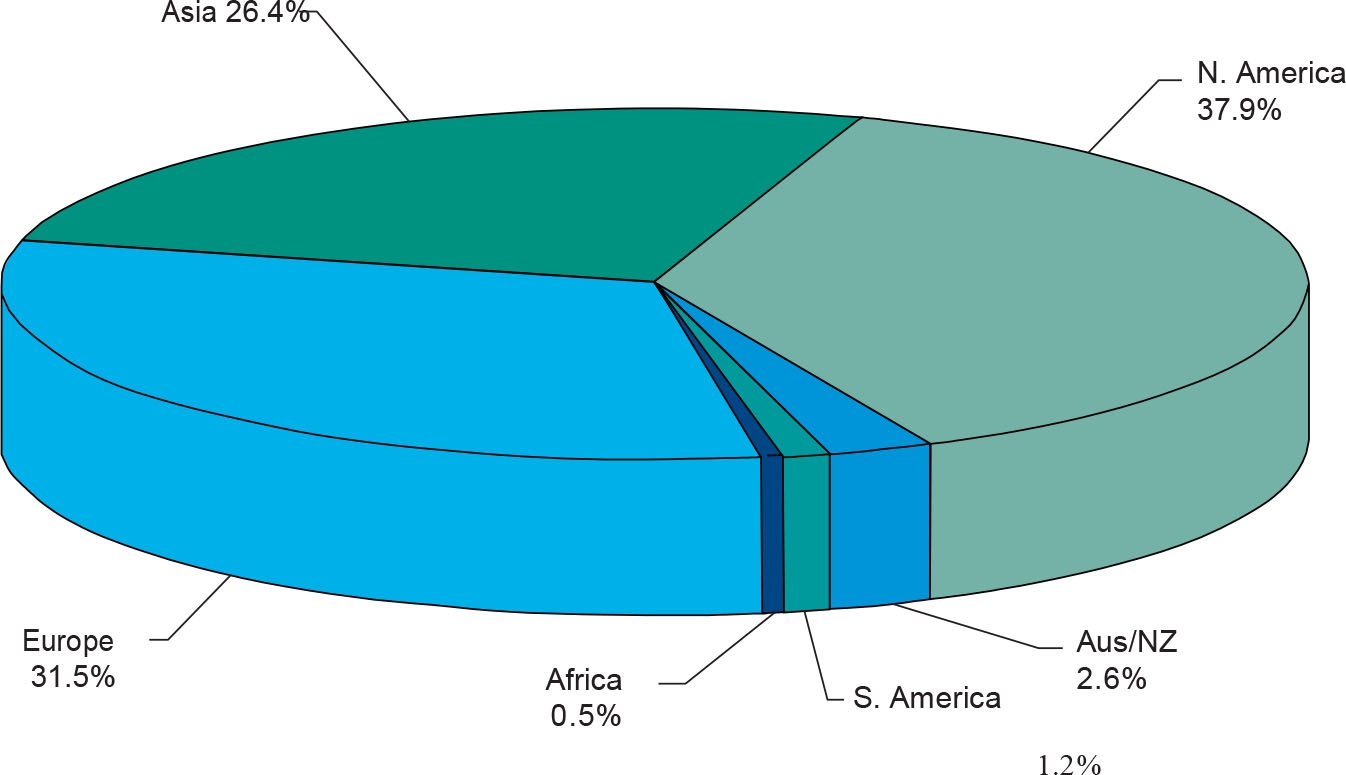
Graph 1
Volume of leasing use. Source: White Clarke Group, Leasing Report 2016.
Table 1
Variables used in quantitative research.
| Variable | Conceptualisation and operationalisation of the variable | Measurement method and transformations |
|---|---|---|
| Leases | International Accounting Standards, IAS17 | Binary, 1 = firm used leasing, 0 = firm did not use leasing |
| Need for financing | Single-item measure that describes the experience of financing a business from others (never; only once at first; when I needed it, but only to relatives; whenever I needed it) | Scalar – indicates the frequency of business financing, 1 = very low to 4 = very high |
| Index of recognising the advantages of leasing |
| Index created from recoded elements as an ordinal variable (1 = not at all, 4 = very much agree) |
| Sectors | Production or services | Binary, 1 = production, 0 = services |
Note: Edited by the author.
Table 2
Factorial analysis – component matrix.
| Elements of index – knowing the advantages of leasing | Factors |
|---|---|
| Leasing other than credit removes the risk of the facility being outdated. | 0.659 |
| The legal consequences in case of bankruptcy are less with the leasing. | 0.724 |
| Lease terms are more favourable than credit. | 0.773 |
| Leasing contracts are generally less restrictive. | 0.771 |
| The advantage of taxation is the biggest advantage of leasing. | 0.698 |
| Leasing enables 100% down payment financing. | 0.474 |
| Contracting costs are lower in the case of leasing than credit. | 0.716 |
[i] Note: Edited by the author.