

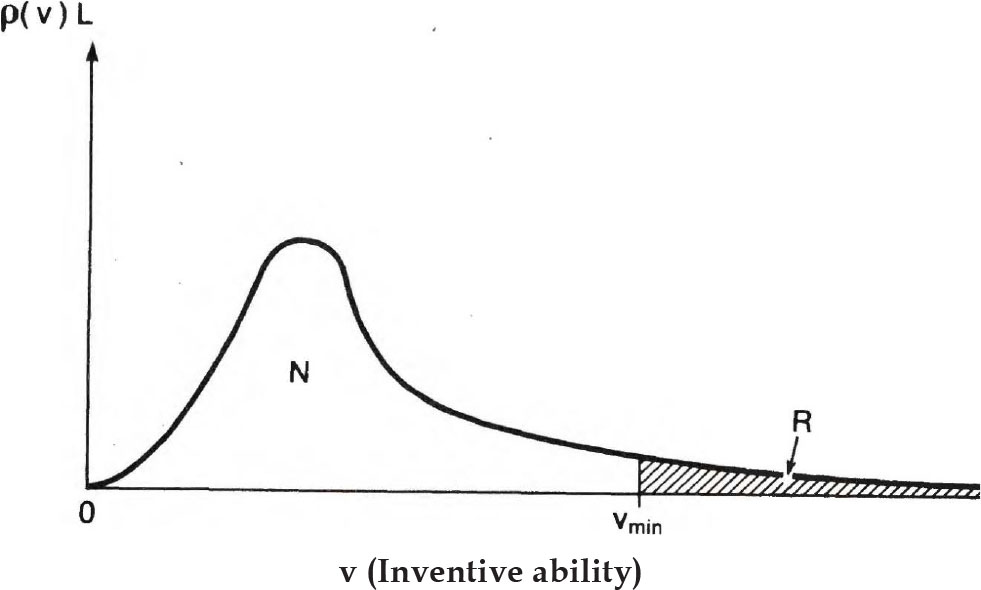
Fig. 1
The Distribution of the total working population N and R with respect to inventive ability v.
Tab. 1
The values of λ as implied by (25), given , n1, and R/N, and assuming that a =0. 2 and n = 0.7 per cent
| n1 (%) | λ | |||||
|---|---|---|---|---|---|---|
| R/N = 0.01 | R/N = 0.02 | R/N = 0.03 | R/N = 0.04 | R/N = 0.05 | ||
| 1 | 4 | 1.02 | 1.04 | 1.06 | 1.09 | 1.13 |
| 6 | 1.02 | 1.04 | 1.07 | 1.11 | 1.15 | |
| 8 | 1.02 | 1.04 | 1.07 | 1.12 | 1.19 | |
| 2 | 4 | 1.01 | 1.03 | 1.05 | 1.06 | 1.08 |
| 6 | 1.01 | 1.03 | 1.05 | 1.07 | 1.08 | |
| 8 | 1.01 | 1.03 | 1.05 | 1.07 | 1.10 | |
| 3 | 4 | 1.01 | 1.02 | 1.04 | 1.05 | 1.07 |
| 6 | 1.01 | 1.02 | 1.04 | 1.06 | 1.08 | |
| 8 | 1.01 | 1.02 | 1.04 | 1.06 | 1.09 | |
[i] Note: The values of λ are rounded to two decimal places.
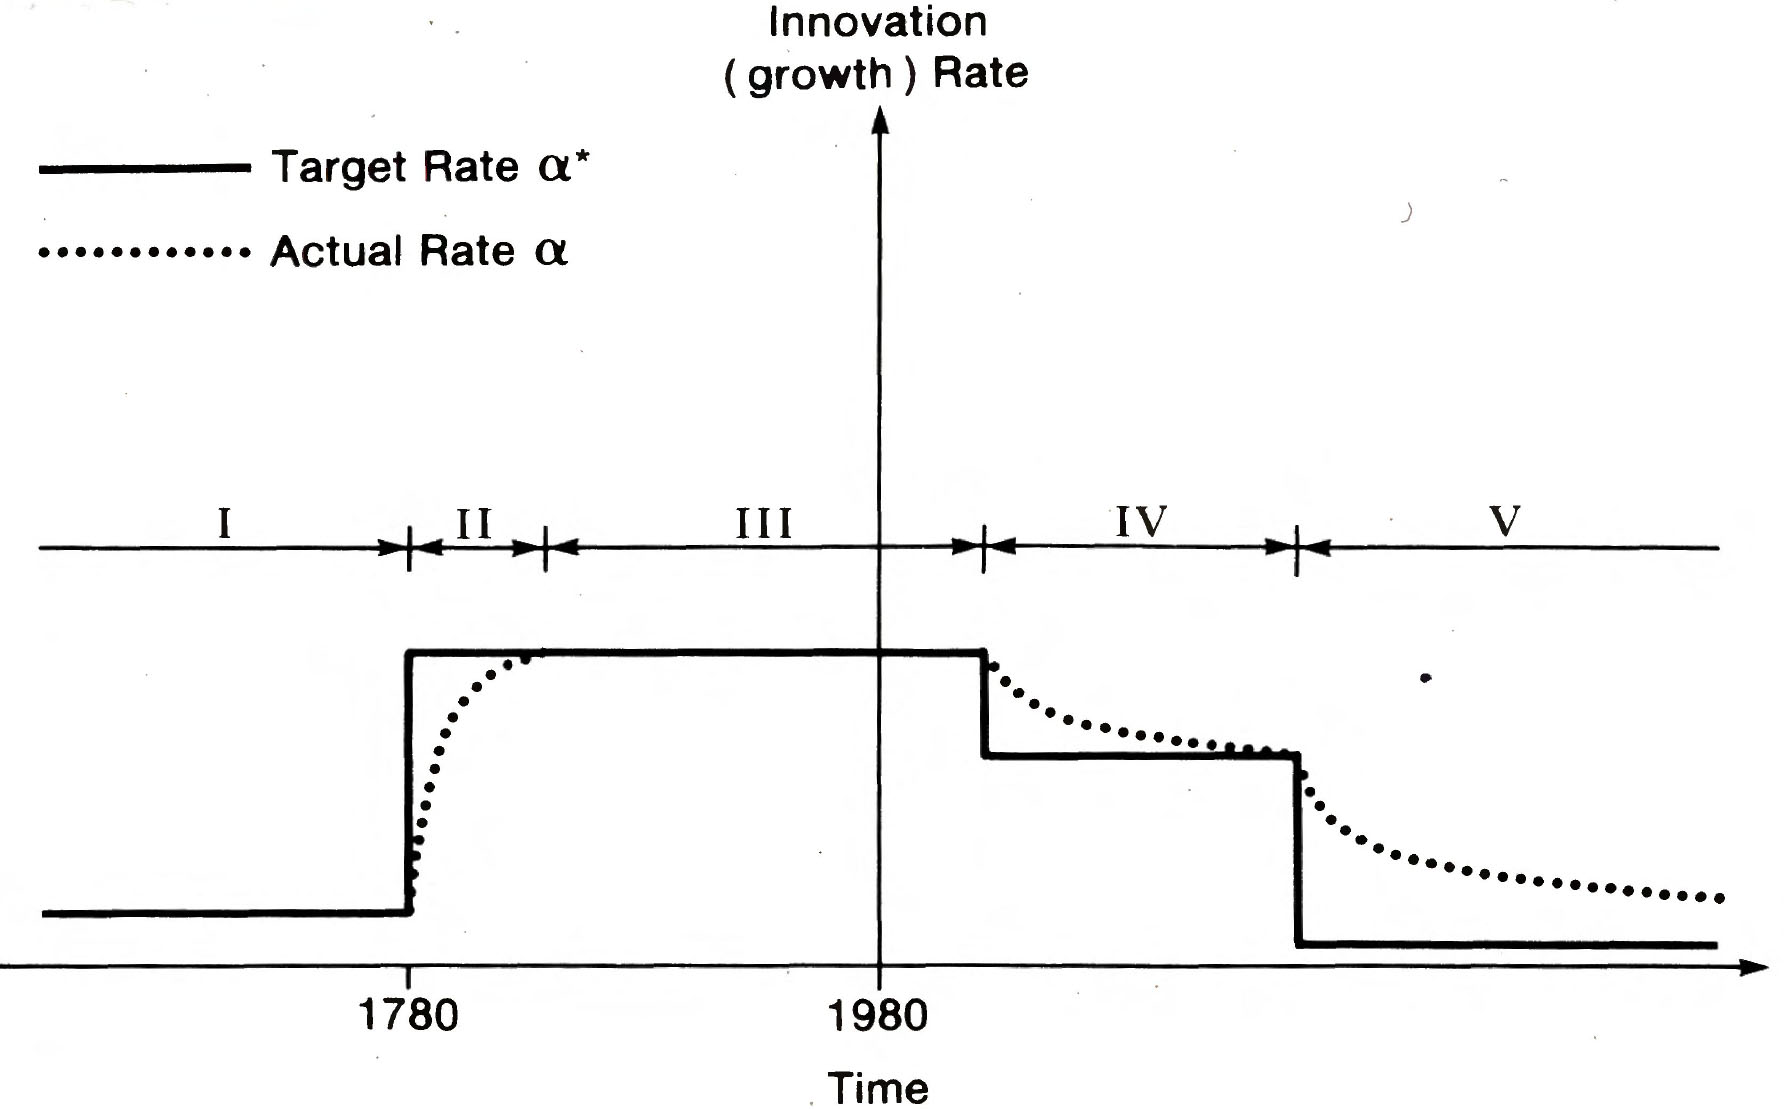
Fig. 2
The target and actual innovation rates over time in the TFA. The dates and magnitudes are chosen for illustrative purposes.