

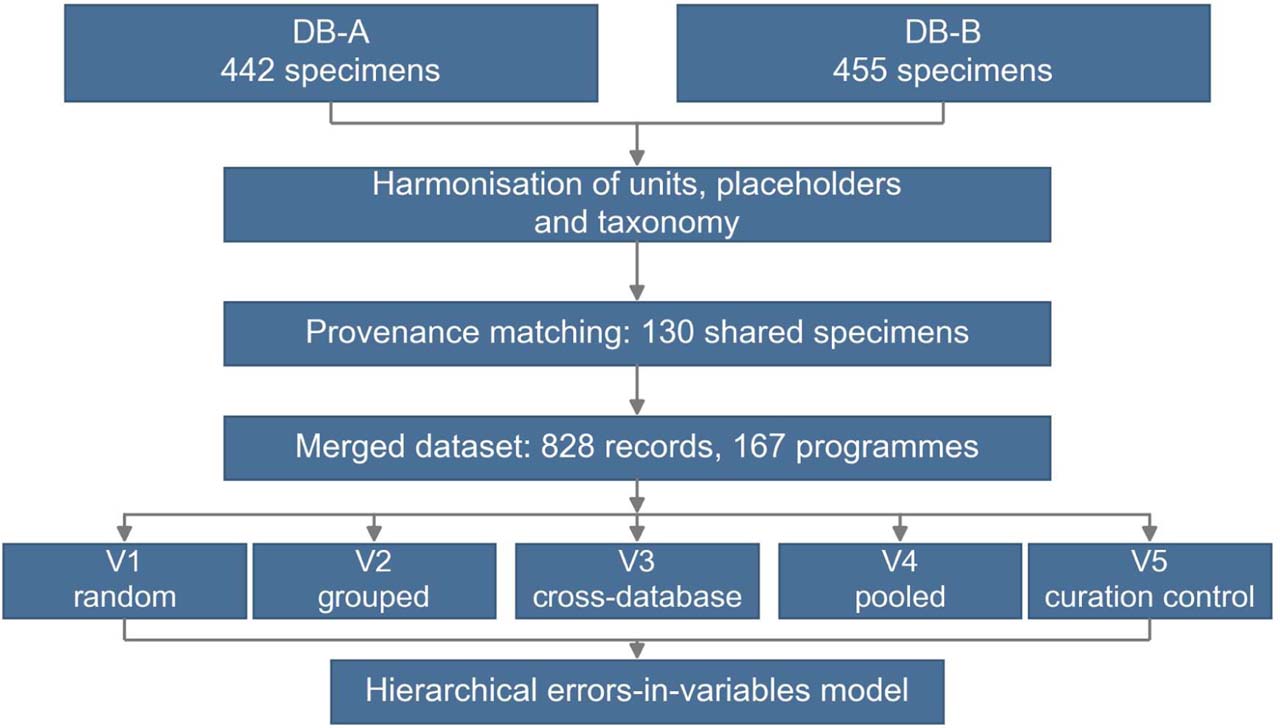
Figure 1:
Workflow of the study, from the two independently compiled source databases through harmonisation and provenance-based identification of shared specimens to the five validation regimes and the hierarchical errors-in-variables model
Table 1:
Specification of the two independently compiled databases as supplied
| Attribute | DB-A (Wang et al., 2023) | DB-B (Zhao et al., 2025) |
|---|---|---|
| Records as supplied [-] | 442 | 455 |
| Distinct source studies [-] | 99 (108 citations, 9 duplicated) | 59 |
| Publication span of sources [year] | 1992–2019 | 2002–2024 |
| Target quantity | Vf | Vu and Vf |
| Elastic modulus unit | [MPa] (raw sheet) | [GPa] |
| FRP ratio unit | decimal fraction [-] (raw sheet) | [%] |
| Concrete strength | fc | fck |
| Configuration coding | numeric code, undocumented | SB / U / FW |
| Missing-value encoding | blank | the string “/” |
| Fields unique to the source | h, flange geometry, failure mode, hfe | longitudinal steel, FRP material type |
Table 2:
Reconciliations applied when merging the two databases, with the number of records affected
| Issue | Treatment | Records affected [-] |
|---|---|---|
| Ef in [MPa] (DB-A) versus [GPa] (DB-B) | converted to [GPa] | 442 |
| ρf as fraction [-] (DB-A) versus per cent [%] (DB-B) | converted to [%] | 442 |
| Continuous-sheet placeholder wf = sf = 1 | ratio recovered from ρf; binary indicator added | 164 (A) + 153 (B) |
| wf/sf > 1 (overlapping strips, impossible) | retained and flagged, not altered | 15 (B) |
| Missing values encoded as “/” | coerced to missing | 57 in Vf, 192 in fyv (B) |
| Undocumented configuration code (DB-A) | recovered empirically (Section 3.3) | 442 |
| fyv absent where no stirrups are present | set to zero where ρsv = 0 | — |
| Records with no reported target | excluded | 57 |
| Exact numeric duplicates within a database | excluded | 12 |
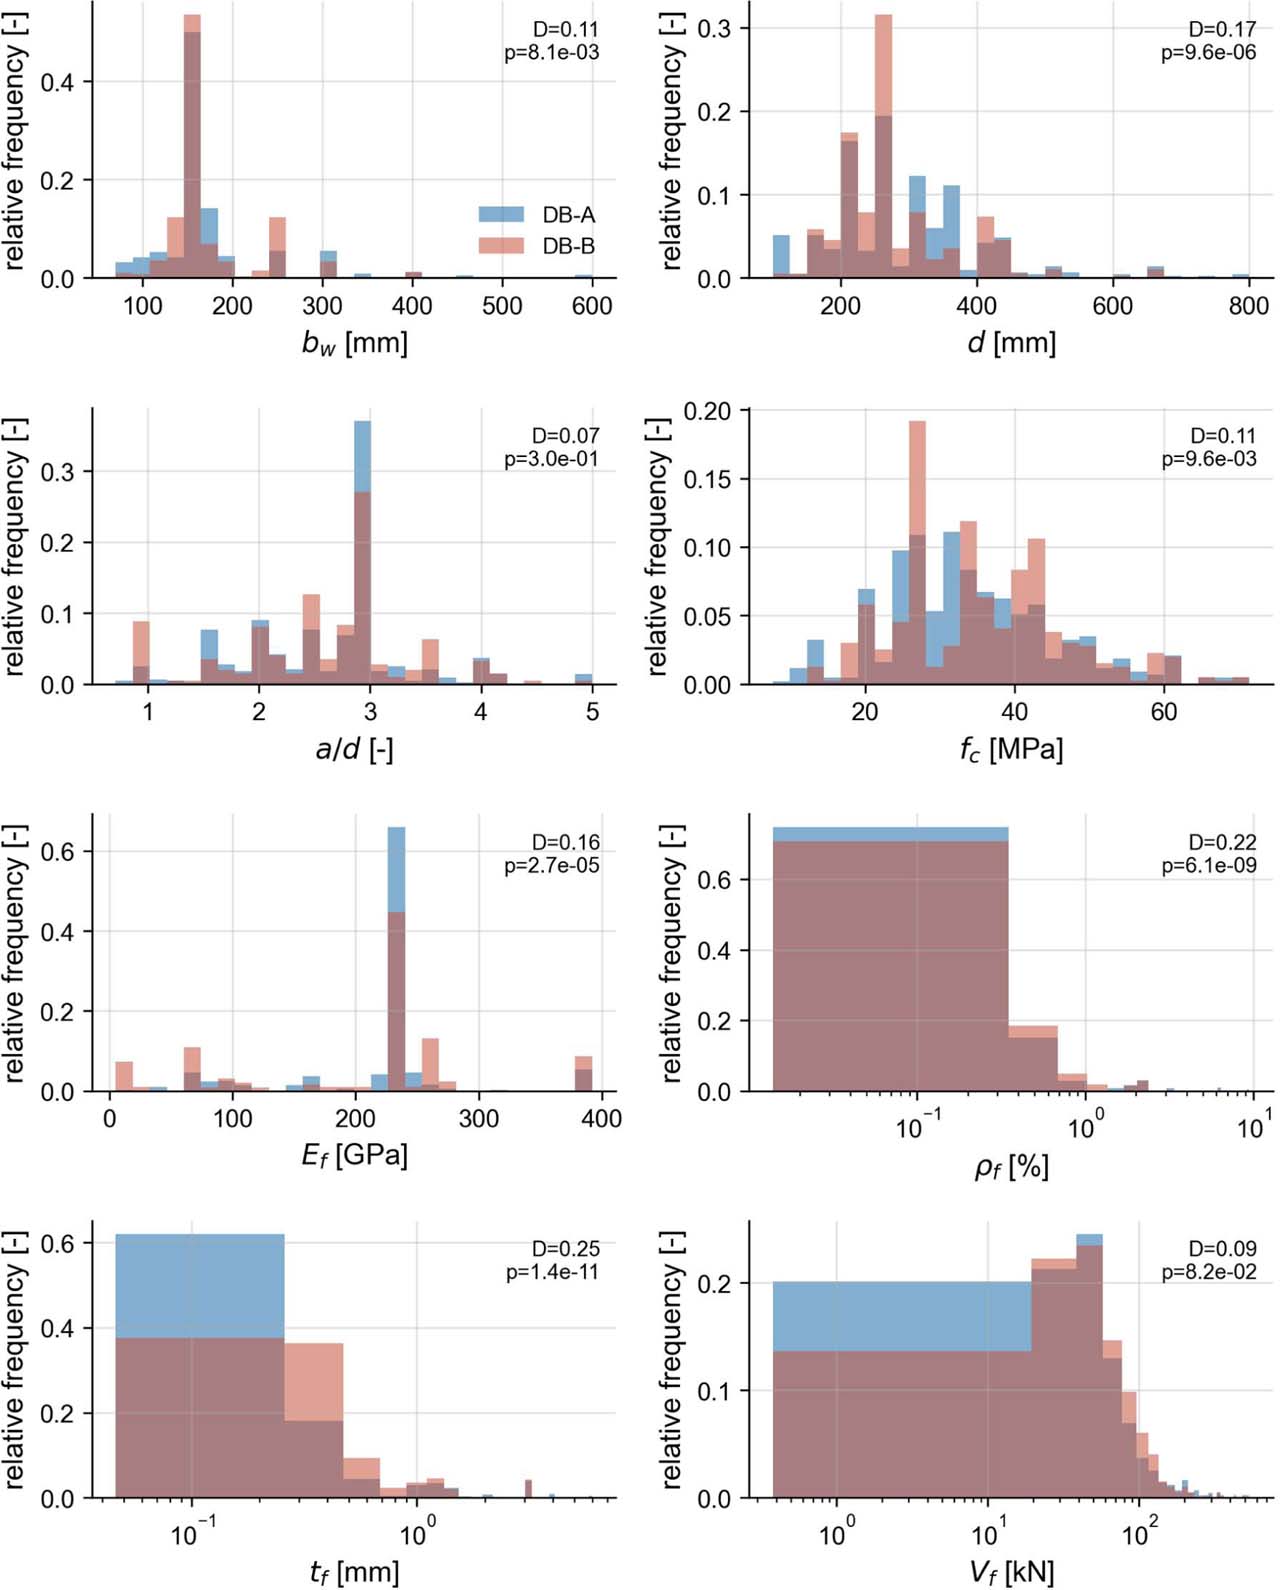
Figure 2:
Marginal distributions of the harmonised variables in the two compilations, with two-sample Kolmogorov–Smirnov statistics and p-values; the target and the shear span-to-depth ratio are the only quantities not differing significantly
Table 3:
Agreement between the two compilations on the 130 specimens common to both
| Quantity | n [-] | Identical [%] | Median rel. diff. [%] | 90th pct rel. diff. [%] | log-scale SD [-] |
|---|---|---|---|---|---|
| tf [mm] | 130 | 100.0 | 0.00 | 0.00 | 0.000 |
| bw [mm] | 130 | 96.9 | 0.00 | 0.00 | 0.001 |
| ffu [MPa] | 130 | 96.9 | 0.00 | 0.00 | 0.000 |
| Ef [GPa] | 130 | 89.2 | 0.00 | 2.13 | 0.241 |
| Vf (target) [kN] | 128 | 84.4 | 0.00 | 0.60 | 0.121 |
| d [mm] | 130 | 80.8 | 0.00 | 3.07 | 0.016 |
| fc vs fck [MPa] | 130 | 76.9 | 0.00 | 20.49 | 0.093 |
| a/d [-] | 130 | 73.1 | 0.00 | 4.29 | 0.069 |
| ρsv [%] | 52 | 63.5 | 0.00 | 15.72 | 0.053 |
| ρf [%] | 130 | 58.5 | 0.00 | 0.01 | 0.059 |
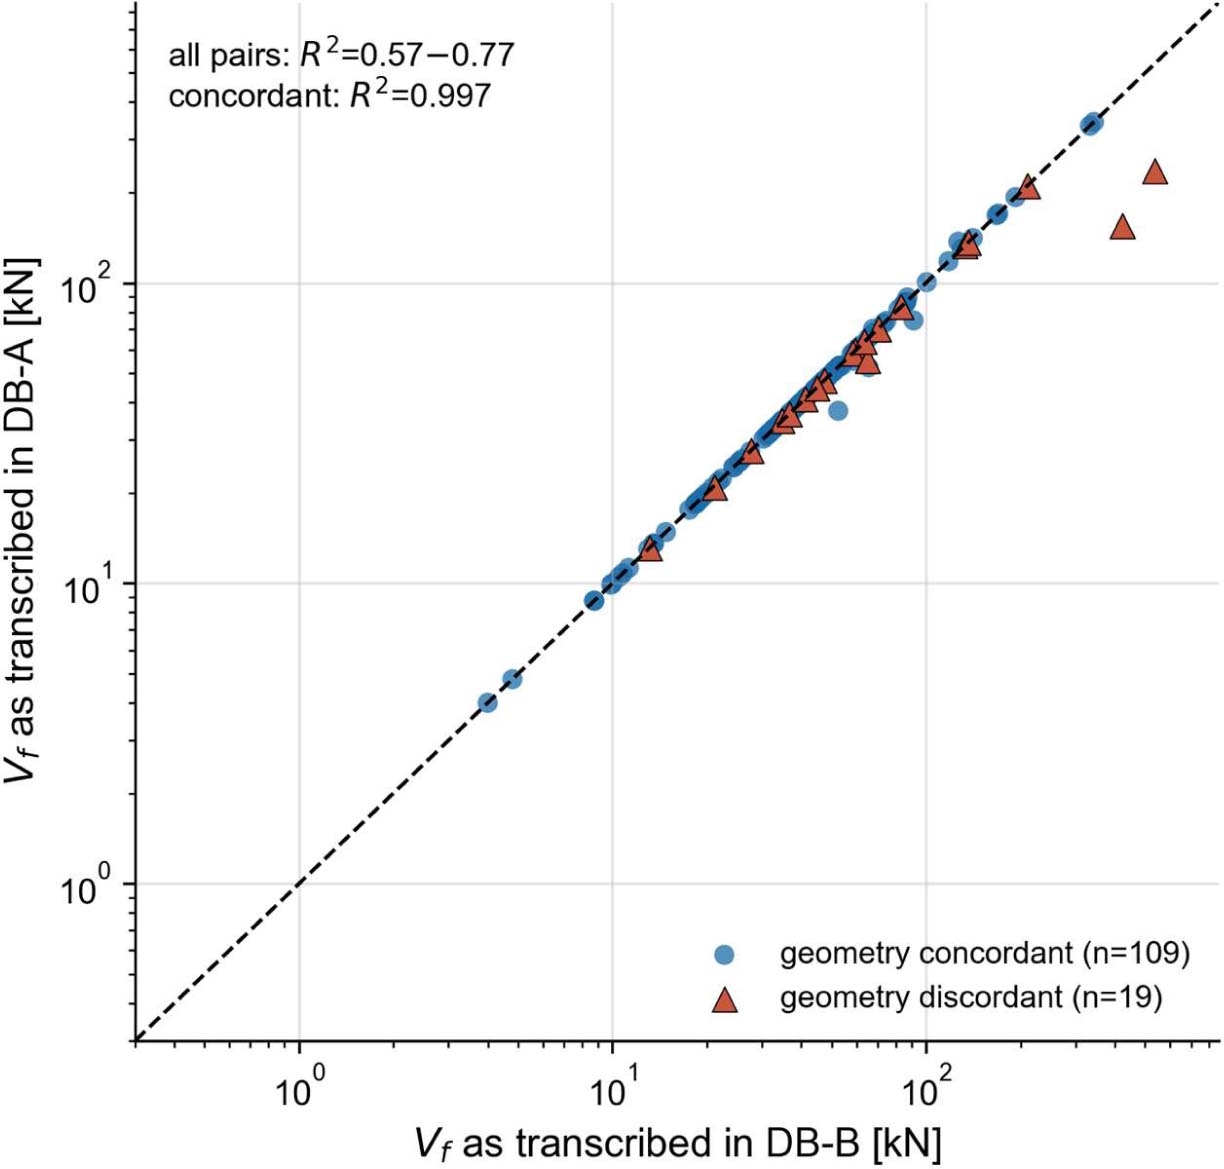
Figure 3:
The FRP shear contribution as transcribed in DB-A against the same physical specimen as transcribed in DB-B, separated by whether the two sources also agree on the identifying geometry; the broken line is equality
Table 4:
Coefficient of determination on the FRP shear contribution for each learner under each validation regime
| Regime [-] | Subset [-] | Ridge [-] | SVR [-] | MLP [-] | RF [-] | XGBoost [-] | XGB-mono [-] |
|---|---|---|---|---|---|---|---|
| V1 | DB-A | 0.540 | 0.549 | 0.558 | 0.591 | 0.672 | 0.665 |
| V1 | DB-B | 0.418 | 0.560 | 0.443 | 0.474 | 0.694 | 0.613 |
| V2 | DB-A | 0.433 | 0.270 | 0.511 | 0.451 | 0.391 | 0.379 |
| V2 | DB-B | 0.073 | 0.230 | 0.067 | 0.080 | 0.216 | 0.228 |
| V3 | A->B | 0.021 | 0.231 | 0.100 | 0.208 | 0.213 | 0.279 |
| V3 | B->A | −95.726 | 0.173 | −0.122 | 0.329 | 0.211 | 0.108 |
| V4 | merged | 0.411 | 0.377 | 0.446 | 0.457 | 0.449 | 0.465 |
| V5 | curation A | 0.013 | 0.398 | 0.370 | 0.316 | 0.348 | 0.454 |
| V5 | curation B | 0.223 | 0.273 | 0.302 | 0.321 | 0.372 | 0.417 |
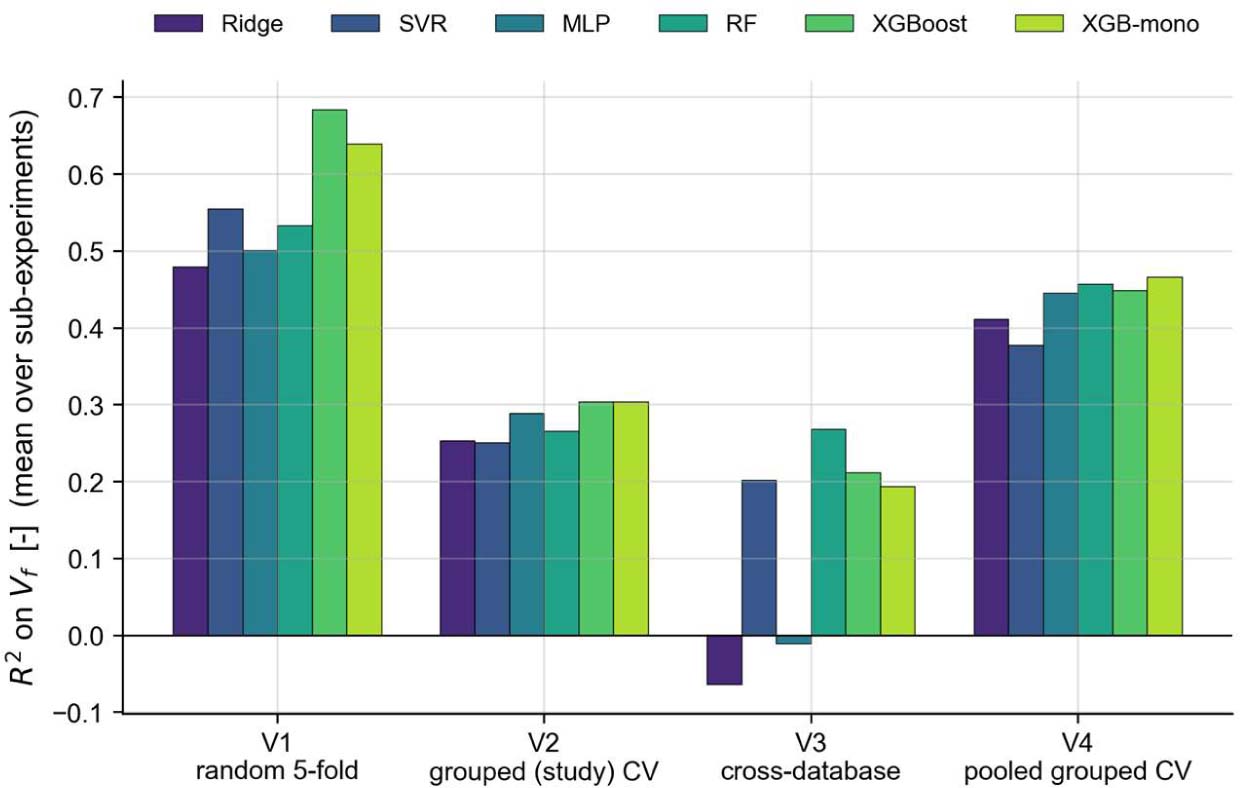
Figure 4:
Coefficient of determination by learner and validation regime, averaged over the sub-experiments of each regime and truncated below at −0.15 for legibility
Table 5:
Design-relevant statistics for the gradient boosting model by regime
| Regime [-] | Subset [-] | R2 [-] | Mean ratio [-] | CoV [-] | Unconservative [%] | n [-] |
|---|---|---|---|---|---|---|
| V1 | DB-A | 0.672 | 1.136 | 0.912 | 43.9 | 432 |
| V1 | DB-B | 0.694 | 1.108 | 0.623 | 45.6 | 396 |
| V2 | DB-A | 0.391 | 1.176 | 0.785 | 44.6 | 432 |
| V2 | DB-B | 0.216 | 1.236 | 0.997 | 41.8 | 396 |
| V3 | A->B | 0.213 | 1.015 | 0.918 | 32.9 | 231 |
| V3 | B->A | 0.211 | 1.396 | 0.787 | 51.4 | 262 |
| V4 | merged | 0.449 | 1.162 | 0.770 | 46.2 | 828 |
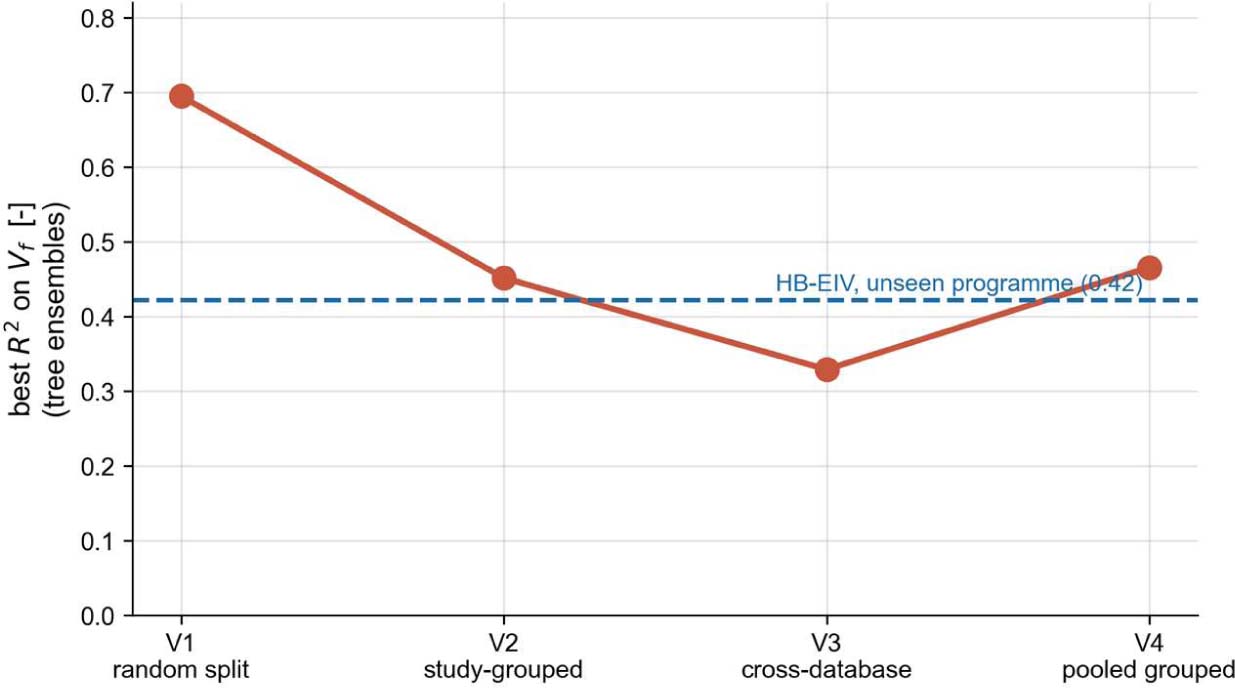
Figure 5:
Best coefficient of determination among the tree ensembles under each regime, with the hierarchical errors-in-variables model evaluated on unseen programmes shown for reference
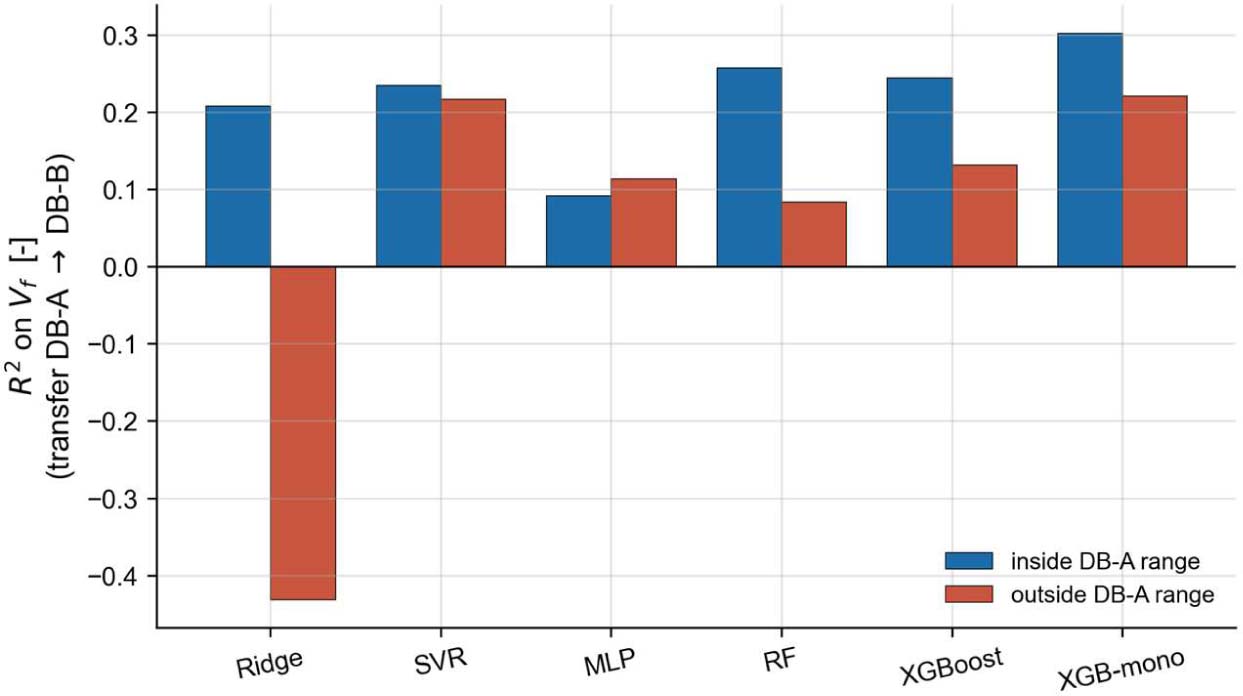
Figure 6:
Transfer performance from DB-A to DB-B separated by whether the test specimen lies inside the range of the training database on every covariate; values truncated below at −0.6 for legibility
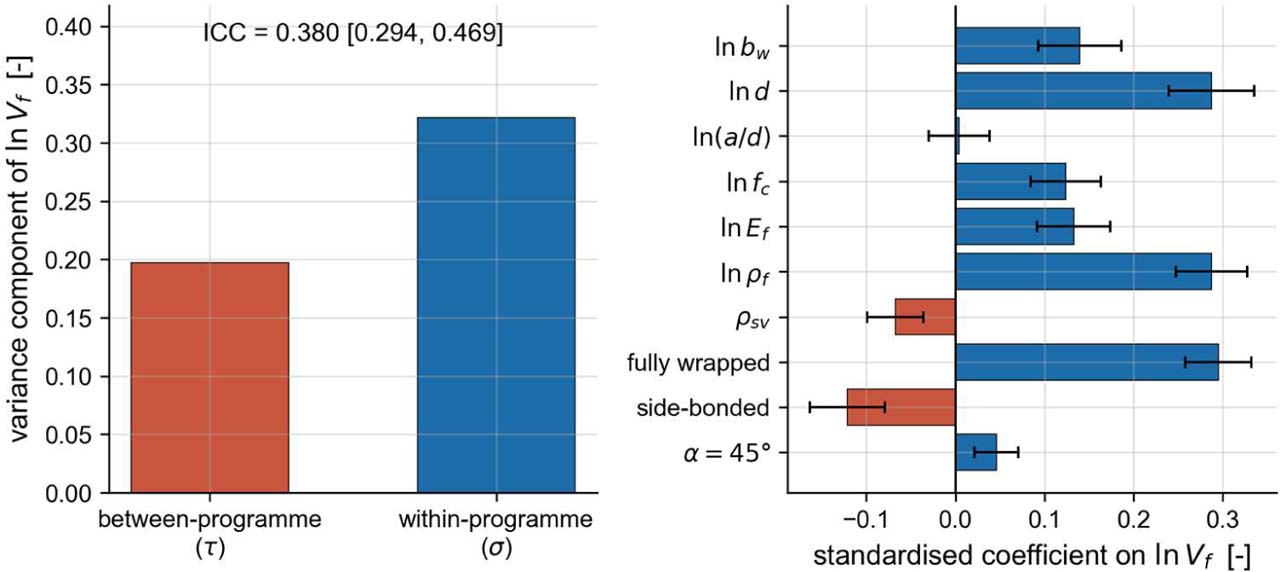
Figure 7:
Variance decomposition of the log FRP contribution into between-programme and within-programme components, and standardised posterior coefficients with one standard deviation; the intraclass correlation is given with its 95 per cent credible interval
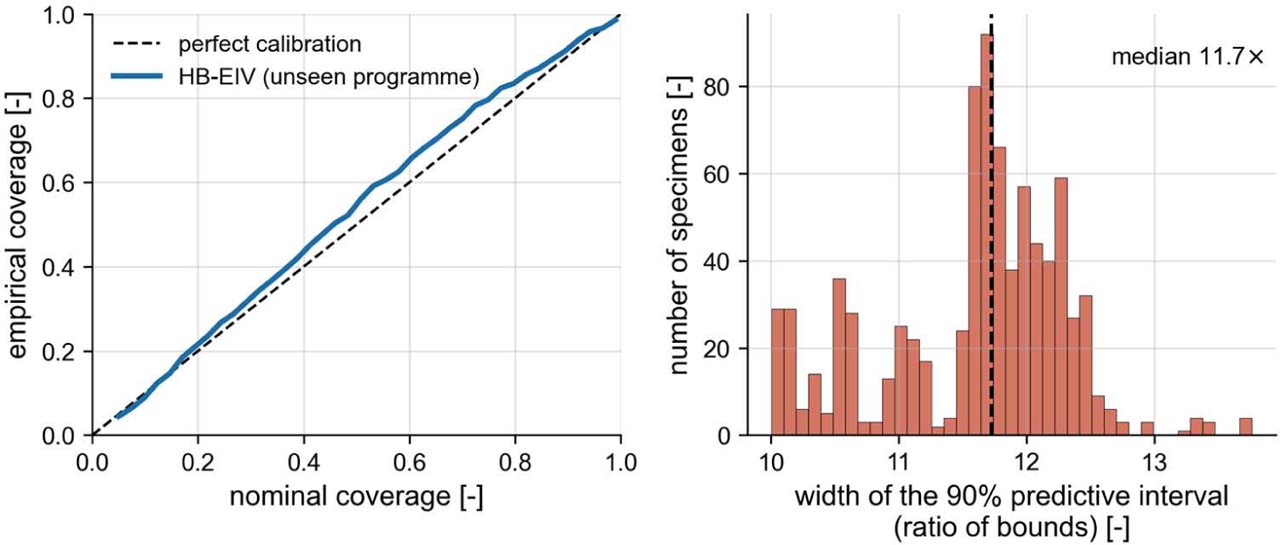
Figure 8:
Calibration of the hierarchical errors-in-variables model for unseen experimental programmes: empirical against nominal coverage, and the distribution of the width of the 90 per cent predictive interval expressed as the ratio of its bounds
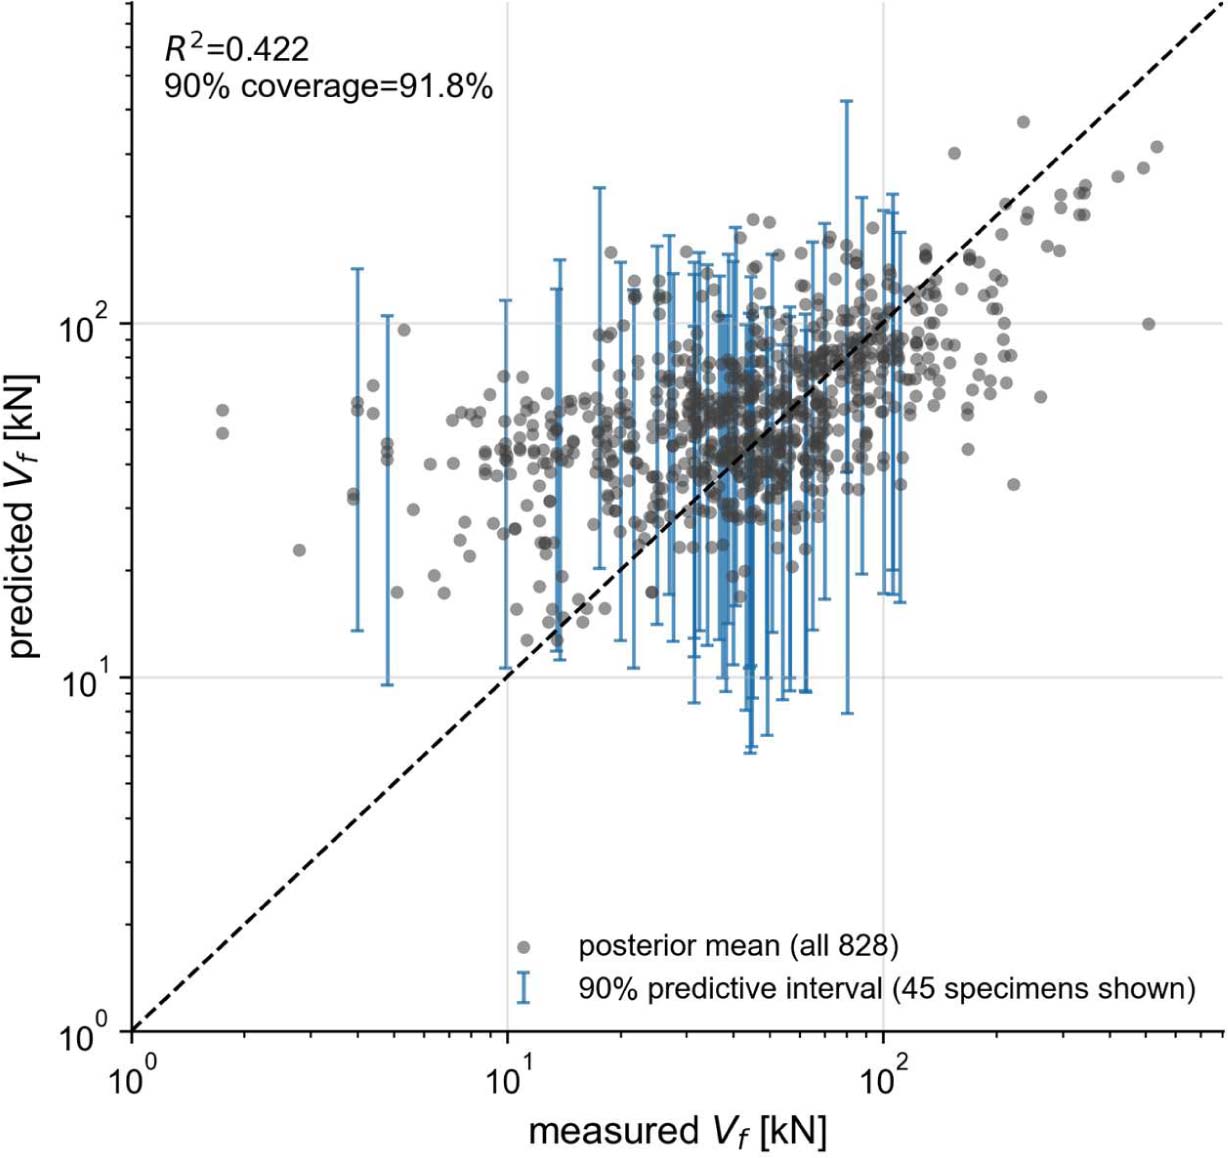
Figure 9:
Posterior mean prediction against measured FRP shear contribution for unseen experimental programmes, with the pointwise 90 per cent predictive interval; the broken line is equality
Table 6:
Coefficient of determination for the best fitted learner and for two unfitted design provisions
| Regime [-] | Best fitted learner [-] | ACI 440.2R-17 [-] | fib Bulletin 14 [-] |
|---|---|---|---|
| V1 | 0.694 | −0.601 | −0.240 |
| V2 | 0.451 | −0.601 | −0.240 |
| V3 | 0.329 | −0.881 | −0.547 |
| V4 | 0.465 | −0.678 | −0.261 |
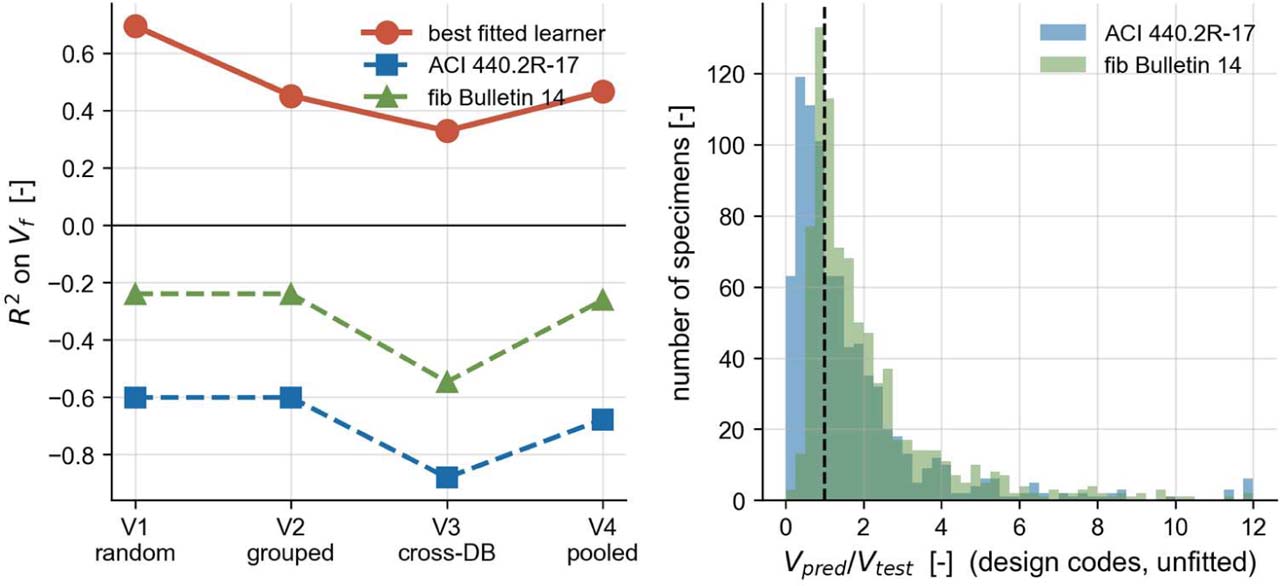
Figure 10:
Left: coefficient of determination for the best fitted learner and for two unfitted design provisions as the validation protocol tightens. Right: distribution of the ratio of predicted to measured contribution for the two provisions, truncated at twelve
Table 7:
Importance rank of each input when the same gradient boosting model is fitted to each database separately, ordered by rank on DB-A. A positive shift indicates a parameter ranked more highly on DB-B
| Input [-] | Rank (DB-A) [-] | Rank (DB-B) [-] | Shift [-] |
|---|---|---|---|
| d | 1 | 1 | +0 |
| fully wrapped | 2 | 2 | +0 |
| ρf | 3 | 4 | −1 |
| bw | 4 | 7 | −3 |
| wf/sf | 5 | 5 | +0 |
| fyv | 6 | 14 | −8 |
| a/d | 7 | 3 | +4 |
| ρsv | 8 | 8 | +0 |
| tf | 9 | 9 | +0 |
| ffu | 10 | 11 | −1 |
| fc | 11 | 6 | +5 |
| Ef | 12 | 12 | +0 |
| α | 13 | 13 | +0 |
| side-bonded | 14 | 10 | +4 |
| U-jacket | 15 | 16 | −1 |
| continuous sheet | 16 | 15 | +1 |
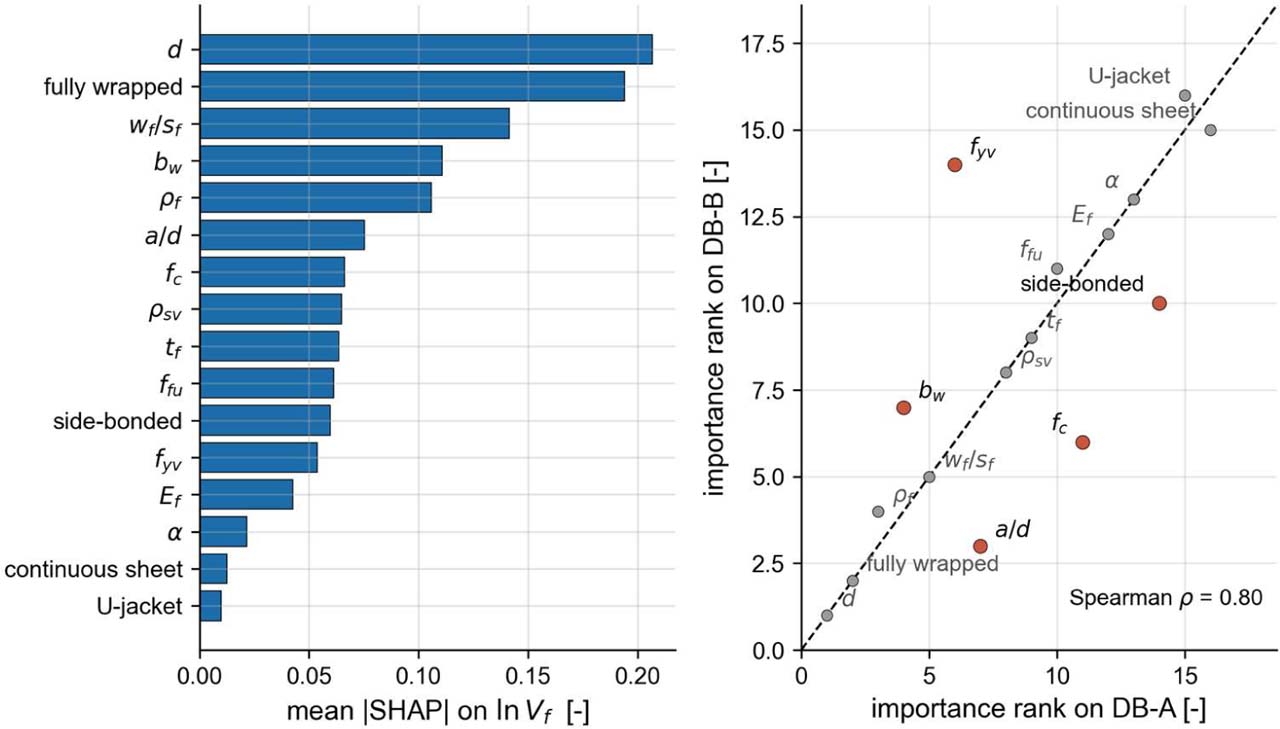
Figure 11:
Left: mean absolute SHAP value for the pooled model under study-grouped validation. Right: importance rank of each input when the same learner is fitted to each database separately, rank 1 being the most influential; points displaced by three or more places are highlighted and the broken line is equality
Table 8:
Proposed reporting protocol for data-driven studies of FRP shear strengthening. Each item addresses a failure mode demonstrated in this paper
| Requirement | Purpose |
|---|---|
| Publish the specimen-to-study mapping | Enables grouped validation and re-analysis by others |
| Report study-grouped CV alongside any random-split figure | Removes leakage between sibling specimens of one programme |
| State the proportion of the evaluation set outside the training range | Model behaviour differs qualitatively across that boundary (Section 7.4) |
| Report predictive intervals and their empirical coverage | A point estimate conceals the uncertainty relevant to design |
| Report a characteristic (5th percentile) value | The quantity a design provision requires, unobtainable from a mean prediction |
| Benchmark against at least one unfitted design provision | Provides a protocol-invariant reference (Section 7.7) |
| Document units, placeholder codes and missing-value encodings | Each was capable of corrupting the merge silently (Table 2) |
| Demonstrate that importance rankings are stable across source literature | Mid-ranked parameters are compilation-dependent (Section 7.8) |
| Abbreviation | Definition |
|---|---|
| CoV | Coefficient of variation |
| CV | Cross-validation |
| DB-A | Database of Wang et al. (2023) |
| DB-B | Database of Zhao et al. (2025) |
| EIV | Errors-in-variables |
| FRP | Fibre-reinforced polymer |
| FW | Fully wrapped |
| HB-EIV | Hierarchical errors-in-variables model |
| ICC | Intraclass correlation coefficient |
| KS | Kolmogorov-Smirnov |
| MLP | Multilayer perceptron |
| ML | Machine learning |
| RC | Reinforced concrete |
| RF | Random forest |
| SB | Side-bonded |
| SVR | Support vector regression |
| U | U-jacketed |
| XGB | Extreme gradient boosting |
Table A1:
Independently verified source experimental programmes contributing specimens to the merged database. Full bibliographic details appear in the reference list
Table B1:
Convergence diagnostics for the hierarchical errors-in-variables sampler, from four chains of 4,000 retained draws after 1,500 burn-in iterations
| Parameter [-] | Mean [-] | SD [-] | R-hat [-] | ESS bulk [-] | ESS tail [-] | MCSE [-] |
|---|---|---|---|---|---|---|
| ln bw | +0.140 | 0.047 | 1.0009 | 3436 | 6001 | 0.0008 |
| ln d | +0.288 | 0.048 | 1.0004 | 3461 | 6747 | 0.0008 |
| ln ad | +0.004 | 0.034 | 1.0008 | 3877 | 6565 | 0.0005 |
| ln fc | +0.124 | 0.039 | 1.0015 | 2658 | 4661 | 0.0008 |
| ln Ef | +0.133 | 0.041 | 1.0025 | 2570 | 5839 | 0.0008 |
| ln rhof | +0.288 | 0.040 | 1.0007 | 3576 | 6730 | 0.0007 |
| rhosv | −0.067 | 0.032 | 1.0013 | 5029 | 8836 | 0.0004 |
| cfgFW | +0.295 | 0.037 | 1.0005 | 4155 | 6978 | 0.0006 |
| cfgSB | −0.121 | 0.042 | 1.0002 | 3896 | 6335 | 0.0007 |
| alpha=45 | +0.046 | 0.025 | 1.0001 | 10035 | 12976 | 0.0002 |
| tau | +0.444 | 0.038 | 1.0011 | 3372 | 6807 | 0.0007 |
| sigma | +0.567 | 0.017 | 1.0004 | 9001 | 13119 | 0.0002 |
| b0 | +3.766 | 0.043 | 1.0008 | 1977 | 3397 | 0.0010 |
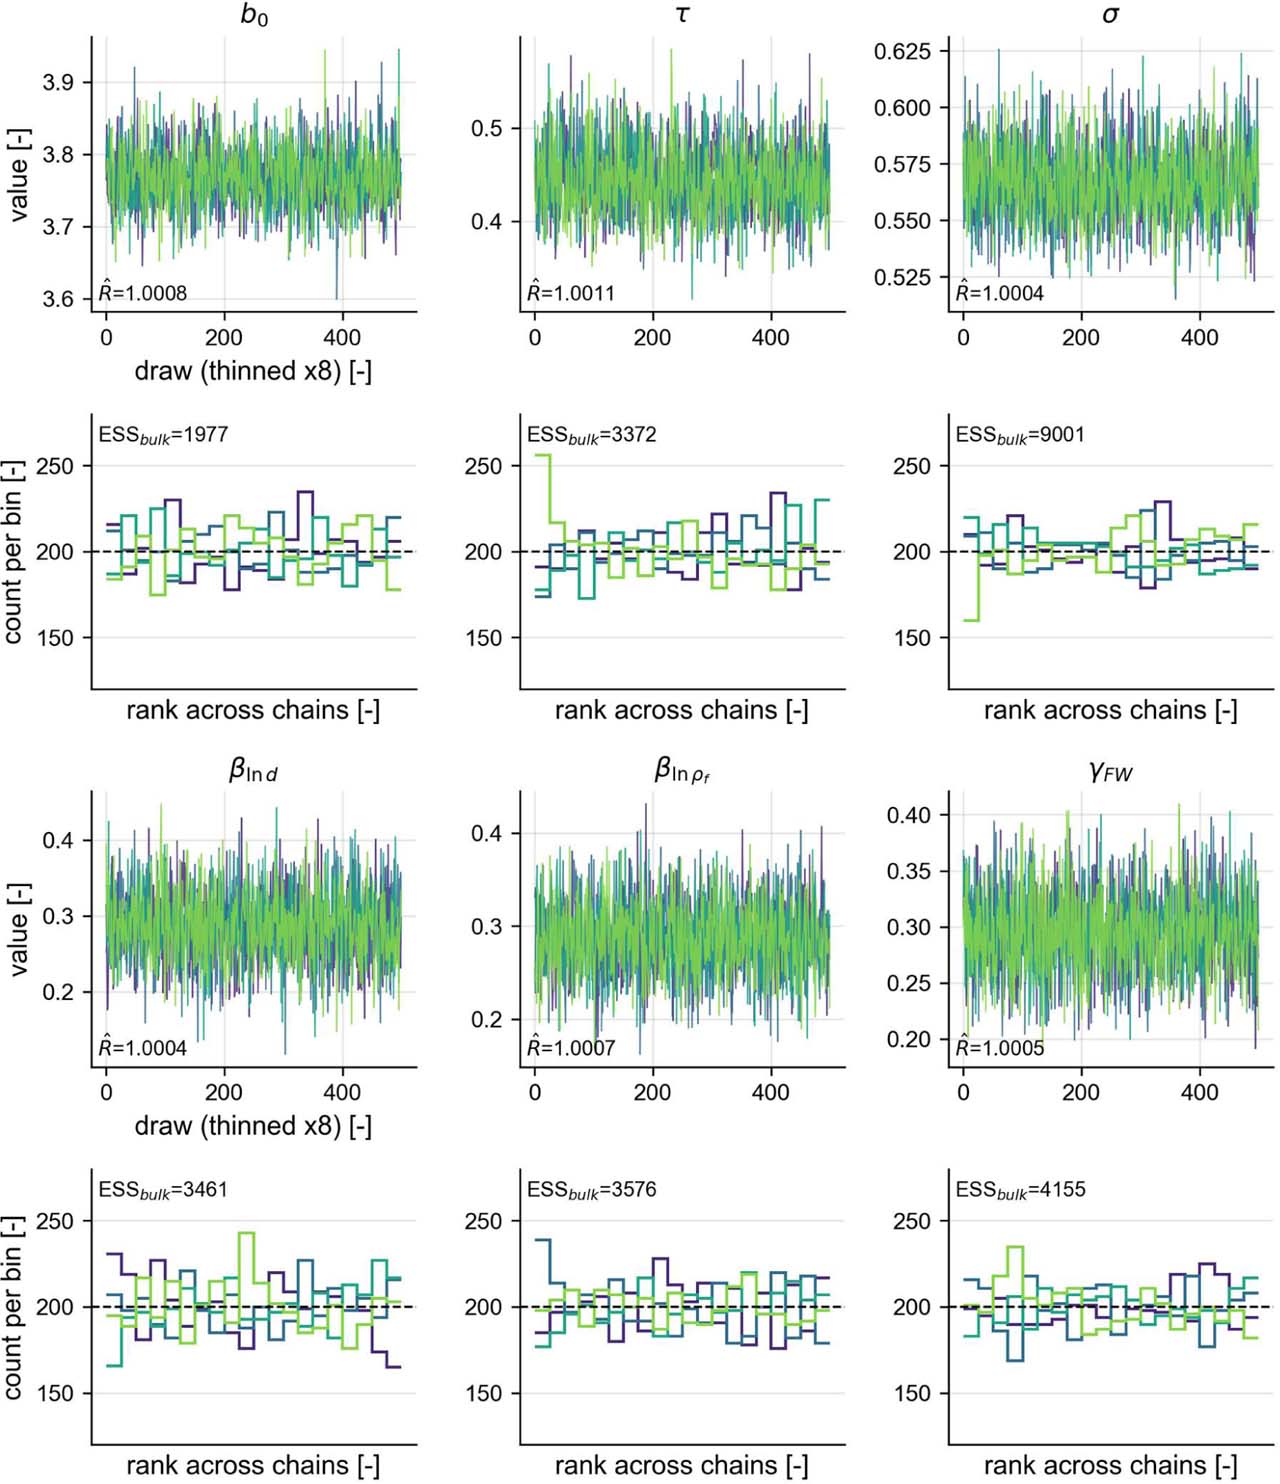
Figure 12:
Trace plot (upper panel of each pair) and rank histogram (lower panel of each pair) for the intercept, the two variance components and three representative coefficients; the broken line marks the count expected under uniformity
Table C1:
Coefficient of determination on the logarithmic scale, on which every model is fitted, for each learner under each validation regime
| Regime [-] | Subset [-] | Ridge [-] | SVR [-] | MLP [-] | RF [-] | XGBoost [-] | XGB-mono [-] |
|---|---|---|---|---|---|---|---|
| V1 | DB-A | 0.407 | 0.480 | 0.442 | 0.550 | 0.571 | 0.575 |
| V1 | DB-B | 0.250 | 0.371 | 0.269 | 0.373 | 0.382 | 0.363 |
| V2 | DB-A | 0.263 | 0.255 | 0.380 | 0.388 | 0.360 | 0.359 |
| V2 | DB-B | 0.063 | 0.083 | -0.036 | -0.100 | −0.465 | −0.551 |
| V3 | A->B | 0.150 | 0.182 | 0.200 | 0.141 | 0.128 | 0.121 |
| V3 | B->A | −0.223 | 0.304 | 0.044 | 0.290 | 0.256 | 0.200 |
| V4 | merged | 0.292 | 0.320 | 0.320 | 0.257 | 0.272 | 0.202 |
| V5 | curation A | −0.083 | 0.236 | 0.286 | 0.299 | 0.226 | 0.276 |
| V5 | curation B | −0.093 | 0.199 | 0.261 | 0.281 | 0.265 | 0.278 |