

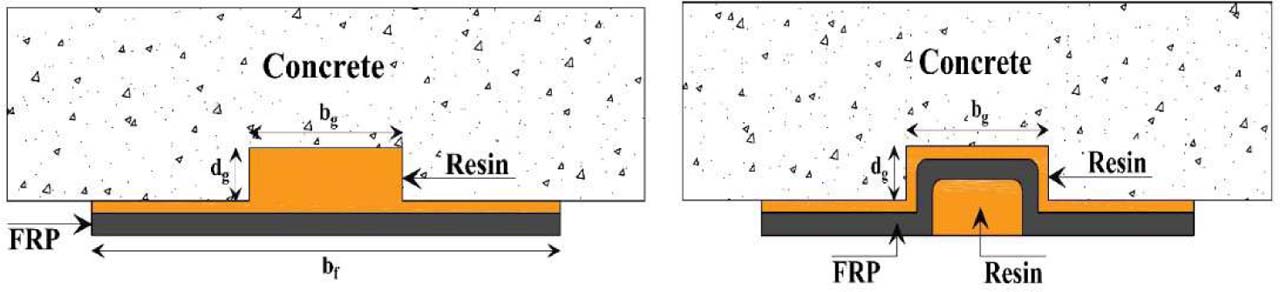
Figure 1:
Strengthening of RC beams by EBROG (Left) and EBRIG (right) techniques (Sanginabadi et al., 2022)
Table 1:
Steel and concrete properties
| Steel, conformation with BS 4449-16 | |||||||
| Diameter [mm] | Yield stress, Re [MPa] | Ultimate stress, Rm [MPa] | Rm/Re | Elongation [%] | |||
| 8 | 575 | 646 | 1.123 | 12.8 | |||
| Limits | 485 < Re < 650 | - | >1.06 | >4 | |||
| Concrete mix [kg/m3] | |||||||
| Cement | Fine aggregate | Coarse aggregate | Water | Viscocrete [5930] | |||
| 410 | 740 | 1035 | 170 | 3.28 | |||
| Concrete strength [MPa] | |||||||
| Sample 1 | Sample 2 | Sample 3 | Average | ||||
| 32.0 | 31.4 | 31.7 | 31.7 | ||||
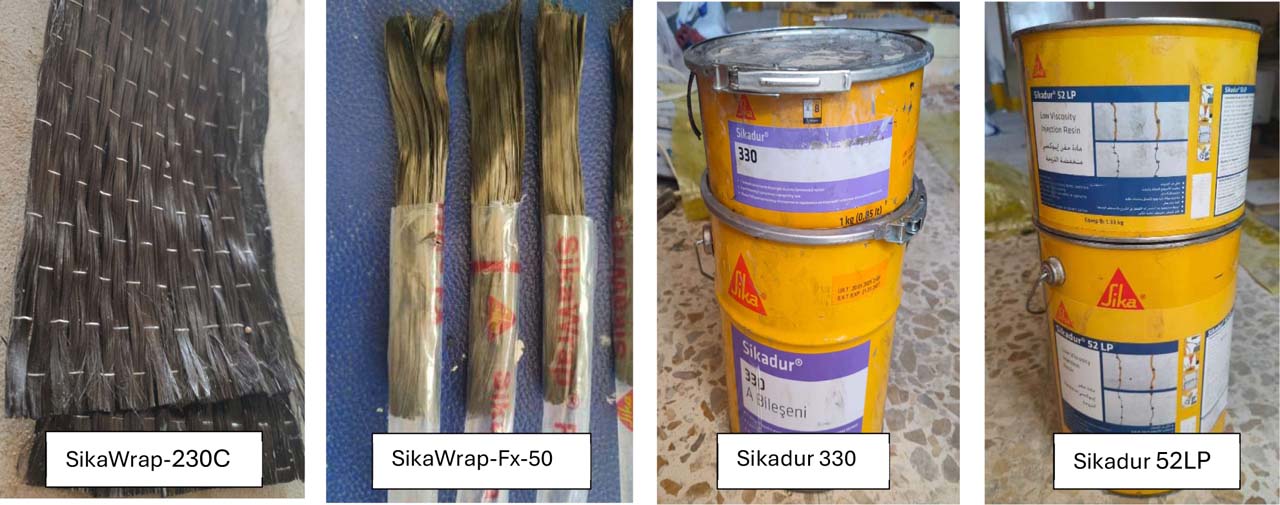
Figure 2:
Carbon fibre and epoxy materials used in this research
Table 2:
Technical properties of strengthening materials
| Material | Description | Property | Results⸸ |
|---|---|---|---|
| SikaWrap-230C | Unidirectional CFRP fabric | Thickness [mm] | 0.13 |
| Tensile modulus [MPa] | 238 × 103 | ||
| Elongation at break [%] | 1.8 | ||
| Tensile strength [MPa] | 4300 | ||
| Sikadur-330 @7 days, 30 ᵒC | Epoxy resin | Elastic modulus [MPa] | 3489 |
| Tensile strength [MPa] | 33.8 | ||
| Flexural strength [MPa] | 60.6 | ||
| Elongation at break [%] | 1.2 | ||
| SikaWrap Fx-50C | Unidirectional CFRP cord | Dry diameter [mm] | 6.0 |
| Impregnated diameter [mm] | 10.0 | ||
| Dry tensile strength [MPa] | 4000 | ||
| Impregnated tensile strength [MPa] | 2000 | ||
| Dry modulus of elasticity [MPa] | 240 × 103 | ||
| Impregnated modulus of elasticity [MPa] | 230 × 103 | ||
| Sikadur-52 LP @7 days, 30 ᵒC | Low-viscosity resin | Compressive strength [MPa] | ≥70.0 |
| Tensile strength [MPa] | 27.0 |
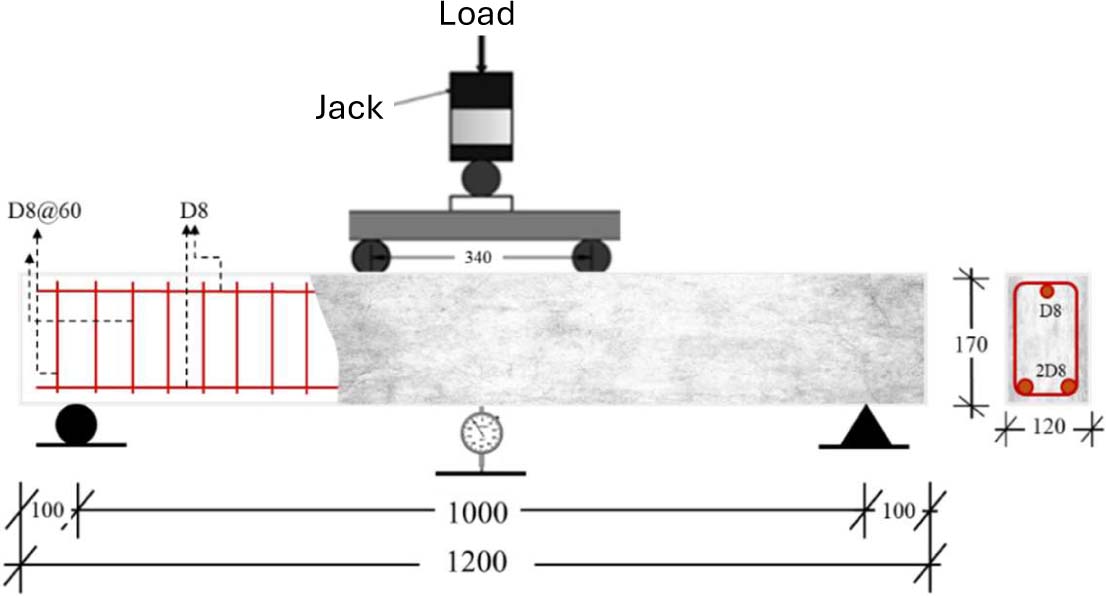
Figure 3:
Geometry and reinforcement details of the tested beams [Dimensions are in mm]
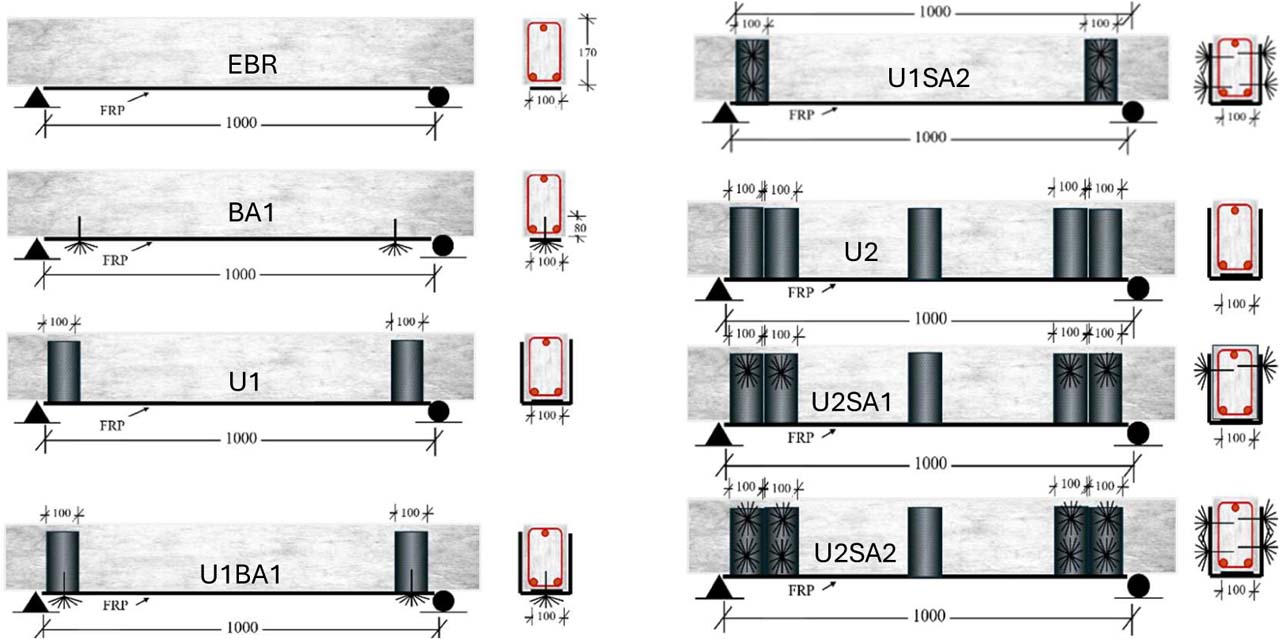
Figure 4:
Strengthening and anchoring configurations of beams in all groups
Table 3:
Strengthening and anchoring configurations of beam specimens
| Beam Description | Group | Beam | No. of U-wraps | No. of spike anchors | Intermediate U-wrap? | Orientation of spike snchors |
|---|---|---|---|---|---|---|
| Control beam (non-strengthened | CB | - | - | No | - | |
| Externally Bonded Reinforcement. | G1 | EBR | - | - | No | - |
| EBR with single bottom spike anchor at each en | BA1 | - | 2 | No | Vertical | |
| EBR with single end u-wrap at each end | U1 | 2 | - | No | - | |
| EBR with single end u-wrap and double side spike anchors at each end | G2 | U1SA2 | 2 | 8 | No | Lateral |
| EBR with single end u-wrap and single bottom spike anchor at each end | U1BA1 | 2 | 2 | No | Vertical | |
| EBR with double end u-wraps plus single intermediate u-wrap at each end | G3 | U2 | 4 | - | Yes | - |
| EBR with double end u-wraps plus single intermediate u-wrap and single side spike anchor for each wrap at each end | U2SA1 | 4 | 8 | Yes | Lateral | |
| EBR with double end u-wraps plus single intermediate u-wrap and double side spike anchors for each wrap at each end | U2SA2 | 4 | 16 | Yes | Lateral |
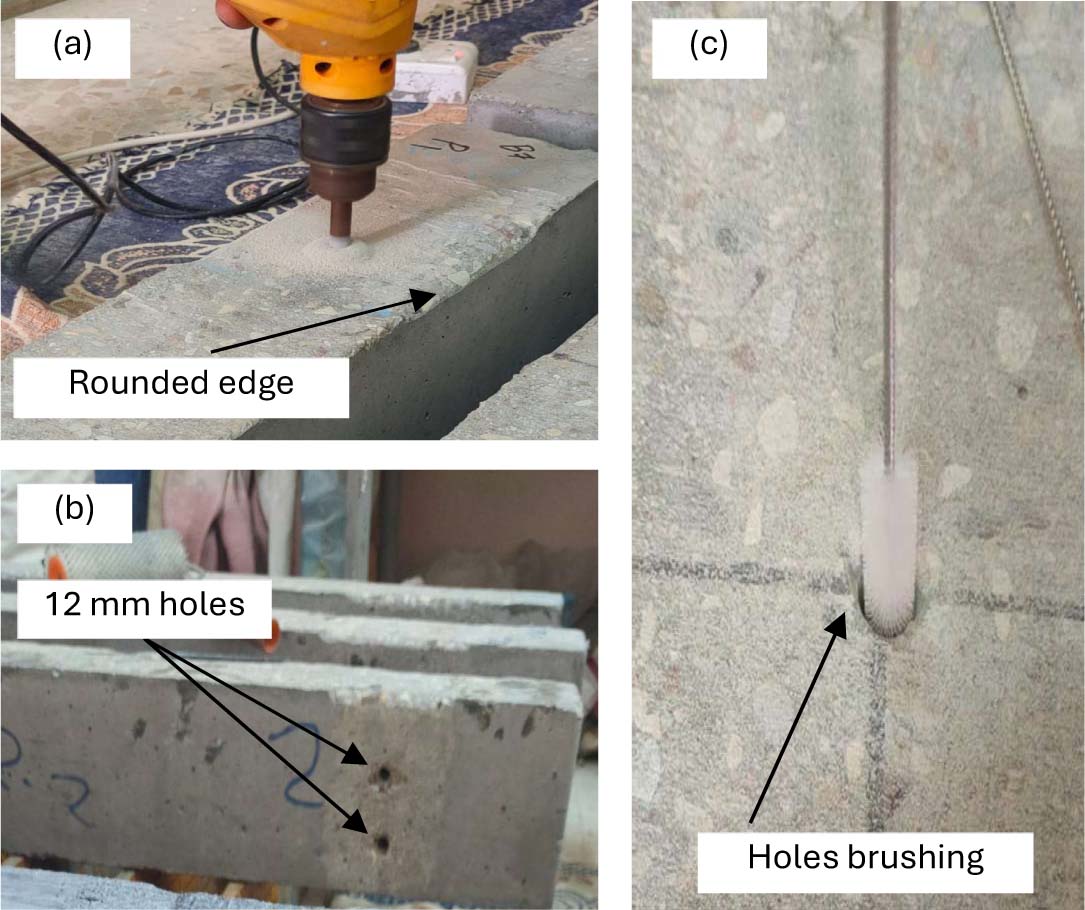
Figure 5:
(a) Holes drilling, (b) Surface preparation and (c) Holes brushing of the test specimens
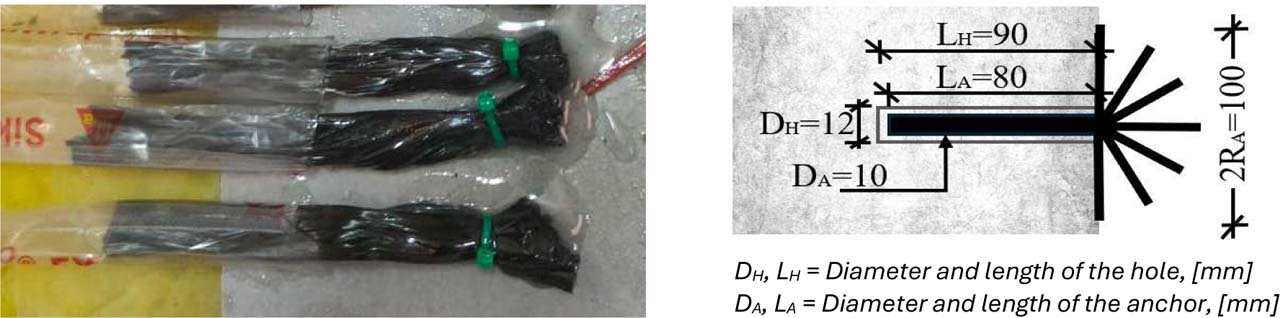
Figure 6:
Details of drilled holes and spike anchors used
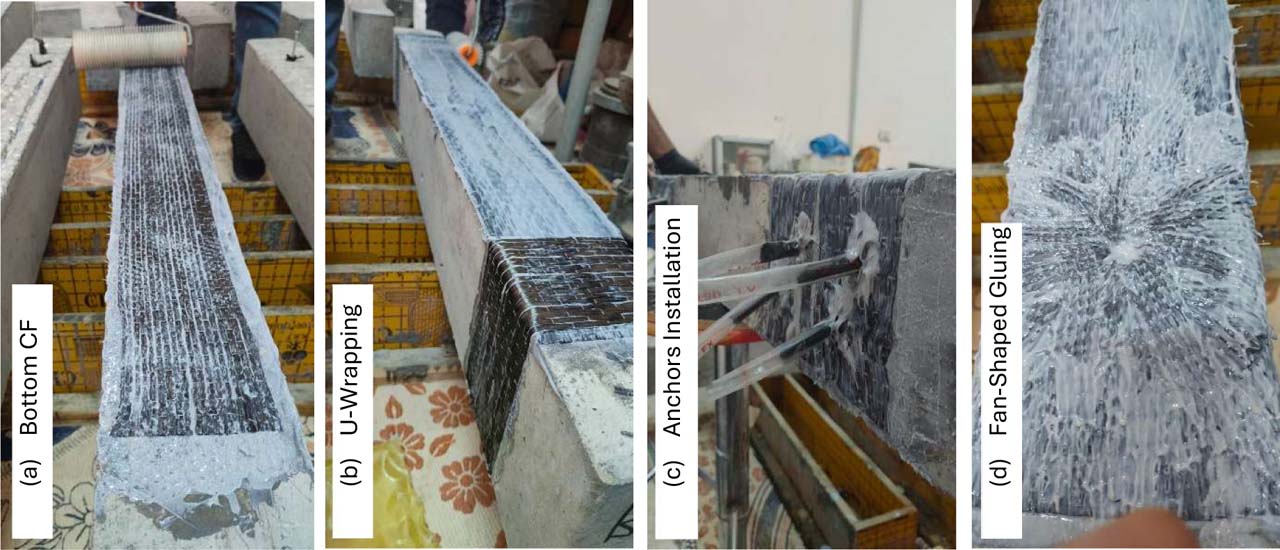
Figure 7:
Strengthening and anchoring test specimens using CF sheets, u-wrapping and spike anchors
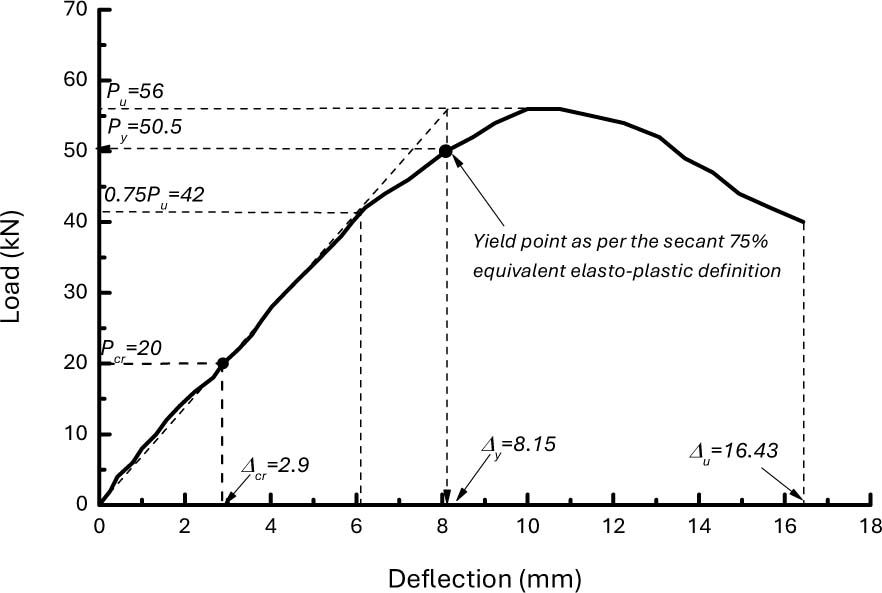
Figure 8:
Elasto-plastic definition of yielding, cracking and ultimate points of the CB sample
Table 8:
Critical loads and the corresponding deflections, and the percentages of increase / decrease
| Beam | Cracking load [kN] [%] | Cracking deflection [mm] [%] | Yielding load [kN] [%] | Yielding deflection [mm] [%] | Ultimate load [kN] [%] | Ultimate deflection [mm] [%] | Failure mode |
|---|---|---|---|---|---|---|---|
| CB | 20 [0.00] | 2.9 [0.00] | 50.5 [0.00] | 8.2 [0.00] | 56 [0.00] | 16.43 [0.00] | Flexural |
| EBR | 30 [50] | 3.5 [20.69] | 63 [24.75] | 9.1 [10.98] | 68 [21.43] | 10.86 [−33.90] | Debonding of CFRP |
| BA1 | 30 [50] | 3.66 [26.21] | 90 [78.22] | 10 [21.95] | 101.5 [81.25] | 13.6 [−17.22] | Rupture of CFRP |
| U1 | 36 [80] | 4 [37.93] | 69.5 [37.62] | 9.8 [19.51] | 78 [39.29] | 11.04 [−32.81] | Rupture of CFRP |
| U1SA2 | 54 [170] | 5.4 [86.21] | 92 [82.18] | 10.8 [31.71] | 103 [83.93] | 14.3 [−12.96] | Rupture of CFRP |
| U1BA1 | 36 [80] | 3.73 [28.62] | 92 [82.18] | 11.2 [36.59] | 104 [85.71] | 13.25 [−19.35] | Rupture of CFRP |
| U2 | 42 [110] | 3.67 [26.55] | 79 [56.44] | 8.4 [2.44] | 91 [62.50] | 11.56 [−29.64] | Rupture of CFRP |
| U2SA1 | 33 [65] | 3.7 [27.59] | 82 [62.38] | 11.8 [43.90] | 88 [57.14] | 13.04 [−20.63] | Rupture of CFRP |
| U2SA2 | 42 [110] | 3.8 [31.03] | 94 [86.14] | 10.2 [24.39] | 110 [96.43] | 12.65 [−23.01] | Rupture of CFRP |
Table 9:
Percentage increase/decrease of structural indices
| Beam | Ductility | [%] | Stiffness | [%] | Toughness | [%] |
|---|---|---|---|---|---|---|
| CB | 2.00 | 0.00 | 5.75 | 0.00 | 642 | 0.00 |
| EBR | 1.19 | −40.45 | 5.89 | 2.40 | 432 | −32.71 |
| BA1 | 1.36 | −32.14 | 9.46 | 64.45 | 865 | 34.74 |
| U1 | 1.13 | −43.79 | 5.78 | 0.37 | 490 | −23.68 |
| U1SA2 | 1.32 | −33.93 | 7.04 | 22.28 | 1047 | 63.08 |
| U1BA1 | 1.18 | −40.97 | 7.50 | 30.27 | 792 | 23.36 |
| U2 | 1.38 | −31.33 | 7.82 | 35.93 | 653 | 1.71 |
| U2SA1 | 1.11 | −44.86 | 6.05 | 5.12 | 670 | 4.36 |
| U2SA2 | 1.24 | −38.11 | 8.13 | 41.19 | 817 | 27.26 |
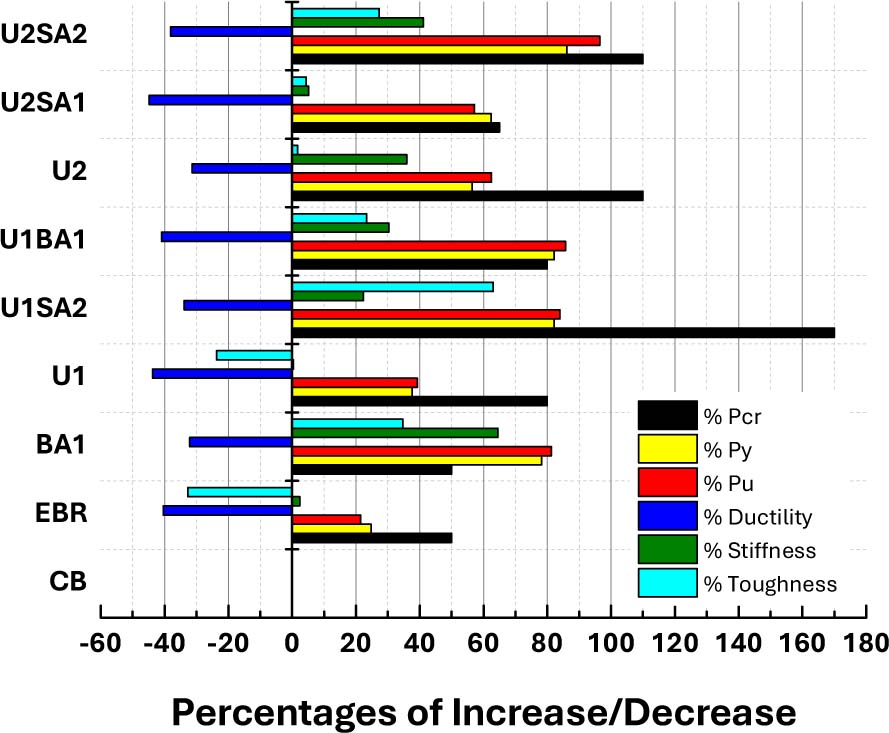
Figure 9:
Percentages increase/decrease of the critical loads and structural indices
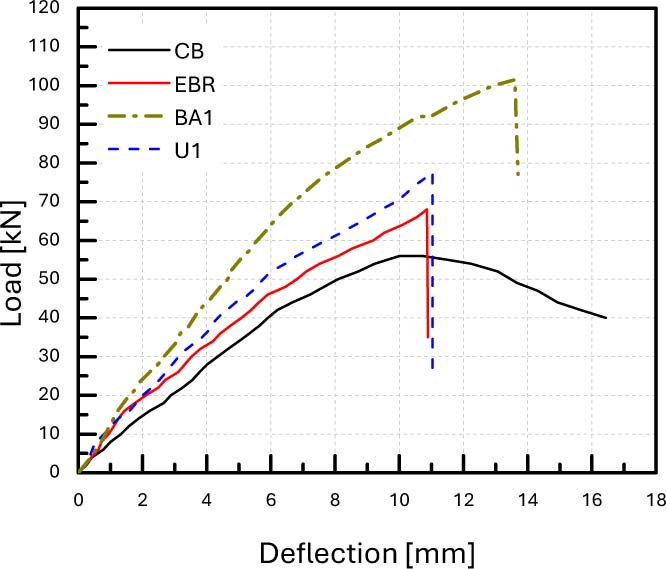
Figure 10:
Load-deflection curve of group G1 and CB
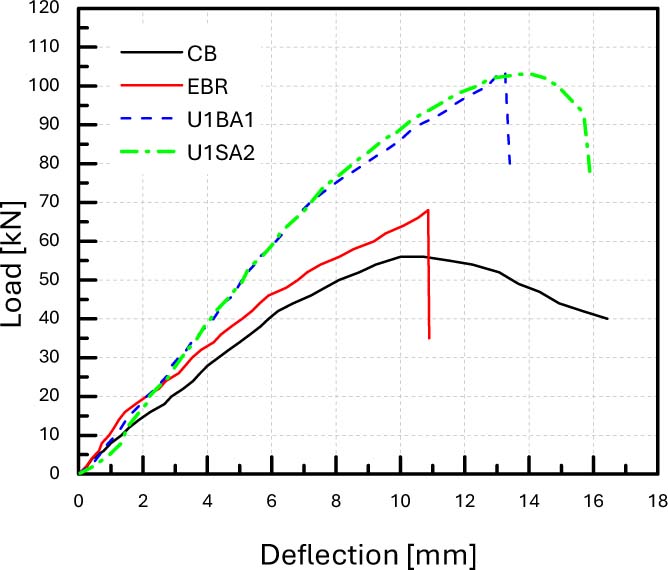
Figure 11:
Load-deflection curve of group G2, EBR and CB
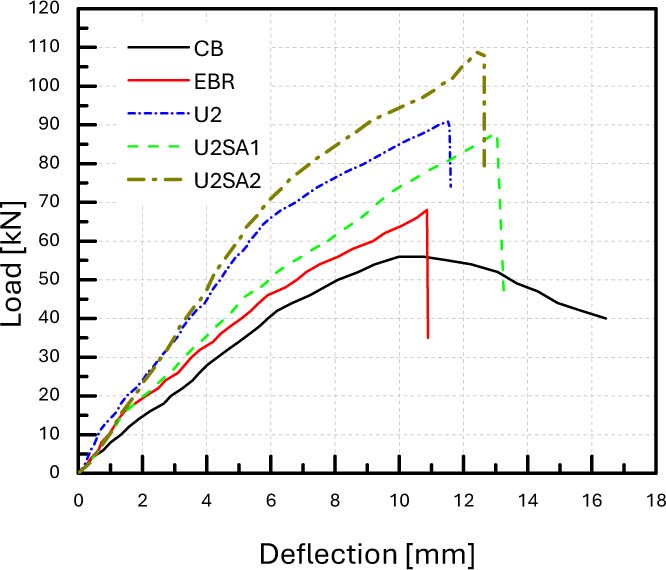
Figure 12:
Load-deflection curves of group G3, EBR and CB
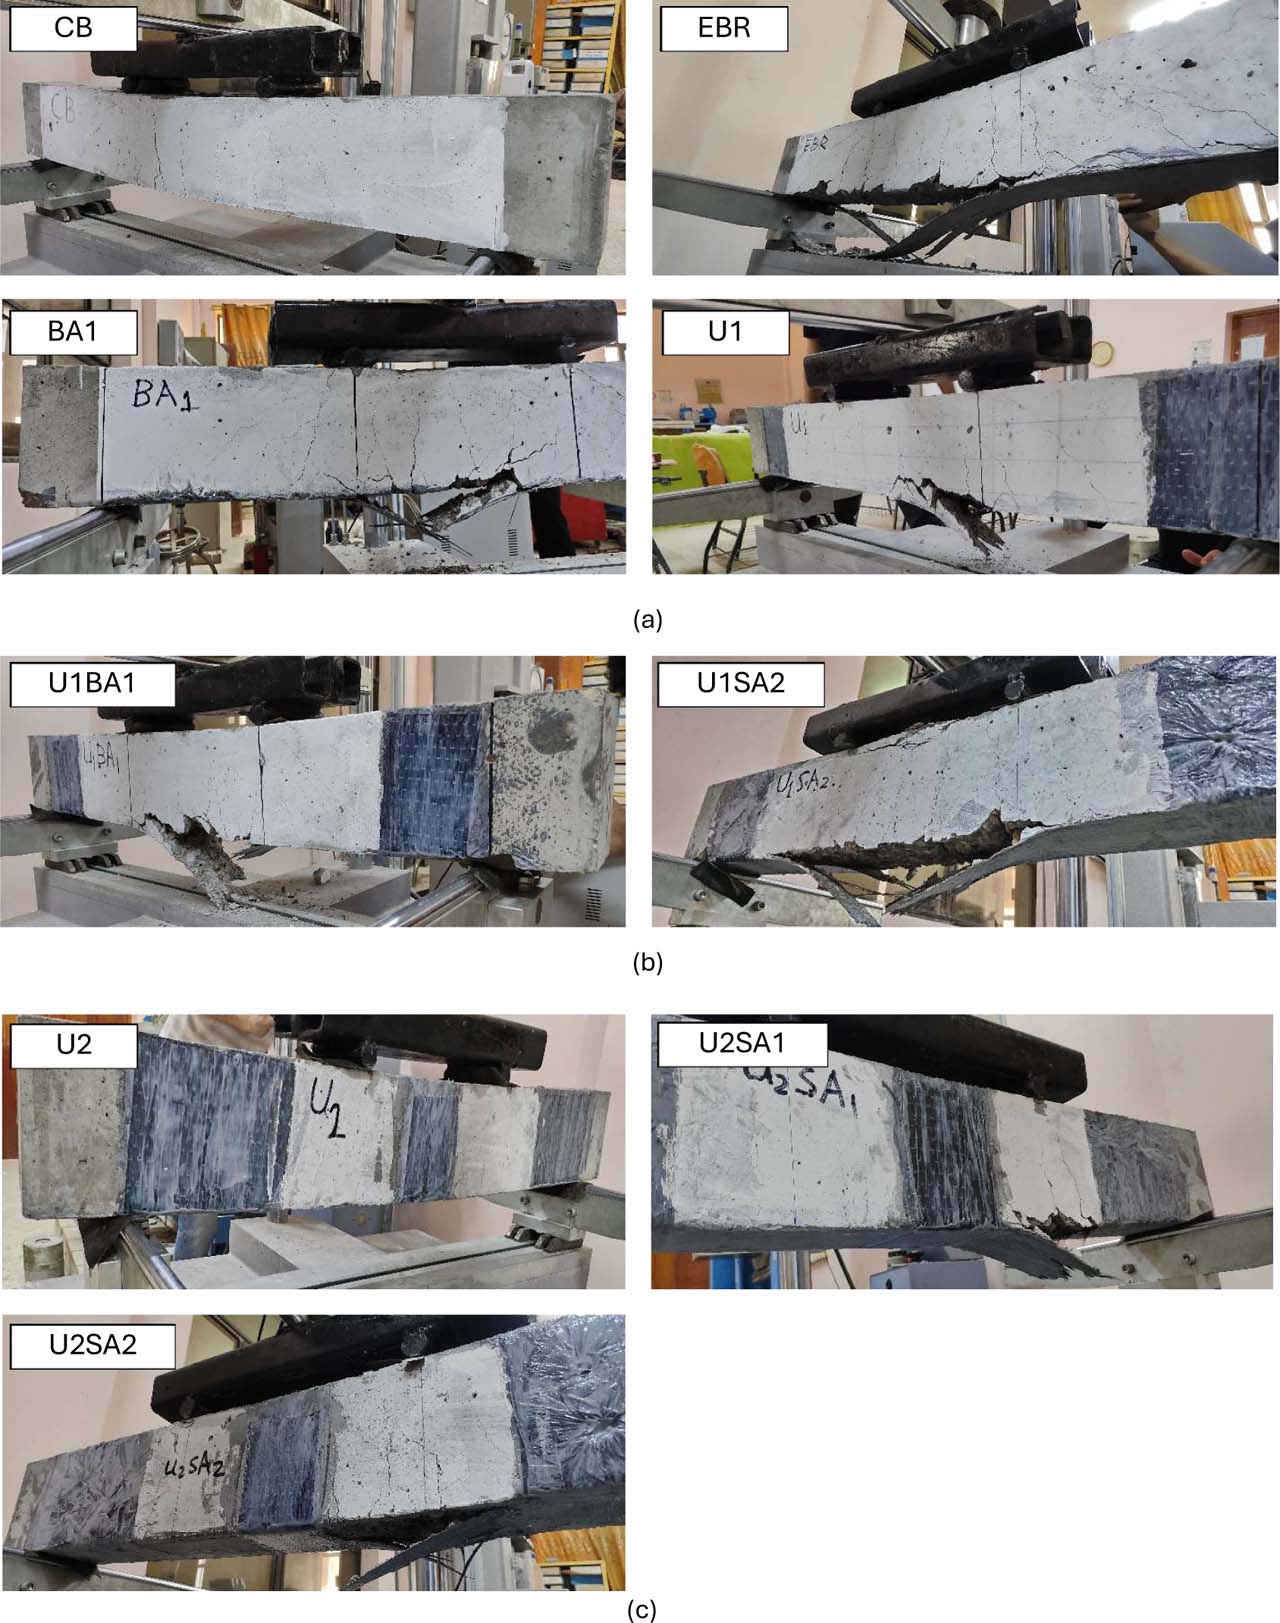
Figure 13:
Modes of failure: (a) Beams of group G1, plus CB, (b) Beams of group G2 and (c) Beams of group G3.