

Table 1:
Physical properties of cement
| Material characteristics | Cement |
|---|---|
| Specific surface area [m2/kg] | 314 |
| Water demand [%] | 20 |
| Start of setting [min] | 110 |
| End of setting [min] | 160 |
| Volume stability acc. to Le Chateliere [mm] | 2 |
| Compressive strength at 2 days [N/mm2] | 28 |
| Compressive strength at 28 days [N/mm2] | 58 |
| Tensile strength at 2 days [N/mm2] | 5.4 |
| Tensile strength at 28 days [N/mm2] | 8.3 |
Table 2:
Chemical composition of cement and silica fume in [%]
| Compound | Cement | Silica Fume |
|---|---|---|
| SiO2 | 21.2 | 95 |
| Al2O3 | 3.6 | 1.32 |
| Fe2O3 | 4.41 | 0.85 |
| CaO | 63.66 | 0.55 |
| MgO | 1.22 | 0.70 |
| SO3 | 3.06 | NA |
| K20 | 0.37 | 1.25 |
| Na2O | 0.23 | 0.40 |
| CI | 0.08 | NA |
| Loss on ignition | 1.28 | 0.12 |
| Insoluble matter | 0.21 | NA |
Table 3:
Grading of fine aggregate
| Sieve size | Passing [%] |
|---|---|
| 10mm | 100 |
| 4.75mm | 92 |
| 2.36mm | 81 |
| 1.18mm | 73 |
| 600µm | 55 |
| 300µm | 24 |
| 150µm | 7 |
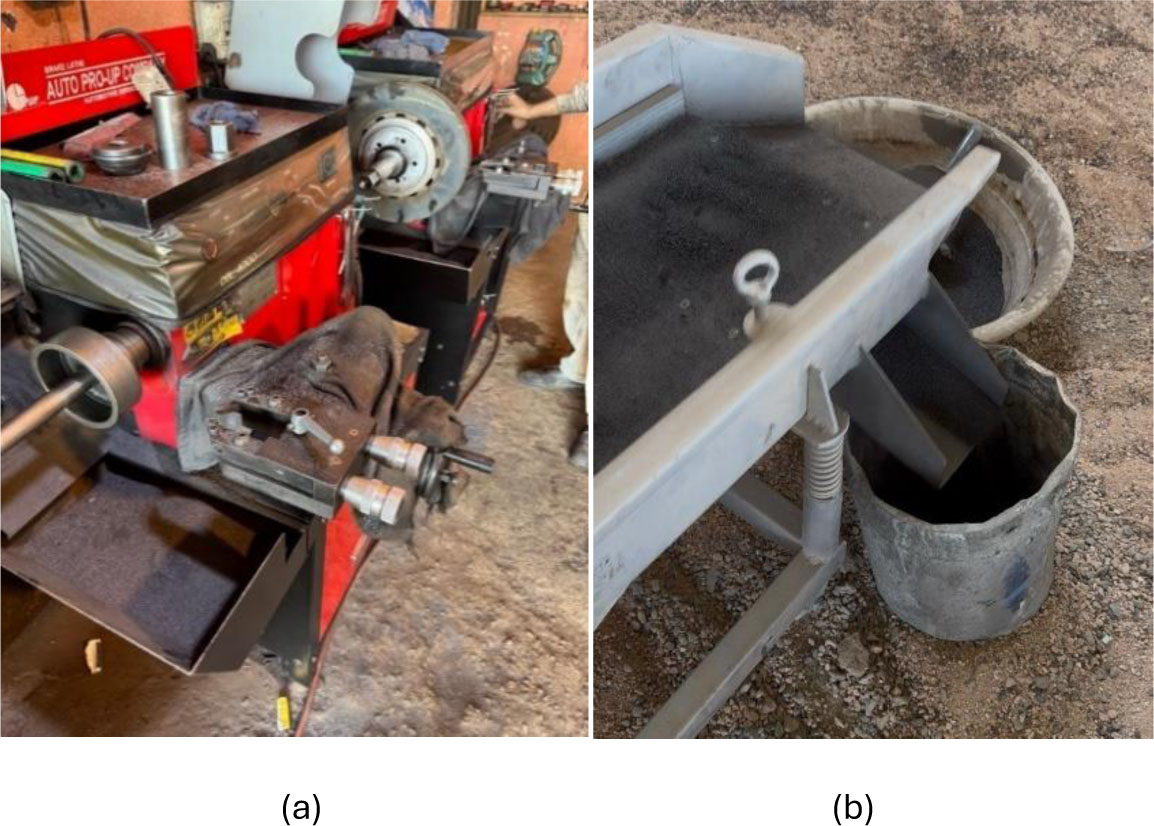
Figure 1:
(a) Steel waste from industrial districts, (b) Sieving of steel waste
Table 4:
Micro and hook fibres of steel characteristics
| Product | Lengths, L [mm] | Diameters, D [mm] | Aspect proportion, L/D | Tensile strengths [MPa] |
|---|---|---|---|---|
| Micro steel fiber (WSF0213) | 13 | 0.2 | 65 | 2860 |
| Hooked fiber (KF 65/35) | 35 | 0.55 | 64 | 2,200 |
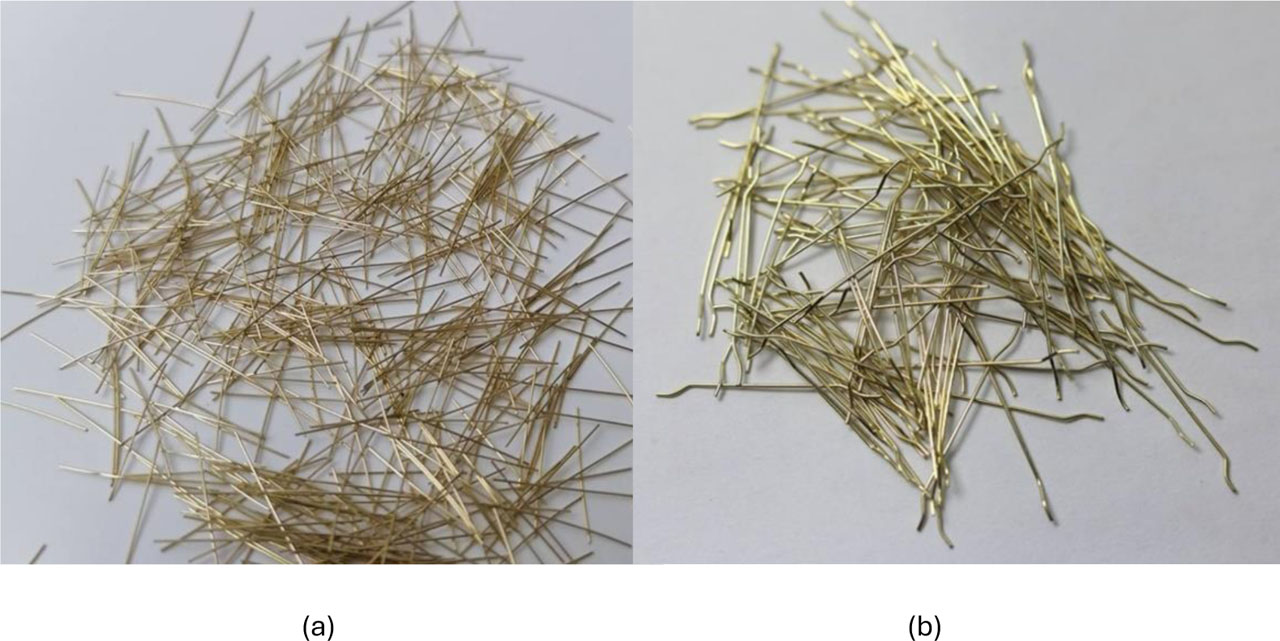
Figure 2:
(a) Micro steel fibers, (b) Hooked steel fibers
Table 5:
The Mixture proportions for HPC mixes
| Symbol | C.[kg/m3] | S.[kg/m3] | S.F [kg/m3] | S.P [kg/m3] | W.[kg/m3] | Steel waste | Fiber | ||
|---|---|---|---|---|---|---|---|---|---|
| [%] | [kg/m3] | [%] | [kg/m3] | ||||||
| S01 | 950 | 1050 | 190 | 40 | 205 | 0 | 0 | 1 | 78.5 |
| S02 | 2 | 157 | |||||||
| S03 | 3 | 235.5 | |||||||
| S251 | 787.5 | 25 | 777.6 | 1 | 78.5 | ||||
| S252 | 2 | 157 | |||||||
| S253 | 3 | 235.5 | |||||||
| S501 | 525 | 50 | 1555.2 | 1 | 78.5 | ||||
| S502 | 2 | 157 | |||||||
| S503 | 3 | 235.5 | |||||||
| S751 | 262.5 | 75 | 2332.8 | 1 | 78.5 | ||||
| S752 | 2 | 157 | |||||||
| S753 | 3 | 235.5 | |||||||
| S1001 | 0 | 100 | 3110.4 | 1 | 78.5 | ||||
| S1002 | 2 | 157 | |||||||
| S1003 | 3 | 235.5 | |||||||
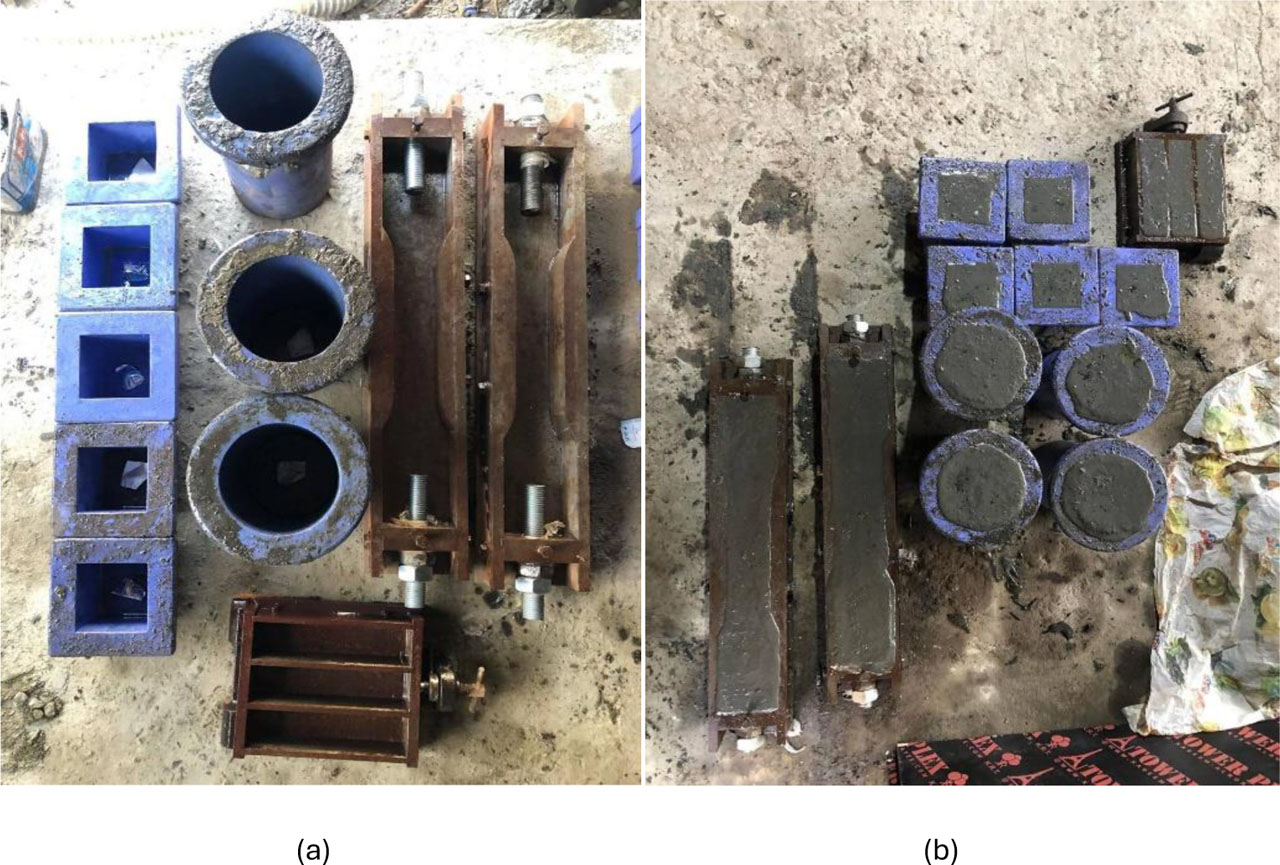
Figure 3:
HPC specimens (a) before casting, (b) after casting
Table 6:
Specimen's specifications
| Test | Shape | Dimensions [mm] | Number |
|---|---|---|---|
| Compression | Cube | 70×70 | 30 |
| Cylinder | 100×200 | 15 | |
| Splitting tensile | Cylinder | 100×200 | 15 |
| Flexural | Beam | 40×40×160 | 15 |
| Direct tension | Bone | 50×75×460 | 15 |
Table 7:
Test results of mixtures
| Symbol | Flowability (mini-slump test) [mm] | Compressive strength [MPa] | Tensile strength [MPa] | Hardened density [kg/m3] | ||||
|---|---|---|---|---|---|---|---|---|
| Cube [fcu] | Cylinder [f′c] | Direct tensile [ft] | Indirect (splitting) [fsp] | Flexural [fr] | ||||
| 7days | 28days | 28days | ||||||
| S01 | 242 | 70.19 | 97.84 | 82.77 | 8.41 | 10.26 | 13.86 | 2470 |
| S02 | 240.5 | 74.37 | 110.9 | 89.09 | 8.88 | 10.94 | 16.48 | 2478 |
| S03 | 239 | 77.42 | 112.23 | 96.76 | 13.2 | 12.15 | 20.56 | 2490 |
| S251 | 234 | 79.72 | 107.26 | 96.61 | 12 | 7.72 | 14.56 | 2550 |
| S252 | 233.5 | 84.62 | 122.59 | 102.83 | 11.44 | 12.06 | 18.67 | 2658 |
| S253 | 232 | 85.4 | 123.37 | 103.56 | 11.56 | 12.94 | 19.5 | 2740 |
| S501 | 225.5 | 92.37 | 108.71 | 96.7 | 9.92 | 11.65 | 15.22 | 2795 |
| S502 | 224.5 | 94.87 | 111.51 | 112.75 | 13.72 | 14.44 | 19.45 | 2900 |
| S503 | 223 | 96.38 | 140.25 | 118.6 | 16.62 | 16.61 | 20.16 | 3030 |
| S751 | 210 | 80.24 | 112.31 | 97.47 | 8.4 | 10.13 | 15.56 | 3100 |
| S752 | 207.5 | 84.56 | 119.7 | 107.31 | 8.8 | 14.81 | 19.89 | 3300 |
| S753 | 206 | 86.88 | 128.8 | 108.08 | 16.52 | 18.13 | 20.56 | 3390 |
| S1001 | 205.5 | 76.68 | 107.35 | 79.99 | 6.3 | 10.93 | 18.22 | 3650 |
| S1002 | 202 | 76.85 | 118.26 | 89.03 | 13.28 | 15.07 | 20.22 | 3690 |
| S1003 | 200.5 | 78.24 | 126.73 | 108.59 | 14.8 | 19.7 | 20.89 | 3740 |
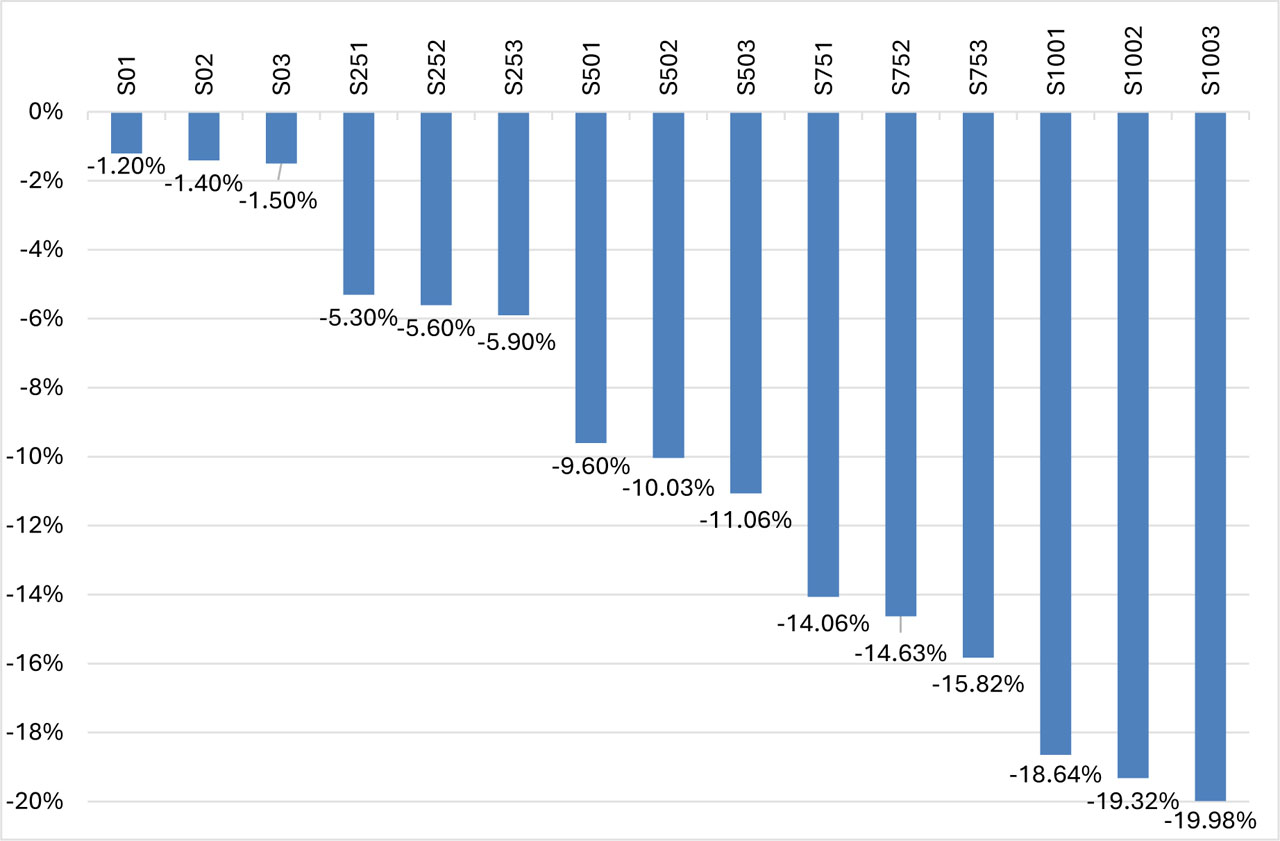
Figure 4:
Percentage of decreasing flowability
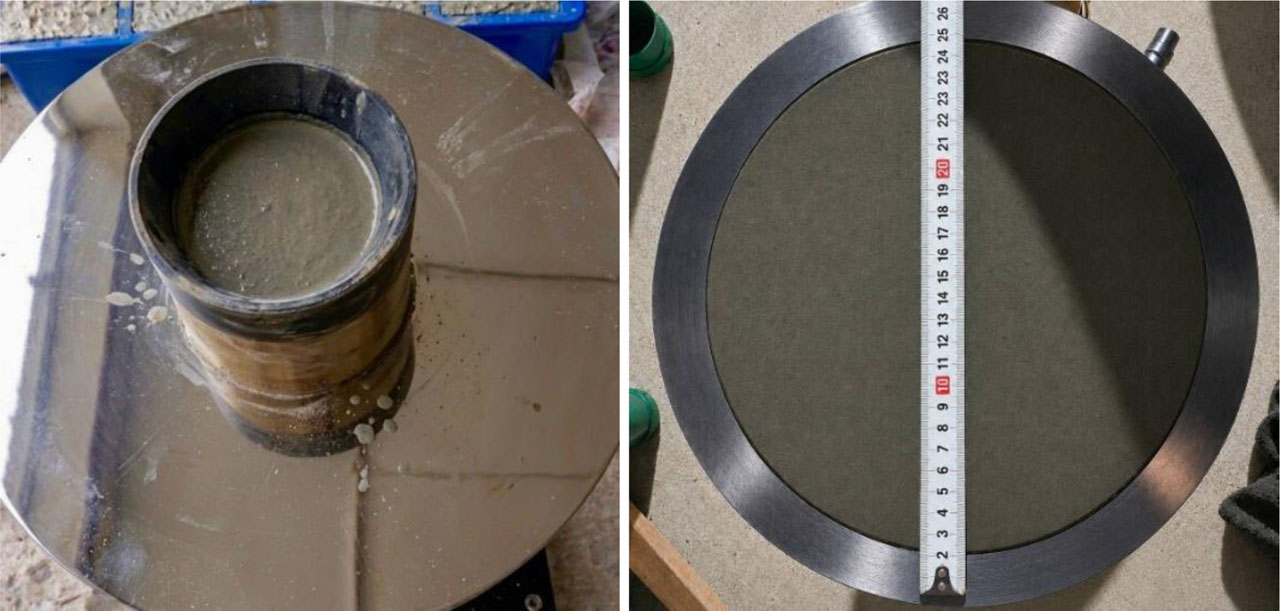
Figure 5:
Flowability test
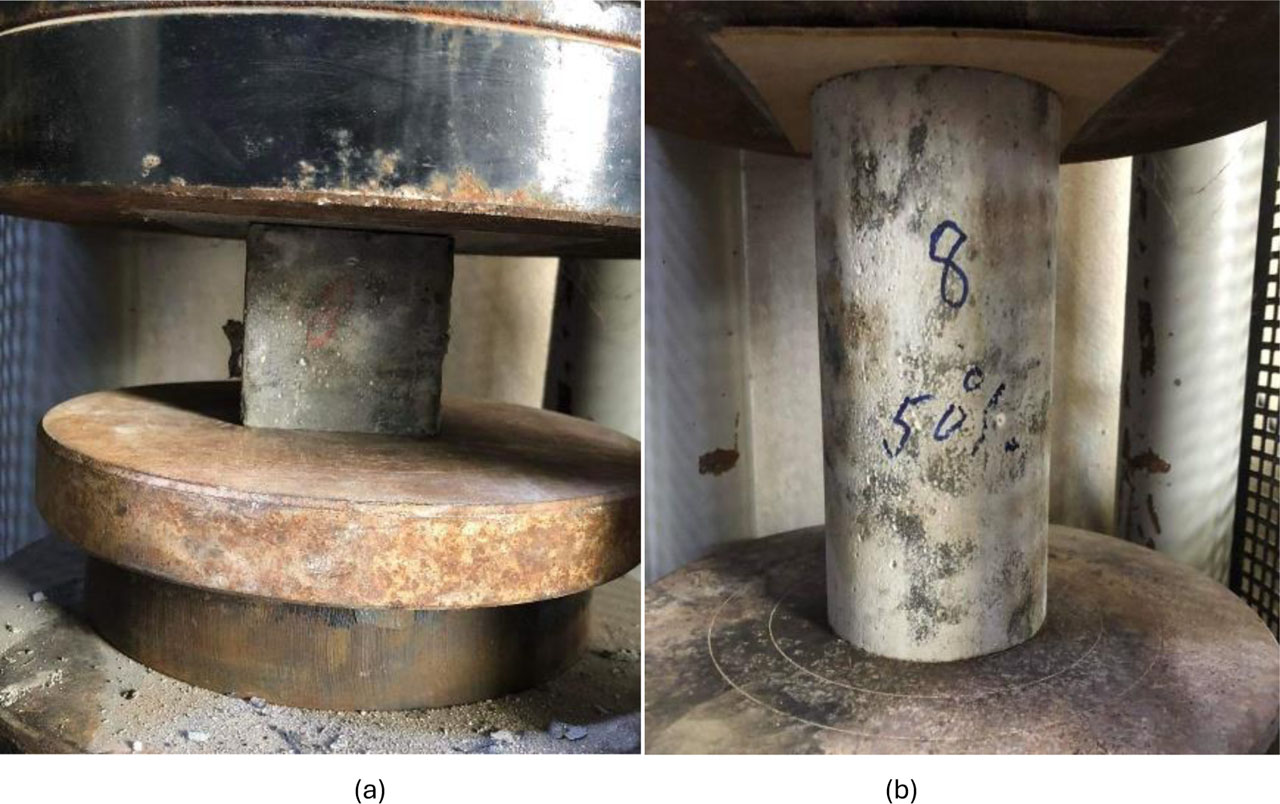
Figure 6:
Compressive strength test of (a) cube specimen, (b) cylindrical specimen
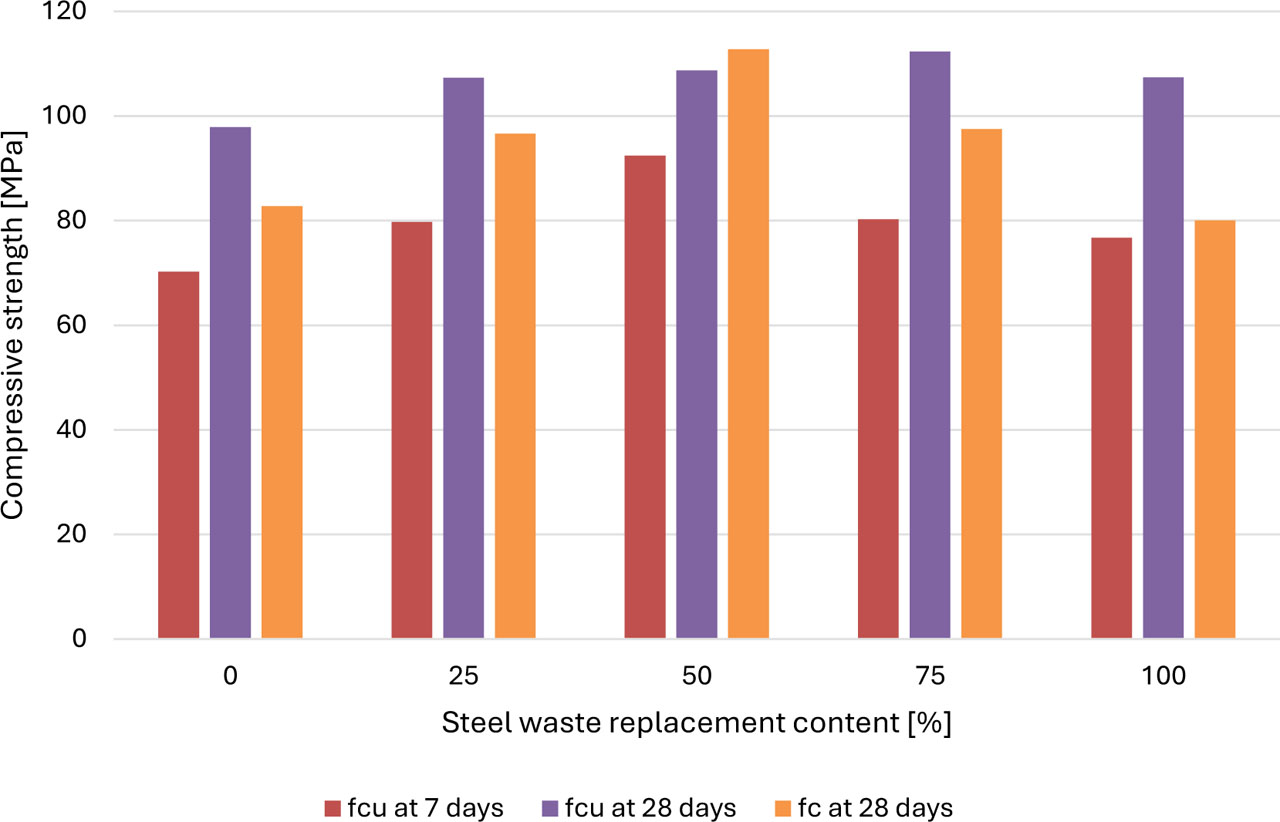
Figure 7:
Compressive strength results with 1% steel fibre
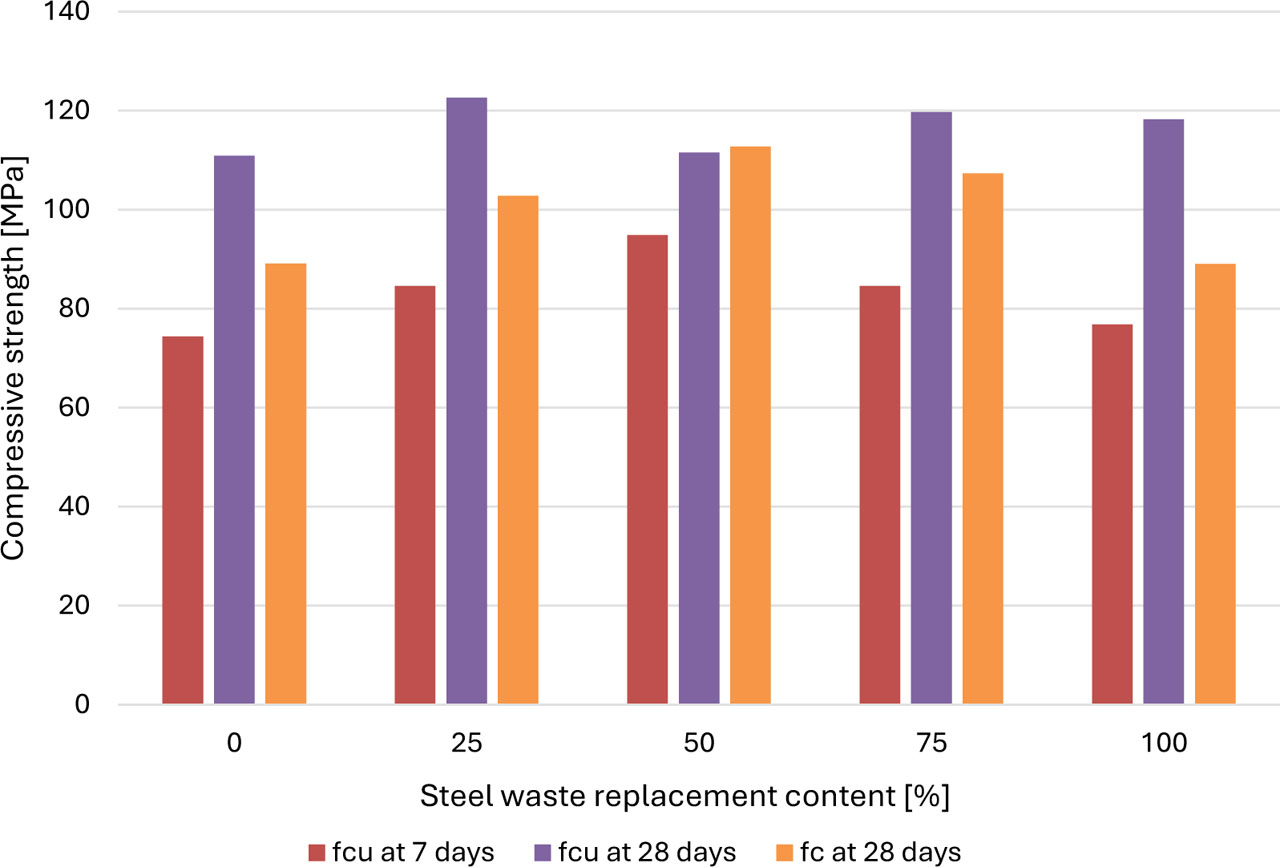
Figure 8:
Compressive strength results with 2% steel fibre
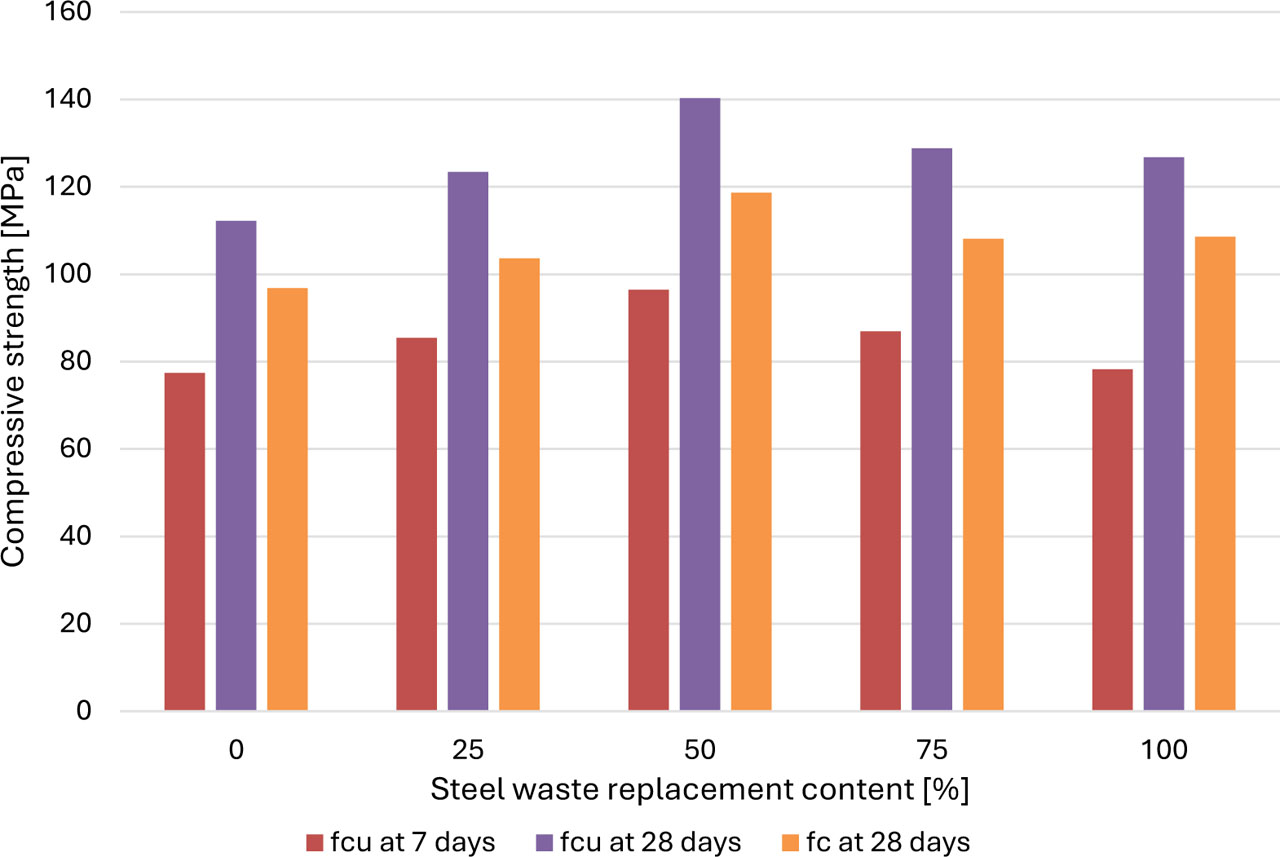
Figure 9:
Compressive strength results with 3% steel fibre
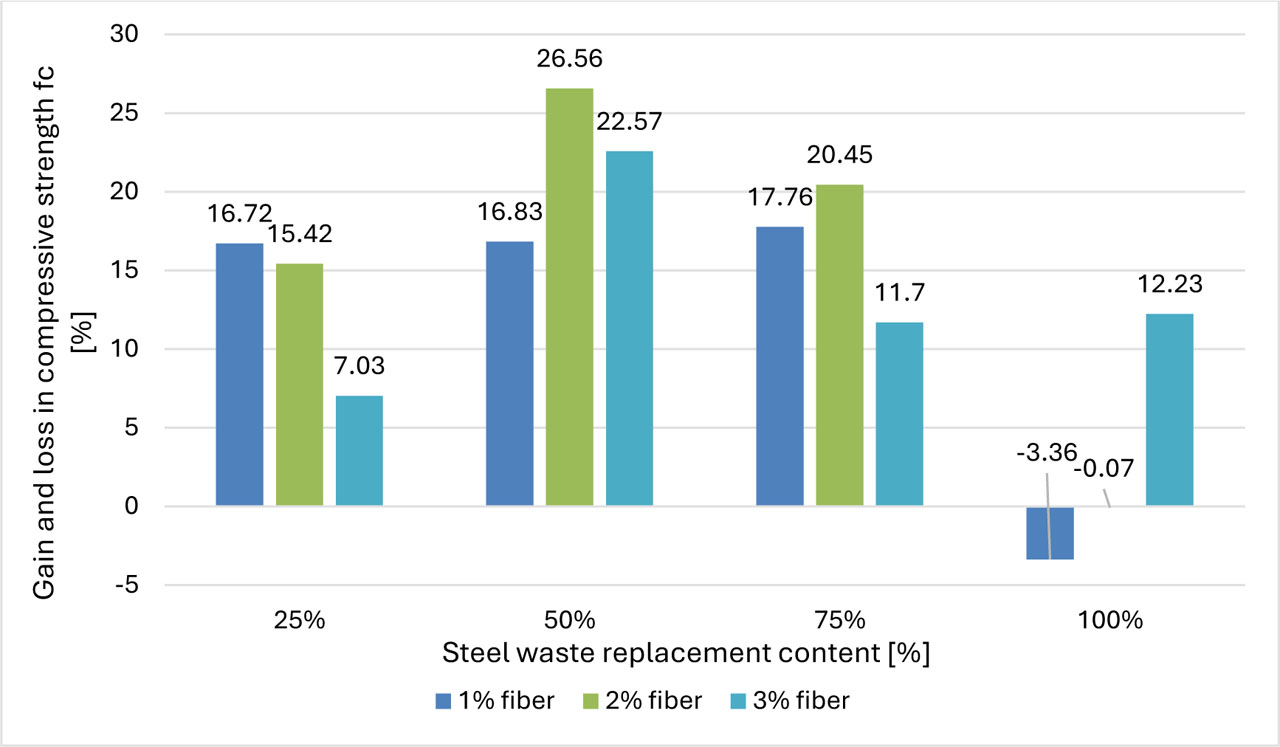
Figure 10:
Percentage of changes in compressive strength of HPC mixtures
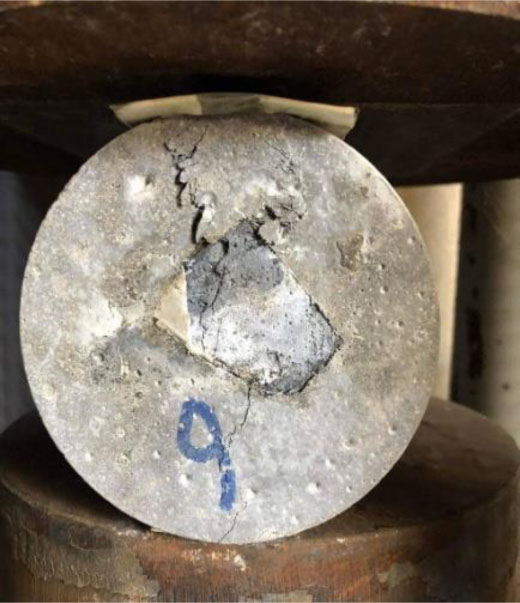
Figure 11:
Specimen of splitting tensile strength test
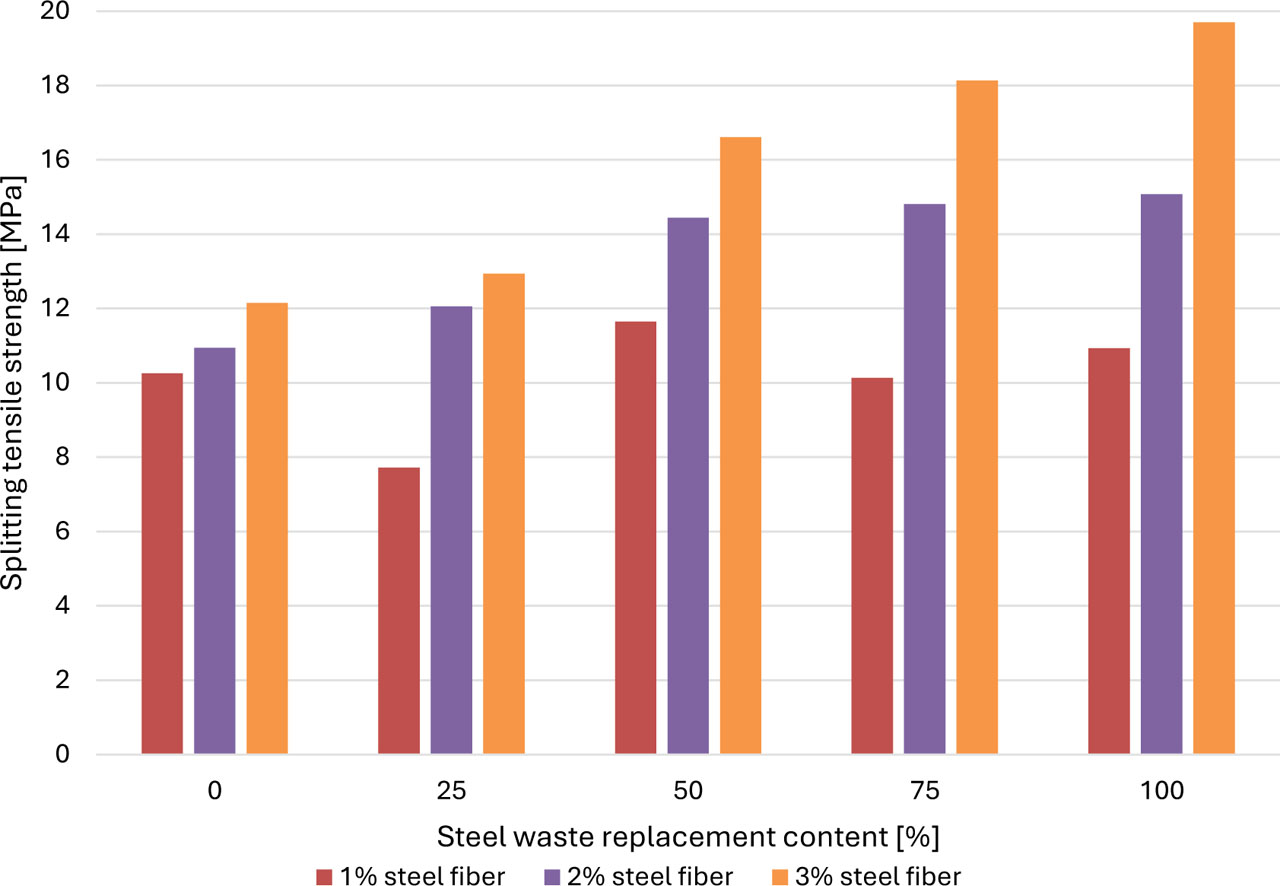
Figure 12:
Splitting tensile strength results with different ratio of steel fibre and steel waste
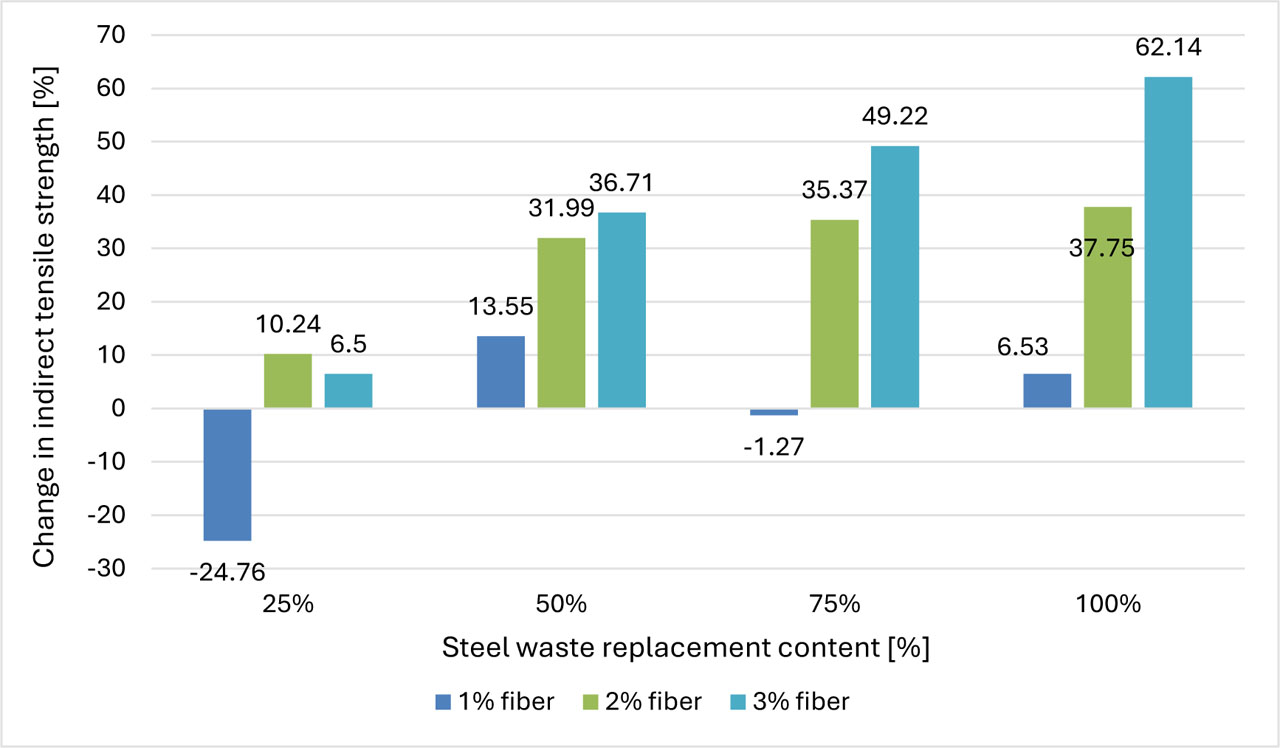
Figure 13:
Percentage of change in indirect tensile strength of HPC mixes
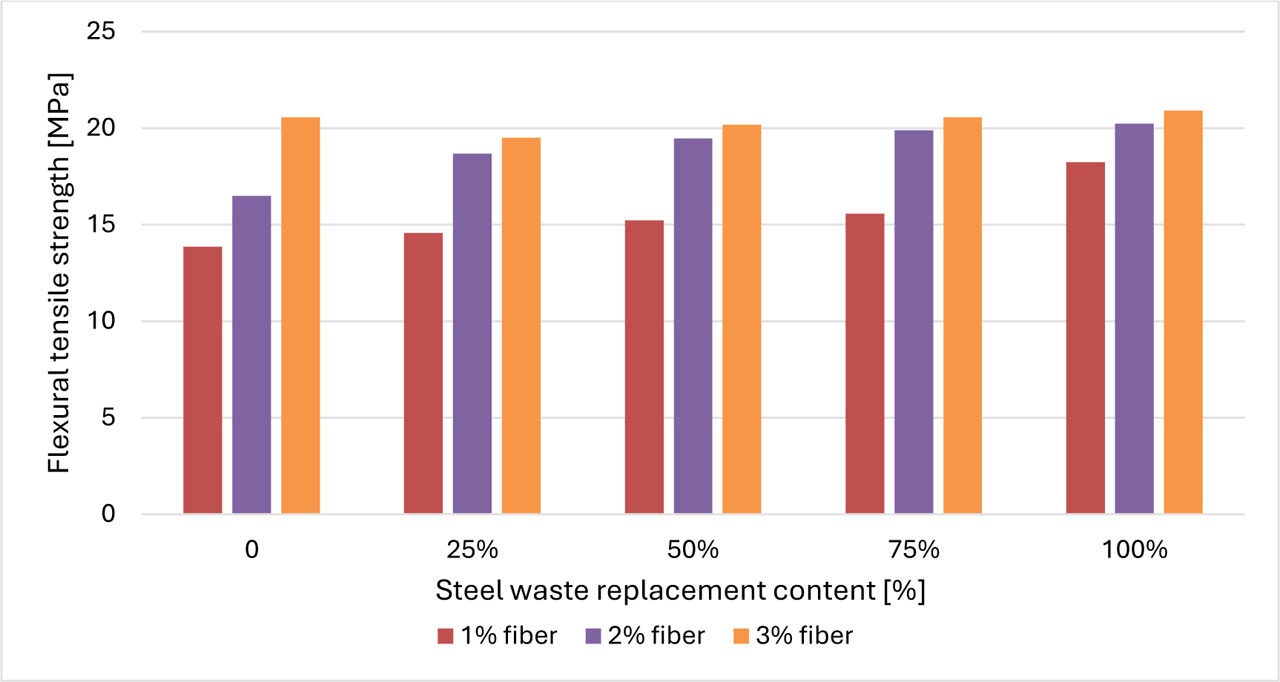
Figure 14:
Flexural strength results with different ratios of steel fibre and steel waste
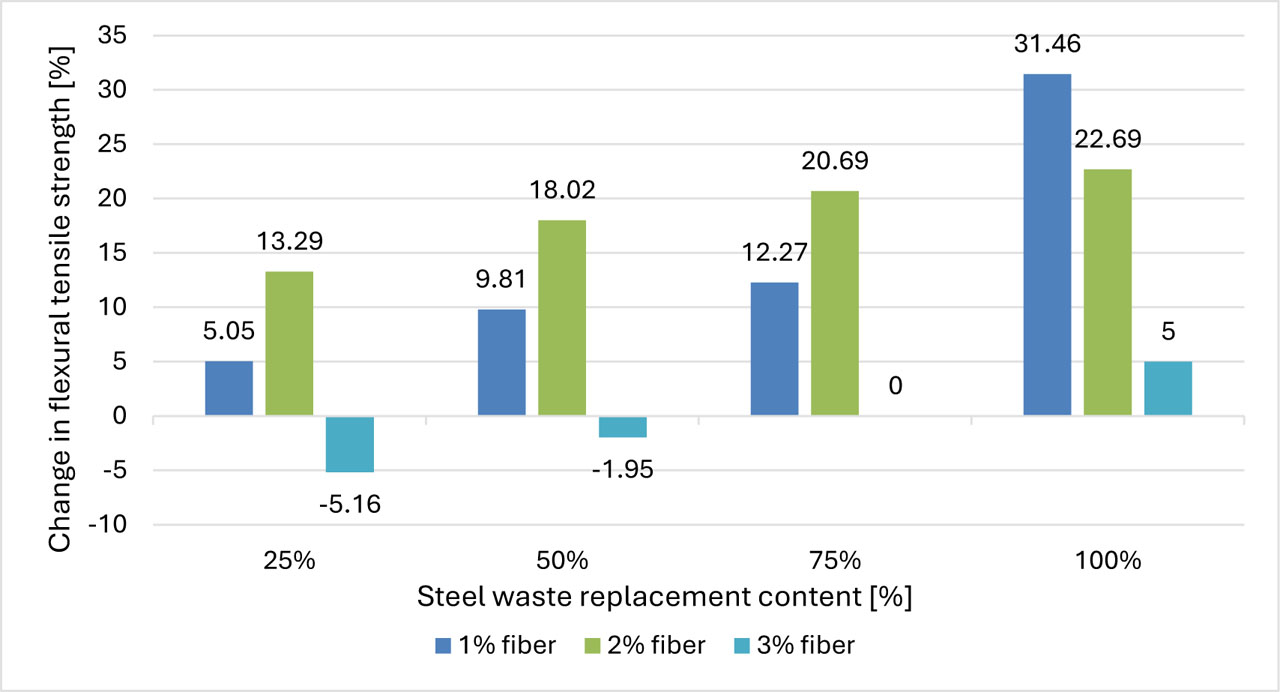
Figure 15:
Percentage of change in flexural tensile strength of HPC mixes
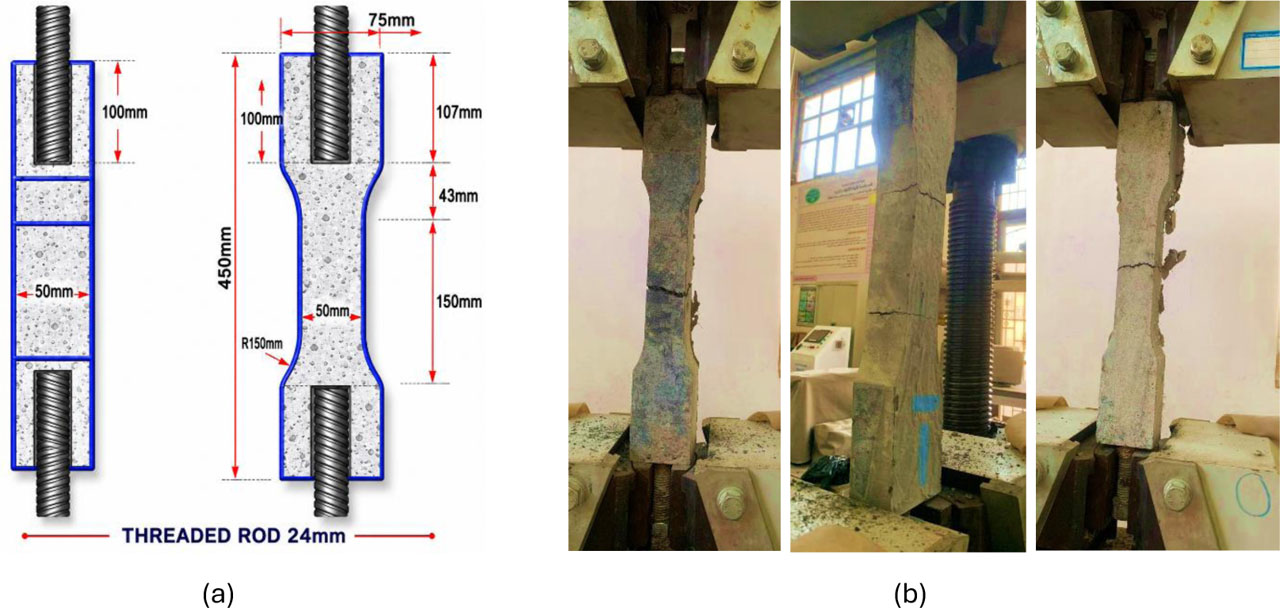
Figure 16:
Direct tensile strength specimen. a) dog bone detail b) Direct tensile strength test
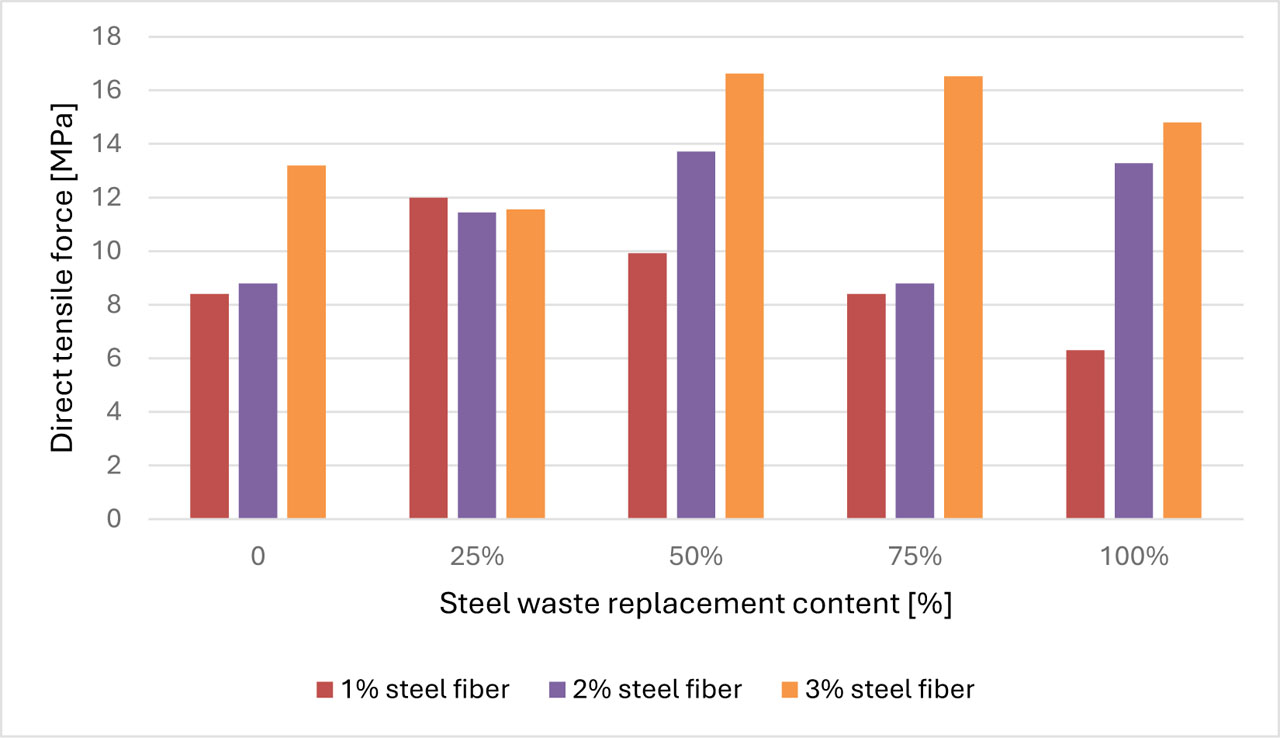
Figure 17:
Direct tensile strength results with different ratio of steel fibre and steel waste
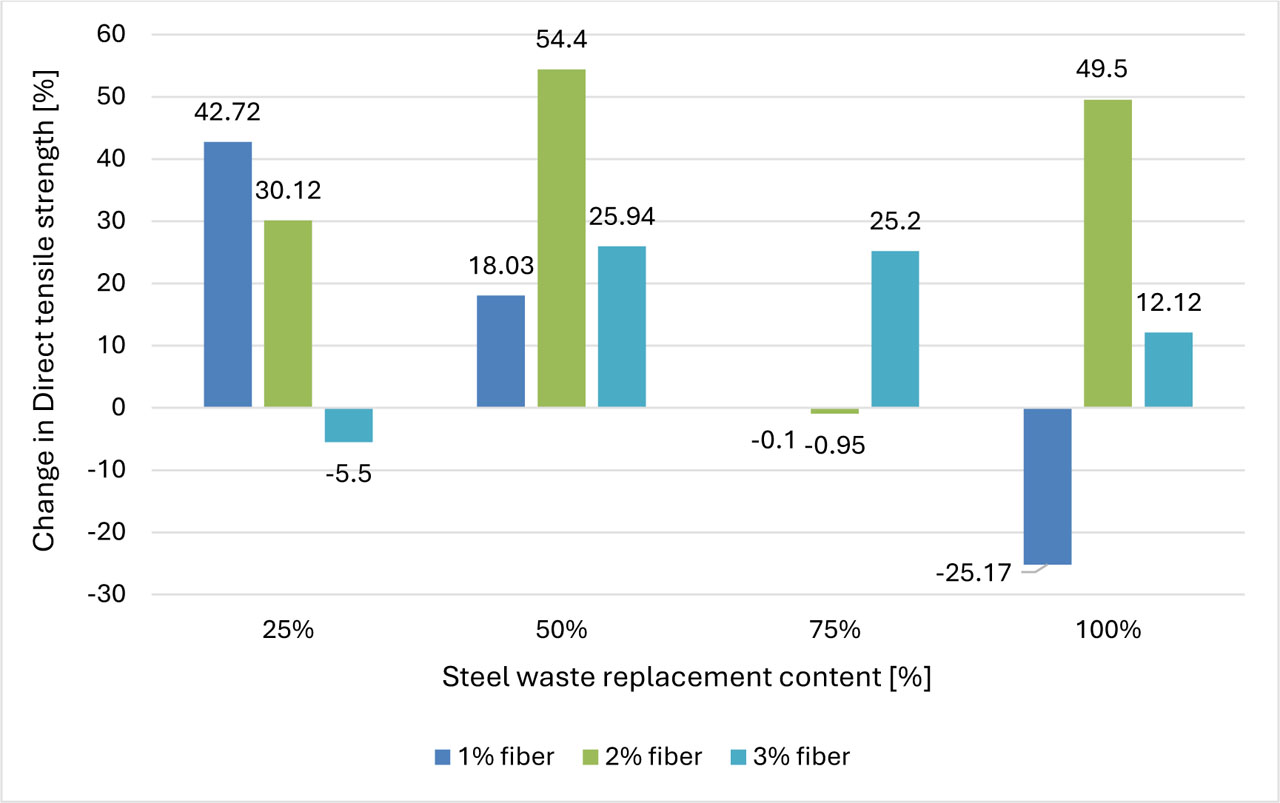
Figure 18:
Percentage of changes in direct tensile strength of HPC mixes
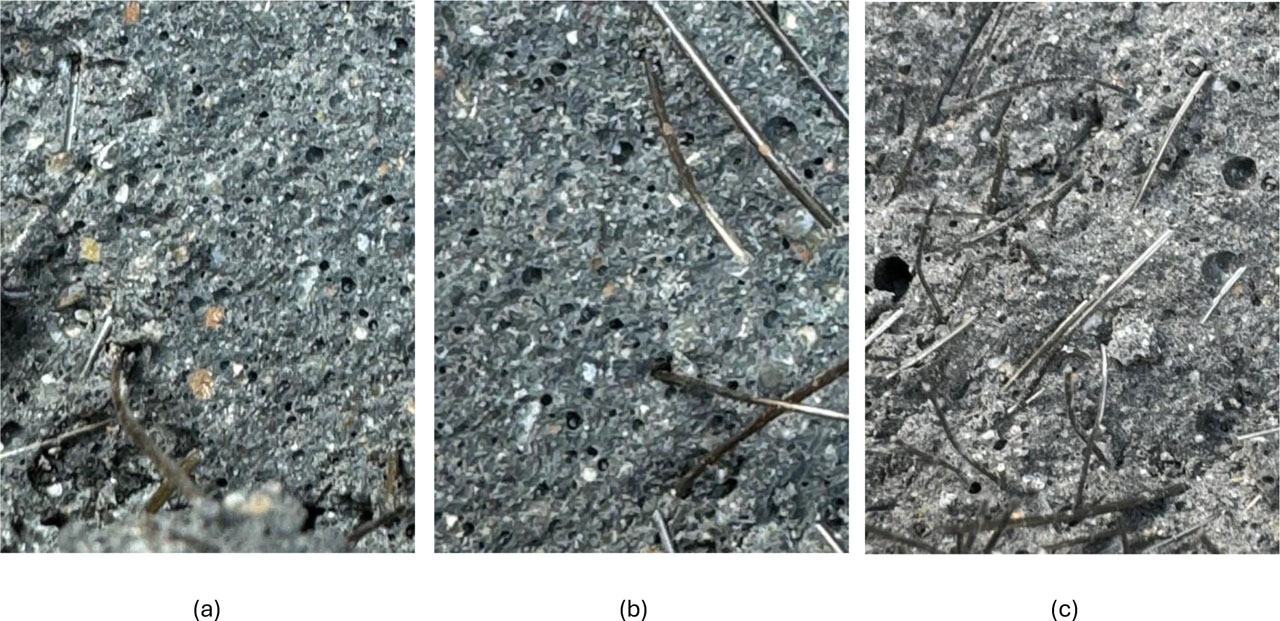
Figure 19:
SEM micrographs of HPC specimens. (a) 25% replacement of steel waste; (b) 50% replacement of steel waste; (c) 75% replacement of steel waste