

1. Introduction
Suban, also known as the Suban Curup–Rejang Lebong Hot Spring, is a well-known geothermal area located in Talang Ulu Village, East Curup District, Rejang Lebong Regency, Bengkulu Province, Indonesia (Fig. 1). Geologically, the region lies along the Bukit Barisan volcanic arc, formed by the subduction of the Indo-Australian Plate beneath the Eurasian Plate. This tectonic configuration has generated intense volcanic and seismic activity throughout Sumatra (McCaffrey, 2009; Natawidjaja, 2003; Rai et al., 2023). One of the dominant tectonic structures is the Semangko Fault, whose active Ketaun Segment crosses the Curup region. Historical seismic records along this segment include the moment magnitude (Mw) 7.4 earthquake on June 8, 1943 (2.8°S, 102.1°E, depth 15 km), located approximately 78 km northwest of Curup–Rejang Lebong (Hurukawa et al., 2014; Sieh & Natawidjaja, 2000; Soetardjo et al., 1985).
The Suban Curup area is situated within the western Sumatra magmatic arc and is strongly controlled by both volcanic and tectonic processes. Recurrent volcanism has produced surface geothermal manifestations, including hot springs (40–50 °C), fumaroles, solfataras, and hydrothermal alteration zones (Situmorang dan Wahyuningsih, 2019). Volcanic systems in Sumatra typically generate andesitic to rhyolitic magmas with high viscosity, allowing heat retention at shallow depths. The Curup–Rejang Lebong area is closely associated with the Kaba volcanic complex (1,952 m above sea level), which is classified as a type-A active volcano and continues to exhibit residual magmatic heat through persistent seismicity and hydrothermal eruptions (Sugianto, 2011).
The Kaba volcanic complex consists of both older and younger eruption products. Several satellite volcanic centers, including Bukit Lumut to the northwest, Taba Penanjung to the southwest, and Bukit Malintang to the southeast, encircle it. These volcanic deposits are predominantly classified as Early Quaternary in age (Sugianto, 2011). Although no recent lava flows have been documented, ongoing hydrothermal eruptions confirm the persistence of an active hydrothermal system, thereby strengthening the area’s geothermal potential. The volcanic activity has produced elevated geothermal gradients, positioning the region as a promising candidate for geothermal energy exploration and utilization. Furthermore, recent advancements in geophysical approaches—particularly the combined application of satellite gravity analysis and microtremor measurements—enable more detailed and comprehensive subsurface investigations of geothermal resources in this area.
Globally, integrated geophysical approaches have shown high effectiveness in geothermal exploration. Studies in Turkey, Spain, and China demonstrate that combining Horizontal-to-Vertical Spectral Ratio (HVSR) microtremor techniques with gravity measurements enhances subsurface imaging, improves fault and reservoir delineation, and reduces uncertainty prior to drilling (Cheng et al., 2021; Mitjanas et al., 2021; Xu et al., 2012). Moreover, this integrated approach reduces exploration risk and improves economic feasibility (Tian et al., 2020). However, such integrated investigations remain limited across the Indonesian volcanic arc—particularly in the Suban Curup geothermal field—resulting in a lack of detailed understanding of subsurface geometry, structural controls, and reservoir characteristics.
This study aims to address the existing knowledge gap by integrating HVSR microtremor measurements with gravity modeling derived from Global Gravity Model plus (GGMplus) satellite data to characterize the subsurface structure of the Suban Curup geothermal area. HVSR data provide insights into resonance frequency and sediment thickness, while gravity anomalies reveal density contrasts associated with faults, calderas, and other geological structures that influence geothermal fluid pathways. Previous research by Siburian et al., (2024) utilized only HVSR data and focused on seismic vulnerability rather than geothermal potential. Therefore, integrating both datasets in this study is expected to yield a more comprehensive and reliable subsurface model that supports early-stage geothermal feasibility assessments and enhances the effectiveness of exploration and drilling strategies.
The findings of this research are expected to support Indonesia’s renewable energy development agenda and reduce reliance on fossil fuels. Furthermore, the outcomes may provide valuable insights into the characterization of medium-scale geothermal systems in tectonically active regions, contributing to global initiatives in low-carbon, sustainable energy development.
2. Methodology
2.1. Geological setting
The study area is located in the Suban Curup Hot Spring Tourism Region, Rejang Lebong Regency, Bengkulu Province, Indonesia (Fig. 1a). It lies in the highlands of the Bukit Barisan Mountains at elevations of 100–1000 m above sea level and is strongly influenced by volcanic and tectonic processes.
Geologically, the region is dominated by volcanic products associated with the Kaba volcanic complex. The main lithological units consist of the Hulusimpang Formation (volcanic breccia), the Bal Formation (volcanic breccia and sandstone), and younger andesitic–basaltic volcanic materials, including tuff and breccia. The Suban Curup area occupies a north–south depression filled with Quaternary volcanic sediments sourced predominantly from Mount Kaba.
Based on the Bengkulu regional geological map (Fig. 1b), the study site lies between the Ketaun and Musi Fault Segments, both trending northwest–southeast and forming part of the Sumatra Fault System. Four principal stratigraphic units are identified: the Hulusimpang Formation (Tomh), the Seblat Formation (Toms), the Granitic Intrusion (Tmgr), and the Bal Formation (Tmba). The Hulusimpang Formation (Oligocene–Miocene) consists of volcanic breccia, lava, and tuff with interbedded conglomerate and sandstone, whereas the Seblat Formation (Early–Middle Miocene) comprises claystone, sandstone, limestone, and marl. The Bal Formation is composed mainly of andesite, volcanic breccia, and tuff. This geological and structural framework is clearly expressed in the surface morphology of the area, as illustrated by the topographic map in Fig. 1c. Figure 1c shows elevation variations from approximately 900 to more than 1,900 m above sea level, with high elevations concentrated in the eastern sector near Mount Kaba and lower elevations toward the western lowlands. The dominant northwest–southeast–oriented topographic pattern reflects strong structural control exerted by the Sumatra Fault System.
Tectonically, the Suban Curup region lies within a structurally complex segment of the Sumatra Fault Zone, characterized by secondary fractures and multidirectional structural deformation linked to the active Ketaun Segment. The abundance of hot springs, fumaroles, and highly weathered rocks indicates strong hydrothermal alteration, reflecting the area’s geothermal potential.
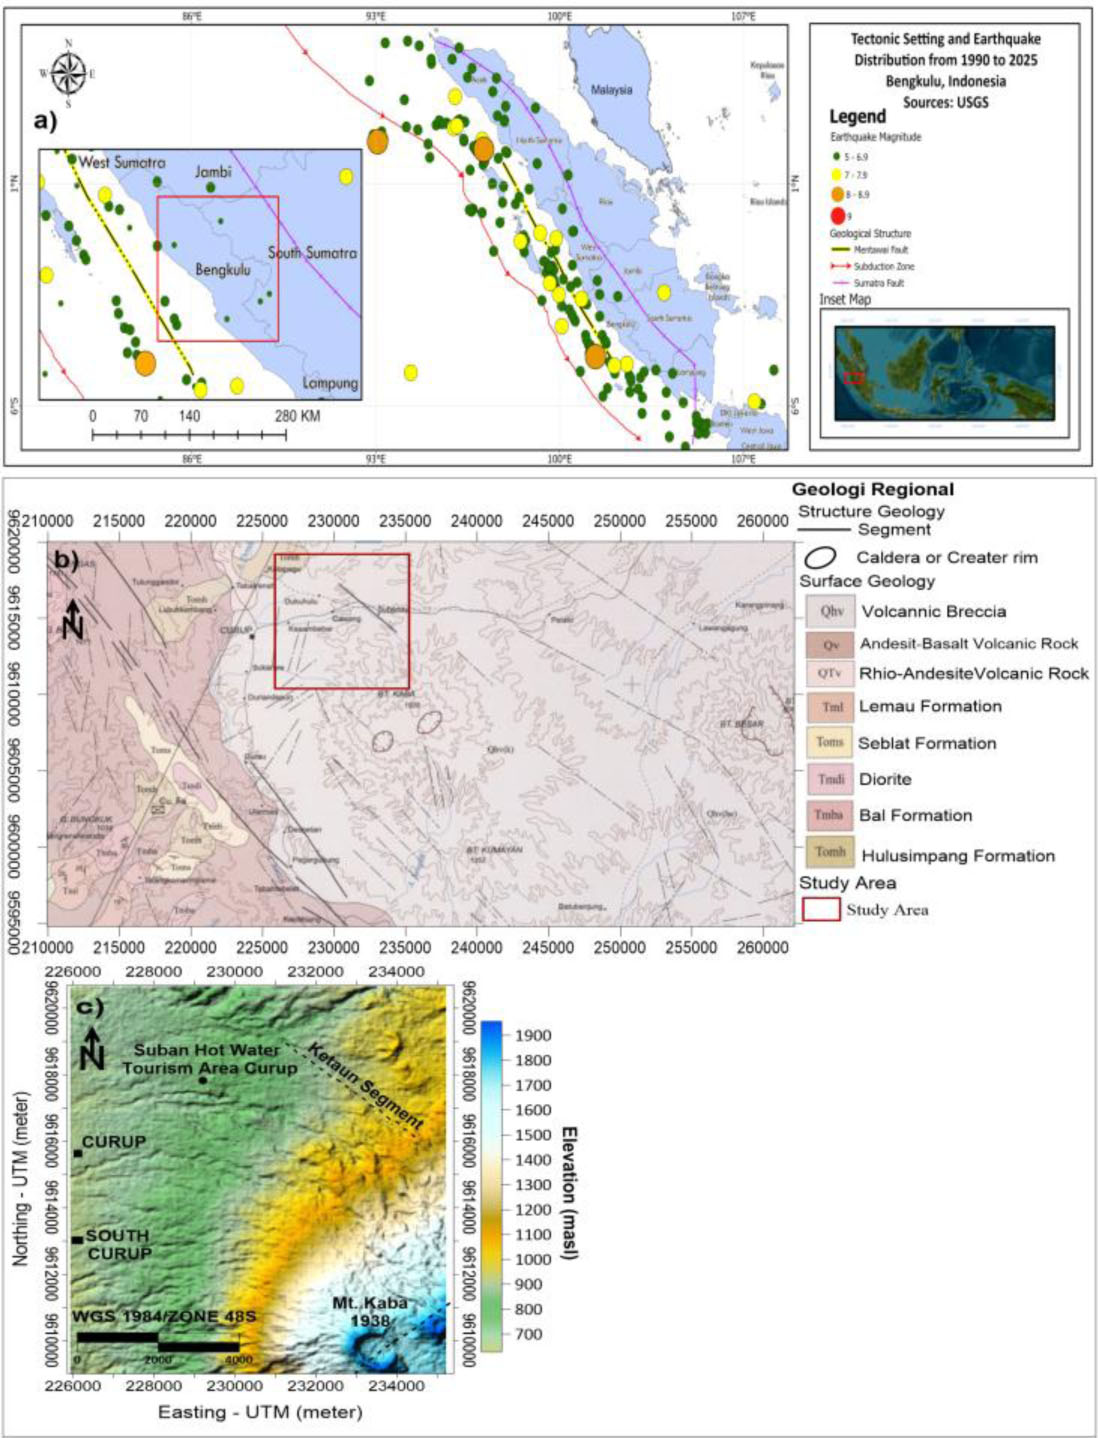
Figure 1:
a) Tectonic setting of the Bengkulu area, Sumatra, and distribution of earthquake epicenters; b) geological map of the study area (modified after Gafoer et al. 1992); c) topographic map of the Curup–Rejang Lebong area
2.2. Research Design
This study adopted a quantitative and observational research design to characterize the subsurface structure and geothermal potential of the Suban Curup geothermal field, Rejang Lebong Regency, Bengkulu Province, Indonesia. An integrated geophysical approach was implemented by combining Horizontal-to-Vertical Spectral Ratio (HVSR) microtremor analysis with gravity anomaly interpretation derived from Global Gravity Model plus (GGMplus) satellite data. The integration of these methods was intended to improve the reliability of subsurface characterization and reduce uncertainty in early-stage geothermal exploration.
The research workflow consisted of several sequential stages, including literature review, field data acquisition, preprocessing and analysis of microtremor data, satellite gravity data extraction and correction, anomaly interpretation, and integrated subsurface modelling. Microtremor measurements were conducted at multiple observation points distributed across the geothermal manifestation zone to record ambient seismic vibrations. The acquired signals were processed using the HVSR method to determine dominant frequency (f0) and amplification characteristics, which were subsequently interpreted to estimate sediment thickness and identify subsurface layering associated with geothermal structures.
In addition, gravity anomaly data obtained from the GGMplus model were analyzed to identify lateral density variations related to geological discontinuities, volcanic formations, fault systems, and potential geothermal reservoirs. The gravity data interpretation was integrated with HVSR-derived parameters to delineate structural controls influencing geothermal fluid migration and heat distribution within the study area. The integrated interpretation of both datasets was subsequently used to construct a conceptual subsurface model of the Suban Curup geothermal system. This approach enables a more comprehensive understanding of the geological and structural framework controlling geothermal manifestations and provides supporting information for geothermal resource assessment and future exploration strategies.
2.3. Materials and Procedures
2.3.1. CBA and separation
The Bouguer anomaly is widely used as the primary anomaly in continental, marine, and nearshore gravity surveys. It differs from the free-air anomaly because it incorporates the additional gravitational effect of the mass between the observation point and the reference datum (Hinze et al., 2013). The CBA can be obtained using the formulation proposed by Hirt et al. (2019):
CBA represents the Complete Bouguer Anomaly (mGal), FAA denotes the free-air anomaly (mGal), and FSTG refers to the full-scale topographic gravity (mGal) derived from SRTM2gravity. To enhance the interpretation of deep and shallow subsurface structures in the Curup–Rejang Lebong region, the CBA data were separated into regional and residual components using the upward continuation method. This technique applies a low-wavenumber pass filter that highlights anomalies from deeper sources while attenuating noise and shallow-structure contributions. The filter is progressively applied from the surface to a specified elevation until a consistent and stable anomaly response is obtained at that level.
Two-dimensional (2D) radial spectrum of gravity data
Radial spectral analysis is widely used to estimate the depths of magnetic and gravity sources. To determine the depth to the magnetic basement, both the spectral peak and centroid methods are commonly used (Njiteu Tchoukeu et al., 2021; Ravat et al., 2007). In this study, the spectral peak approach was employed to estimate sediment thickness and basement depth at several key locations within the study area. The analysis is based on the 2D Fourier transform, and the results are plotted on a logarithmic scale as a function of the radial wavenumber (kr). The radial amplitude is calculated as the average of the 2D Fourier amplitude spectrum and is expressed as follows (Njiteu Tchoukeu et al., 2021):
along a ring of radius, kr = [kx2 + ky2]1⁄2 centered at the origin, kx = ky = 0. The Fourier transform of potential field data in the frequency domain may be written as F = Ce−hk, where . A tangential line that fits the linear section of the amplitude spectrum represents the depth h in the top layer of the source of the anomaly.2.3.2. Three-dimensional (3D) gravity inversion
Gravity inversion was performed to determine the subsurface structure of the Suban Curup area using rock density contrast distributions. Inversion is a numerical computation technique used to estimate subsurface parameters that best match the observed gravity response (Saibi et al., 2021). Three-dimensional gravity inversion was performed using the Grablox and Bloxer packages (Pirttijärvi, 2008). Grablox provides a GUI-based modeling platform that constructs a block model representing the subsurface volume, in which each major block is subdivided into smaller volumetric elements (minor blocks) to represent density variations. Bloxer is used to edit the density of each minor block, while the total gravitational field is calculated as the superposition of all block contributions. Model optimization was achieved by repeatedly adjusting the density and block-size parameters to minimize the misfit between measured and calculated gravity data.
The inversion procedure in Grablox employs a linearized approach based on Singular Value Decomposition (SVD), with the SVD computation constituting the most time-intensive stage. To reduce misfit while avoiding excessive model complexity, Occam’s inversion was applied to simultaneously minimize data residuals and model roughness via a Lagrange multiplier. During inversion, density and spatial block configuration are used as weighting parameters. The model roughness factor (R) is expressed as follows:
where m(z) represents the quantitative value of the parameter as a function of depth.In a linear inverse problem, the initial parameter estimate in Occam’s inversion is defined by
where λ−1 is the Lagrange multiplier used to minimize or maximize a function under a constraint equation (SVD, Least Squares Estimator). The term ∂ represents the roughness factor, and ∂T denotes its transpose. W, G, and d represent the weighting factor, the linear operator, and the observed data, respectively.For a non-linear problem, Equation (4) can be reformulated as follows:
where J is the linear derivative operator obtained from the Taylor expansion. The elements of J form the inversion matrix resulting from the linearization process, so that the estimated parameter in the non-linear case can be expressed as follows:2.3.3. Ambient noise measurement and processing
Ambient noise analysis was performed using the HVSR method (Nakamura, 1989). The NS, EW, and V components at each station were processed using Fast Fourier Transform (FFT) to obtain their spectral amplitudes. The HVSR curve was derived from the ratio of the square root of the averaged horizontal spectra (SNS and SEW) to the vertical spectrum (SV), following Siburian (2024). The smoothed spectral ratio at each site was then used to determine the fundamental frequency (f0) and amplification factor (A0). The A0 values were classified into four categories according to Jiang et al. (2022), while f0 was grouped based on the soil classification scheme of Kanai (1983).
Subsequently, the seismic vulnerability index (Kg) and sediment thickness (H) were calculated using the formulations of Siburian (2024) and Arifin (2014), respectively. High Kg values identify deformation-prone zones, such as fractures, faults, and weathered volcanic rocks, that facilitate hydrothermal fluid migration (Nakamura, 2000), while large H values may indicate shallow geothermal reservoirs. Sediment thickness (H) was estimated using the empirical relationship proposed by Arifin (2014):
2.4. Data Collection
2.4.1. Gravity data
Gravity data were sourced from GGMplus, a high-resolution gravity product developed collaboratively by Curtin University, Perth, Western Australia, and the Technical University of Munich (TUM), Germany, supported by the Australian Research Council, the TUM Institute for Advanced Study, and the Western Australian iVEC supercomputing facility. GGMplus integrates gravity information from GRACE and GOCE satellite missions with EGM2008 and short-wavelength topographic gravity effects, producing gravity disturbance values equivalent to free-air anomalies (Hirt et al., 2013). The dataset was extracted for the Curup–Rejang Lebong region within the geographic bounds of 102.19°E–102.57°E and 2.22°S–3.31°S (Fig. 1b).
To compute the Complete Bouguer Anomaly (CBA), modern field correction was performed using the SRTM2gravity model developed by Hirt et al. (2019). SRTM2gravity is a global high-resolution model (90 m) that calculates the gravitational effect of Earth’s topography using ~28 billion computation points for all terrestrial areas between −65° and 85° latitude. This full-scale topographic gravity product (in mGal) enables direct reduction of GGMplus gravity disturbances without requiring additional spherical Bouguer shell calculations, as topographic effects are already incorporated.
In the study area, free-air anomaly values range from 100 to 220 mGal, with high anomalies concentrated around the Mount Kaba volcano (Fig. 2a). In contrast, lower anomalies are dominant in the western Suban, Curup, and South Curup hot spring zones. After applying SRTM2gravity corrections, the full-scale topographic gravity values (90–210 mGal) were used to derive the CBA for the Curup–Rejang Lebong region (Fig. 2b).
2.4.2. Microtremor data
Microtremor data were obtained from Siburian et al. (2024), consisting of 100 measurement points spaced approximately 1 km apart. The acquisition sites are shown in Fig. 2. To validate the previous measurements, three locations (T1, T2, and T3) were remeasured to ensure consistency with Siburian et al. (2024). In addition, new acquisition points were added around Mount Kaba, where no measurements were previously carried out. As a result, the total number of observation points in this study is 106.
Data acquisition and quality control followed the procedures recommended by the Site Effects Assessment Using Ambient Excitations (SESAME) European Research Project (SESAME 2004). Ambient noise records were analyzed using the HVSR method proposed by Nakamura (1989). To obtain spectral amplitudes for the north–south (NS), east–west (EW), and vertical (V) components at each site, the signals were processed individually using the Fast Fourier Transform (FFT).
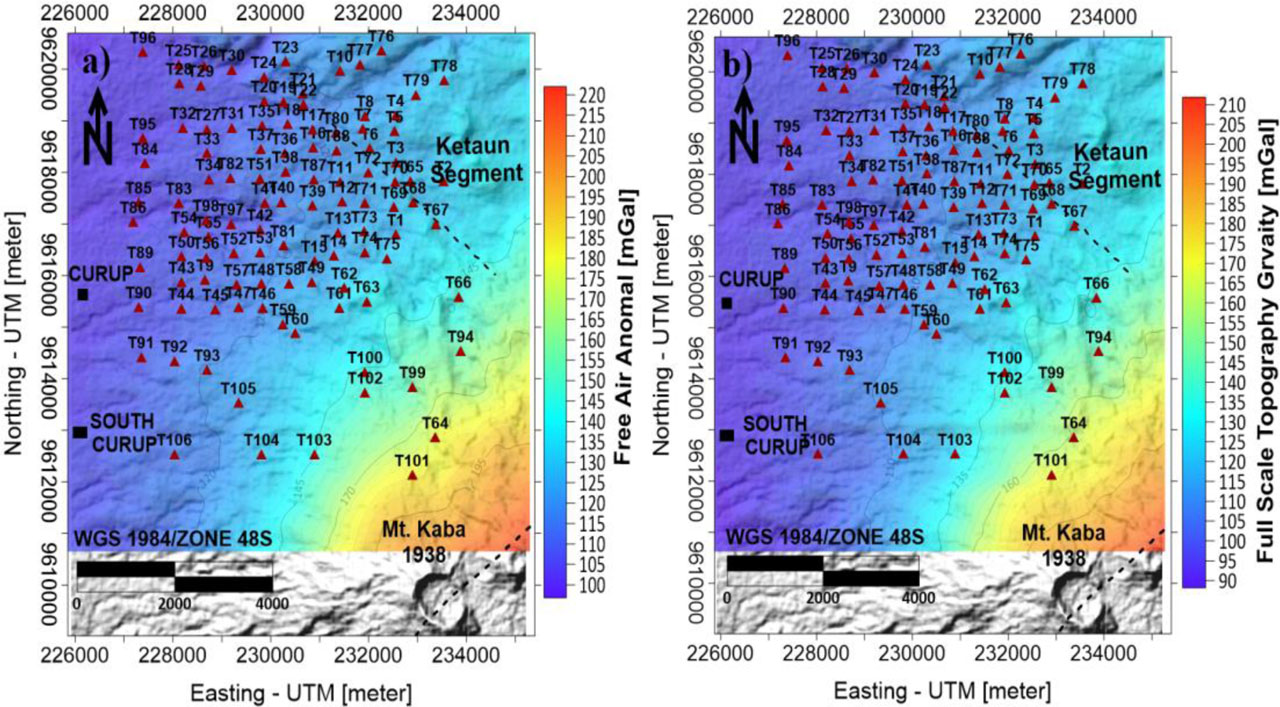
Figure 2:
Gravity data of the Curup–Rejang Lebong area: a) Gravity disturbance data equivalent to free-air anomalies; b) full-scale topographic gravity derived from SRTM2gravity data
3. Results and discussion
3.1. CBA analysis and spectral transformation
Fig. 3 shows CBA values ranging from 5 to 23 mGal. High anomalies are predominantly observed in the southern part of the study area. In contrast, low anomalies occur in the northern region—particularly across the Suban Curup Tourism Area, Curup, the Ketaun Segment zone, and most microtremor acquisition points. Moderate-to-high gravity anomalies are distributed around Mount Kaba and South Curup.
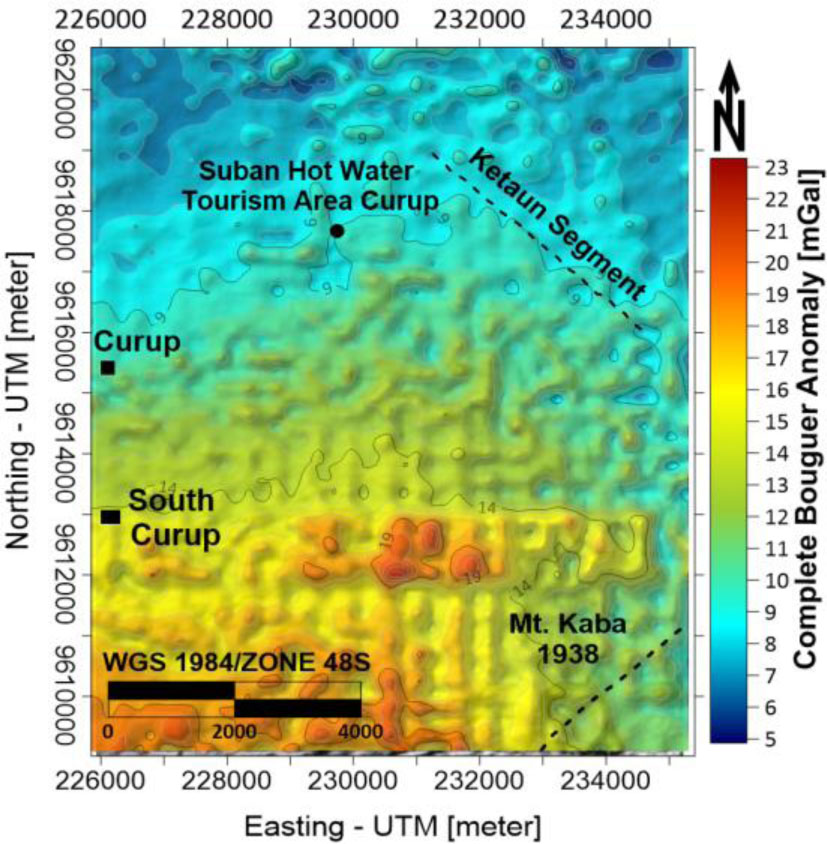
Figure 3:
Complete Bouguer anomaly (CBA) map of the Curup–Rejang Lebong area, Indonesia
The gravity anomaly contours exhibit a west–east pattern, consistent with the regional geological framework (Pohan et al., 2023). Circular high-positive anomalies, typically associated with extrusive volcanic rocks such as andesite and dacite, are common across Rejang Lebong Regency. Additionally, a strong anomaly response in the southern part of South Curup is linked to volcanic products of the alternating Rejang Lebong Formation. It may mark the boundary of the southern Bengkulu mountain zone.
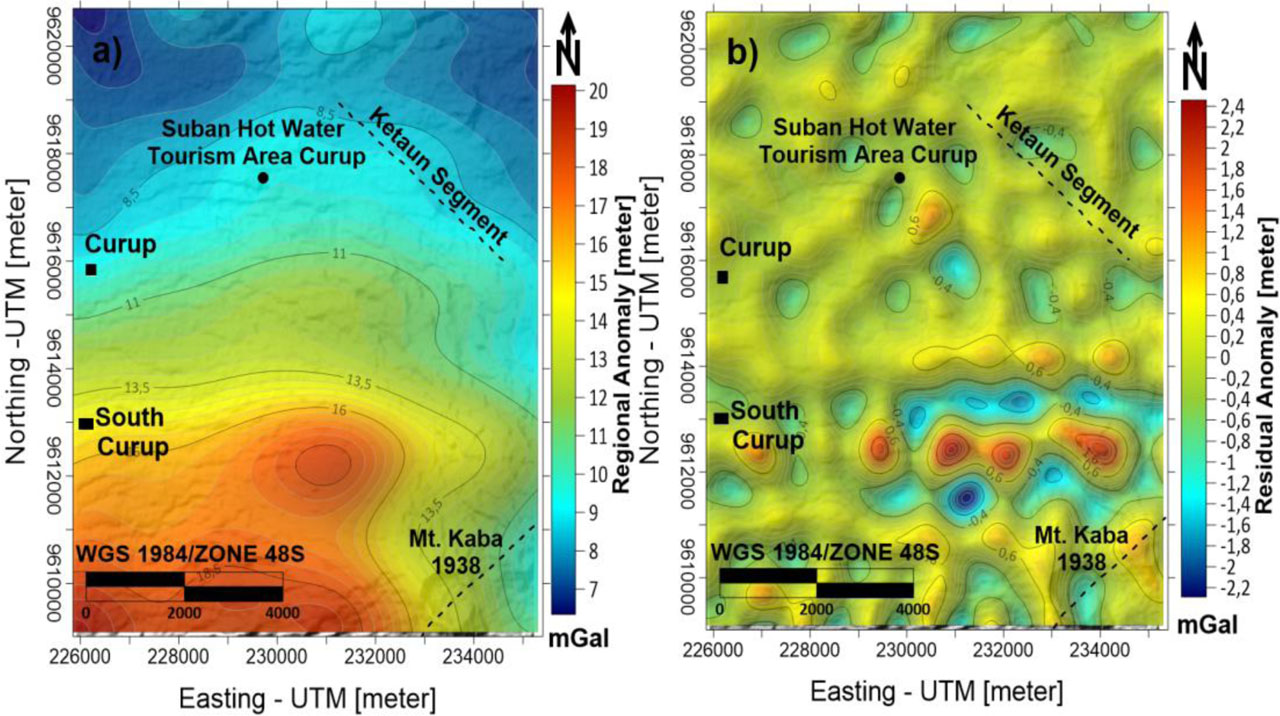
Figure 4:
Regional gravity anomalies of the Suban Curup–Rejang Lebong area derived from the radial averaging process: a regional component and b residual component
The subsurface structure of the study area can also be interpreted using gravity field data. Shallow geological features were identified from residual anomalies obtained through the FFT process. The gravity field was transformed from the spatial to the frequency domain using FFT, allowing the spectral characteristics of the signal to be examined (Pohan et al., 2023). Spectral analysis can, in theory, identify lithospheric discontinuities by detecting abrupt changes in the spectral curve’s slope. The slope values and the corresponding depth estimations for each structural zone are summarized in Table 1.
Table 1:
The results of the estimated depth values for each zone
| Zones | Gradient | Estimated depth [km] |
|---|---|---|
| Regional | −12.509 | 0.995 |
| Residual | −2.5968 | 0.206 |
| Noise | −1.3299 | 0.105 |
Based on the CBA results, a radial-average spectrum analysis was performed to separate the regional and residual components and estimate their respective depths. The contour configuration of the Curup–Rejang Lebong region is shown in Fig. 4. The analysis yielded an average regional depth of 0.996 km (Fig. 4a) and a residual depth of 0.207 km (Fig. 4b), which were adopted as reference parameters for the inversion process. The estimated depth values are in agreement with those of (Putri et al., 2025), with improved contour definition observed in the present analysis. The relationship between Ln A and k shows distinct high- and low-frequency trends, indicating the presence of deep and shallow discontinuity planes within the subsurface.
During upward continuation, spectral amplitude decreases with elevation, and the rate of attenuation varies with wavelength: high-frequency, short-wavelength components associated with shallow sources diminish faster than low-frequency, long-wavelength components associated with deeper sources. In this study, upward continuation was applied to the residual anomaly at heights of 0.8 km and 1.2 km. These values were selected based on the radial spectrum results, which identified shallow sedimentary layers at ~0.2 km and a regional depth of ~1 km. The continuation levels were chosen to evaluate the anomaly response, particularly for the residual component.
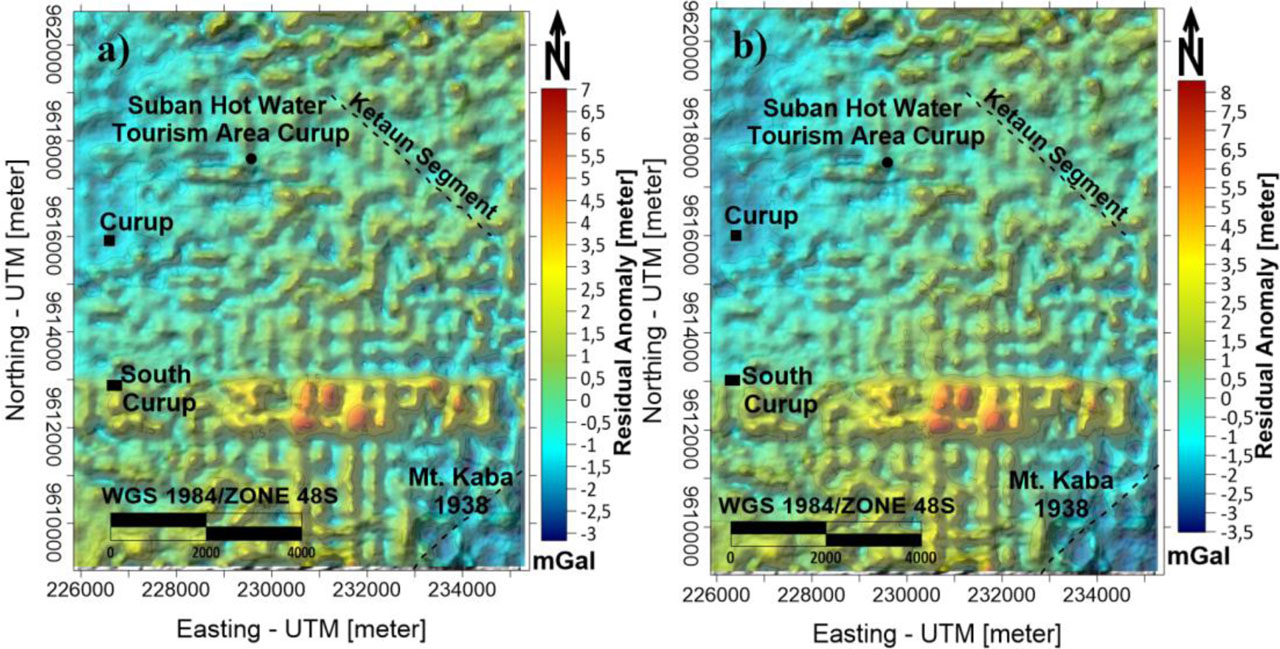
Figure 5:
Residual gravity anomalies of the Curup–Rejang Lebong area obtained by upward continuation from the ground surface: a) height of 0.8 km; b) height of 1.2 km
Fig. 5 presents the upward continuation of the residual gravity anomaly at different elevations. At 1 km, the anomaly ranges from −3 to 7 mGal (Fig. 5a), whereas at 2 km it varies from −3.5 to 8 mGal (Fig. 5b). Compared with the CBA and regional anomaly, the residual anomaly exhibits greater structural complexity, reflecting the strong influence of topographic variation within the study area.
Negative anomalies with west–east trending contours dominate the northern sector, particularly along the Ketaun Segment and the Suban Curup Hot Spring area, and are interpreted as geothermal reservoir zones covered by caprock formations. In contrast, the southern part is characterized by Mount Kaba, the principal geothermal heat source. Positive anomalies with circular-to-irregular patterns occur on the western flank of Mount Kaba, likely associated with andesitic–dioritic intrusive bodies (Widijono & Setyanta, 2007).
3.2. Gravity inversion modelling
The gravity inversion results for the Curup–Rejang Lebong area show good agreement between the observed and modeled gravity anomalies (Fig. 6). However, the modeled response appears smoother than the observed data due to the regularization applied during the inversion process. Residual anomalies at a depth of 1.2 km, characterized by smoother contour patterns, were selected as the most representative configuration for describing the geothermal structure of the study area. The optimization procedure produced error levels of 0.107% for the base model, 0.100% for the density model, 0.122% for the density model with Occam’s inversion, 0.875% for the high-block model, and 0.277% for the high-block model with Occam’s inversion. Based on the stratification model, an average density of 2.77287 g/cm3 was obtained. The density contrast ranged from 2.40 to 3.40 g/cm3, with notable spatial variations in the Ketaun Segment, Suban Curup area, and Mount Kaba, indicating heterogeneity in lithology and geothermal structure.
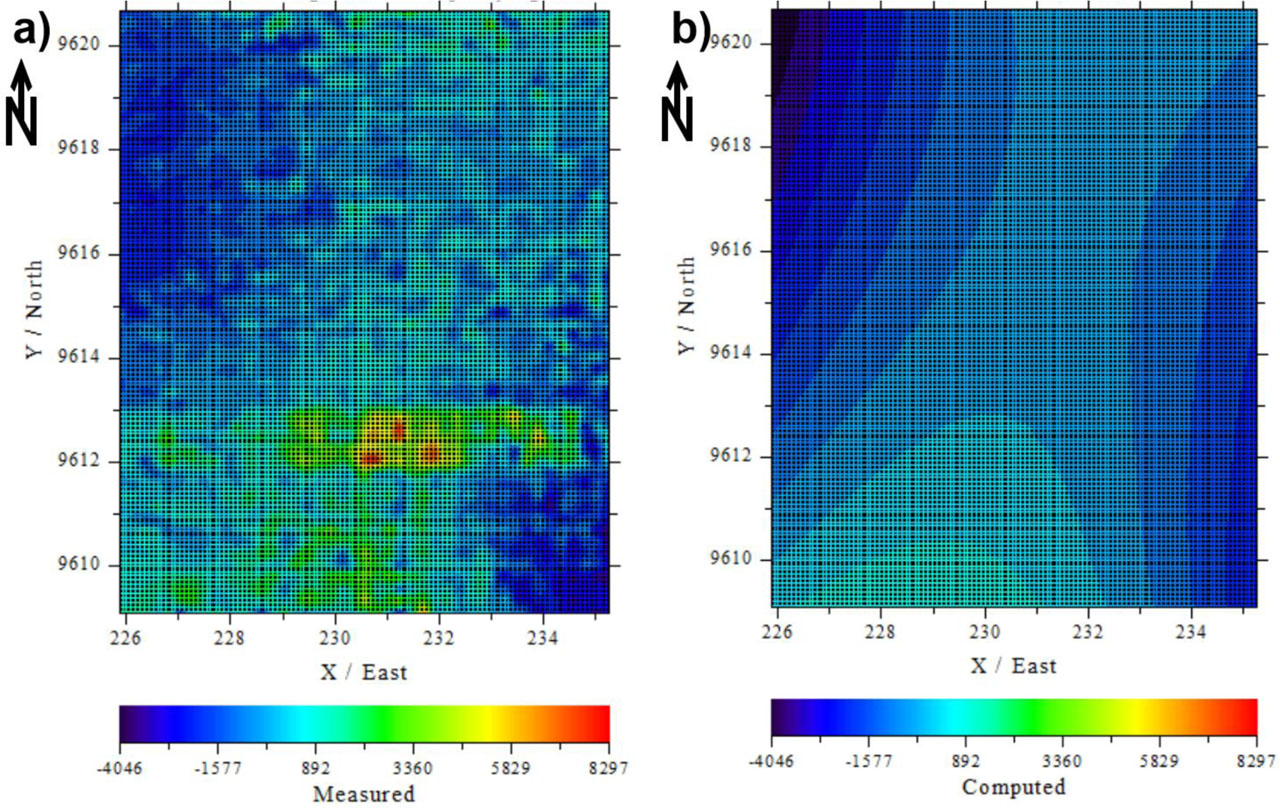
Figure 6:
Results of residual gravity anomaly inversion in the Curup–Rejang Lebong area: a) measurement data; b) prediction data
To interpret the subsurface configuration and identify structural controls on the geothermal system, four cross-sectional models were developed from the gravity inversion results. Two sections (A–A′ and B–B′) were designed perpendicular to the Ketaun Segment and the Suban Curup geothermal area, whereas sections C–C′ and D–D′ portray the reservoir–caprock geometry (Fig. 7). These cross-sections provide detailed insight into the contrasting density distributions and their relevance to geothermal manifestations.
Section A–A′ (x-direction; coordinates 9610–9611) shows a pronounced low-density anomaly interpreted as a potential magma chamber, characterized by a strong negative density contrast. This interpretation aligns with the volcanic geothermal system model described by Nicholson (1993), in which meteoric fluids infiltrate the slopes of Mount Kaba and circulate to depths where they form confined aquifers. These fluids subsequently rise along fault and fracture zones, emerging at the surface as hot springs (Sugianto et al., 2011). Section B–B′ (y-direction) reinforces this interpretation by clearly delineating the Suban Curup Hot Spring system, with a high-density caprock unit overlying a lower-density reservoir zone. Both A–A′ and B–B′ show low-density anomalies surrounded by higher-density rocks, consistent with the structural trace of the Ketaun Segment—known as the source of major earthquakes in Bengkulu and Curup–Rejang Lebong Mw 6.8 (Natawidjaja, 2003). The 85 km-long Ketaun Segment extends from Muara Aman through Tes to Ketahun (Natawidjaja, 2003) and is spatially adjacent to the hot spring zone, further underscoring its contribution to geothermal circulation.
The C–C′ (y-direction) and D–D′ (x-direction) profiles also portray reservoir and caprock interfaces. Their configurations are consistent with microtremor results, indicating low natural frequency and high amplification at coordinates 229–232 and 9610–9613—signatures characteristic of reservoir zones covered by impermeable layers. The caprock zone exhibits densities of 3.30–3.40 g/cm3, consistent with basaltic units (Telford, 1990), whereas the reservoir zone shows lower densities of 2.30–2.40 g/cm3, corresponding to rhyolitic to andesitic lithologies capable of high secondary porosity.
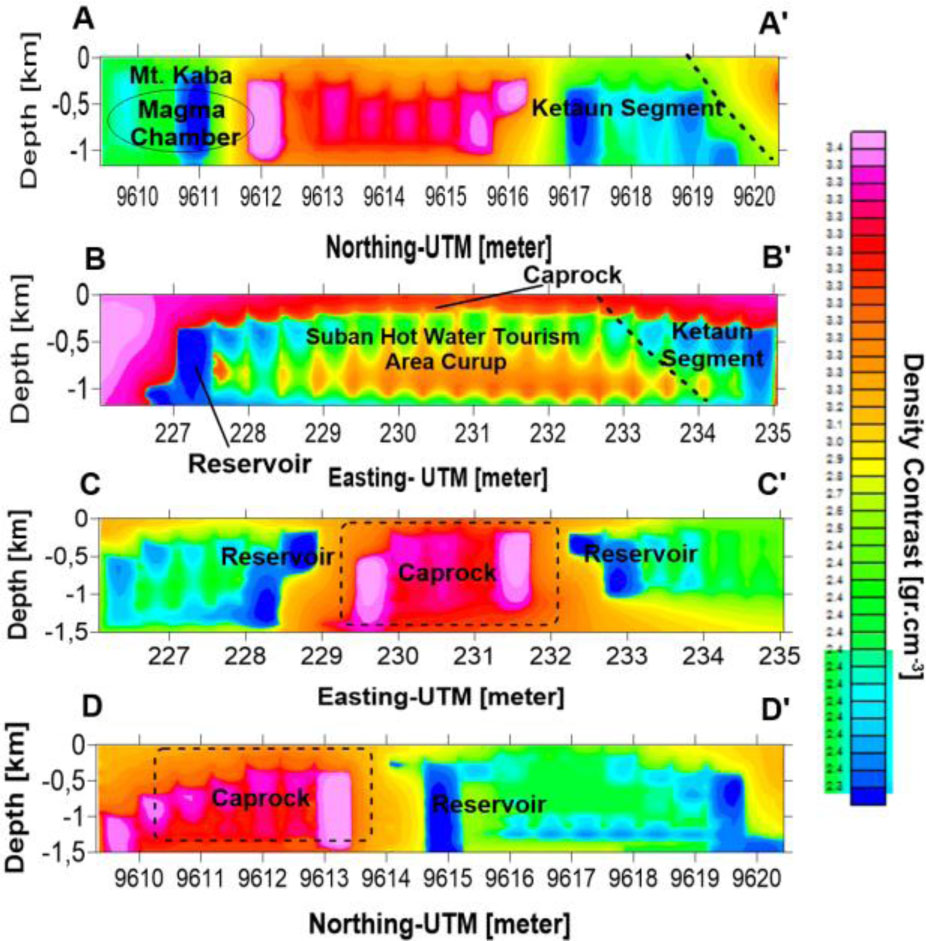
Figure 7:
Cross-sections of rock density contrast in the Curup–Rejang Lebong area based on 3D inversion
3.3. Natural frequency and amplification factor
The microtremor results complement the gravity inversion findings by providing additional constraints on the distribution of reservoir and caprock layers in the Curup–Rejang geothermal system. Fig. 8 shows that the f0 generally increases toward the east. The lowest f0 value of 1 Hz was recorded at point T91 (elevation 718.3 m, western sector), whereas the highest value was observed at point T99 (elevation 1173.1 m, eastern sector). This spatial trend in f0 is consistent with the density contrasts revealed by the 3D inversion: low-frequency values occur in areas interpreted as low-density reservoir zones, whereas high-frequency values correspond to dense, altered caprock units.
The dominant frequency is controlled by the depth of the seismic reflection plane, representing the interface between sedimentary formations and competent volcanic/igneous rocks (Haerudin et al., 2019). In the Suban Curup Hot Spring area, the Ketaun Segment, and the Mount Kaba zone, consistent f0 values of 7–10 Hz are observed. These values coincide with the high-density caprock blocks identified in the inversion cross-sections, reinforcing the interpretation of an impermeable unit that traps fluids above the geothermal reservoir. Based on Nakamura (1989), HVSR peaks between 7 and 10 Hz correspond to reservoir depths of approximately 50–200 m, further supporting the presence of shallow-to-intermediate geothermal reservoirs controlled by fault-related permeability.
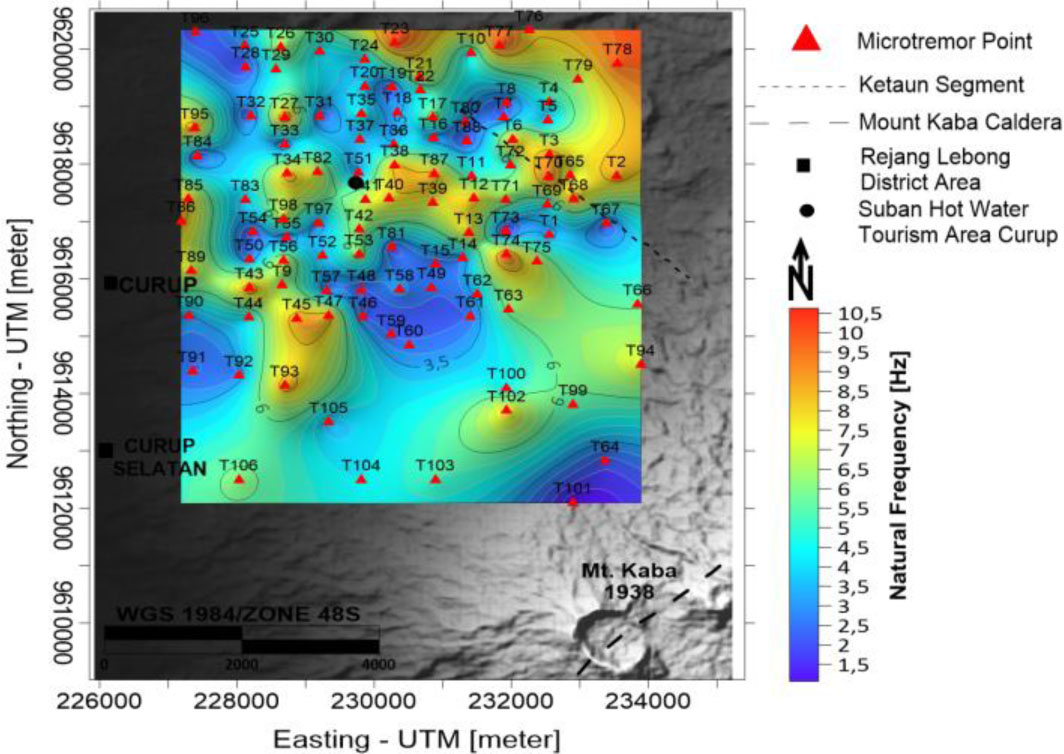
Figure 8:
Map of natural frequency
Table 2:
Determination of all parameters in the study for 106 H/V measured sites
| No | Measurement point | f0 [Hz] | A0 [-] | Kg [-] | H [m] |
|---|---|---|---|---|---|
| 1 | T1 | 3.21 | 1.86 | 1.07 | 31.17 |
| 2 | T2 | 9.14 | 3.91 | 1.67 | 10.94 |
| 3 | T3 | 9.11 | 6.67 | 4.88 | 10.98 |
| 4 | T4 | 5.17 | 7.34 | 10.42 | 19.36 |
| 5 | T5 | 3.47 | 2.54 | 1.86 | 28.82 |
| 6 | T6 | 9.05 | 4.78 | 2.52 | 11.05 |
| 7 | T7 | 2.38 | 2.01 | 1.70 | 41.95 |
| 8 | T8 | 2.56 | 3.37 | 4.44 | 39.03 |
| 9 | T9 | 6.48 | 4.24 | 2.78 | 15.44 |
| 10 | T10 | 4.47 | 3.09 | 2.14 | 22.35 |
| 11 | T11 | 5.16 | 12.51 | 30.33 | 19.38 |
| 12 | T12 | 8.64 | 4.78 | 2.65 | 11.57 |
| 13 | T13 | 8.44 | 6.36 | 4.79 | 11.85 |
| 14 | T14 | 2.94 | 3.70 | 4.65 | 34.03 |
| 15 | T15 | 2.61 | 2.74 | 2.88 | 38.27 |
| 16 | T16 | 2.98 | 4.38 | 6.44 | 33.55 |
| 17 | T17 | 6.73 | 6.92 | 7.12 | 14.87 |
| 18 | T18 | 3.18 | 3.24 | 3.30 | 31.43 |
| 19 | T19 | 2.13 | 4.32 | 8.79 | 47.05 |
| 20 | T20 | 4.13 | 3.33 | 2.68 | 24.18 |
| 21 | T21 | 7.57 | 3.85 | 1.96 | 13.21 |
| 22 | T22 | 4.95 | 4.54 | 4.16 | 20.20 |
| 23 | T23 | 10.74 | 5.96 | 3.31 | 9.31 |
| 24 | T24 | 4.04 | 2.00 | 0.99 | 24.78 |
| 25 | T25 | 3.15 | 4.94 | 7.74 | 31.74 |
| 26 | T26 | 7.13 | 6.47 | 5.88 | 14.02 |
| 27 | T27 | 10.12 | 3.29 | 1.07 | 9.88 |
| 28 | T28 | 1.90 | 2.37 | 2.95 | 52.69 |
| 29 | T29 | 5.09 | 4.27 | 3.58 | 19.65 |
| 30 | T30 | 4.30 | 4.04 | 3.79 | 23.25 |
| 31 | T31 | 2.34 | 4.22 | 7.61 | 42.74 |
| 32 | T32 | 2.20 | 4.13 | 7.76 | 45.53 |
| 33 | T33 | 2.44 | 5.27 | 11.39 | 40.93 |
| 34 | T34 | 9.06 | 5.67 | 3.55 | 11.04 |
| 35 | T35 | 5.04 | 4.37 | 3.78 | 19.83 |
| 36 | T36 | 3.51 | 5.79 | 9.56 | 28.51 |
| 37 | T37 | 3.52 | 5.47 | 8.50 | 28.42 |
| 38 | T38 | 8.92 | 3.41 | 1.30 | 11.22 |
| 39 | T39 | 7.54 | 7.56 | 7.58 | 13.26 |
| 40 | T40 | 8.34 | 8.76 | 9.20 | 12.00 |
| 41 | T41 | 7.43 | 6.27 | 5.28 | 13.46 |
| 42 | T42 | 6.75 | 2.33 | 0.81 | 14.81 |
| 43 | T43 | 9.50 | 7.90 | 6.58 | 10.53 |
| 44 | T44 | 4.33 | 3.47 | 2.78 | 23.10 |
| 45 | T45 | 9.20 | 6.37 | 4.41 | 10.87 |
| 46 | T46 | 2.49 | 3.35 | 4.49 | 40.11 |
| 47 | T47 | 9.13 | 4.62 | 2.34 | 10.96 |
| 48 | T48 | 2.37 | 4.45 | 8.38 | 42.23 |
| 49 | T49 | 2.63 | 3.09 | 3.61 | 37.97 |
| 50 | T50 | 2.58 | 4.48 | 7.76 | 38.74 |
| 51 | T51 | 3.06 | 5.14 | 8.64 | 32.70 |
| 52 | T52 | 3.70 | 3.53 | 3.37 | 27.02 |
| 53 | T53 | 6.76 | 5.33 | 4.20 | 14.80 |
| 54 | T54 | 2.22 | 2.64 | 3.14 | 45.01 |
| 55 | T55 | 2.62 | 3.53 | 4.74 | 38.13 |
| 56 | T56 | 7.91 | 7.85 | 7.78 | 12.64 |
| 57 | T57 | 2.66 | 5.54 | 11.52 | 37.60 |
| 58 | T58 | 3.34 | 4.91 | 7.22 | 29.91 |
| 59 | T59 | 2.42 | 3.97 | 6.53 | 41.33 |
| 60 | T60 | 2.66 | 4.69 | 8.27 | 37.66 |
| 61 | T61 | 2.56 | 5.49 | 11.78 | 39.03 |
| 62 | T62 | 3.73 | 2.75 | 2.03 | 26.78 |
| 63 | T63 | 6.39 | 2.56 | 1.02 | 15.66 |
| 64 | T64 | 2.21 | 3.85 | 6.71 | 45.30 |
| 65 | T65 | 6.96 | 2.57 | 0.95 | 14.37 |
| 66 | T66 | 5.84 | 8.29 | 11.77 | 17.13 |
| 67 | T67 | 2.31 | 3.64 | 5.75 | 43.35 |
| 68 | T68 | 9.03 | 1.90 | 0.40 | 11.07 |
| 69 | T69 | 4.55 | 1.82 | 0.73 | 21.96 |
| 70 | T70 | 10.13 | 4.02 | 1.60 | 9.88 |
| 71 | T71 | 6.92 | 2.80 | 1.13 | 14.46 |
| 72 | T72 | 5.05 | 4.73 | 4.42 | 19.79 |
| 73 | T73 | 0.98 | 4.23 | 18.26 | 102.0 |
| 74 | T74 | 10.44 | 1.96 | 0.37 | 9.57 |
| 75 | T75 | 7.44 | 4.47 | 2.69 | 13.45 |
| 76 | T76 | 8.59 | 2.08 | 0.50 | 11.64 |
| 77 | T77 | 10.70 | 3.07 | 0.88 | 9.35 |
| 78 | T78 | 10.15 | 7.00 | 4.84 | 9.86 |
| 79 | T79 | 6.81 | 4.32 | 2.73 | 14.68 |
| 80 | T80 | 3.04 | 1.94 | 1.24 | 32.94 |
| 81 | T81 | 2.08 | 3.72 | 6.65 | 48.05 |
| 82 | T82 | 7.57 | 3.01 | 1.20 | 13.21 |
| 83 | T83 | 3.73 | 3.65 | 3.57 | 26.84 |
| 84 | T84 | 2.03 | 3.28 | 5.29 | 49.26 |
| 85 | T85 | 8.64 | 1.44 | 0.24 | 11.57 |
| 86 | T86 | 8.85 | 4.50 | 2.28 | 11.30 |
| 87 | T87 | 8.84 | 4.42 | 2.21 | 11.30 |
| 88 | T88 | 2.02 | 5.17 | 13.20 | 49.46 |
| 89 | T89 | 7.63 | 3.19 | 1.33 | 13.11 |
| 90 | T90 | 3.32 | 8.22 | 20.35 | 30.11 |
| 91 | T91 | 2.47 | 1.98 | 1.59 | 40.47 |
| 92 | T92 | 2.91 | 2.40 | 1.98 | 34.32 |
| 93 | T93 | 9.26 | 7.00 | 5.29 | 10.80 |
| 94 | T94 | 7.63 | 3.64 | 1.74 | 13.10 |
| 95 | T95 | 9.32 | 6.98 | 5.22 | 10.73 |
| 96 | T96 | 2.00 | 3.45 | 5.95 | 50.05 |
| 97 | T97 | 2.93 | 3.42 | 3.99 | 34.17 |
| 98 | T98 | 7.64 | 2.38 | 0.74 | 13.09 |
| 99 | T99 | 5.75 | 3.11 | 1.69 | 17.40 |
| 100 | T100 | 4.64 | 1.19 | 0.31 | 21.57 |
| 101 | T101 | 1.05 | 3.50 | 11.65 | 95.09 |
| 102 | T102 | 8.35 | 10.06 | 12.12 | 11.98 |
| 103 | T103 | 5.51 | 4.77 | 4.13 | 18.14 |
| 104 | T104 | 4.52 | 1.72 | 0.66 | 22.14 |
| 105 | T105 | 3.66 | 2.05 | 1.14 | 27.29 |
| 106 | T106 | 6.37 | 2.64 | 1.09 | 15.69 |
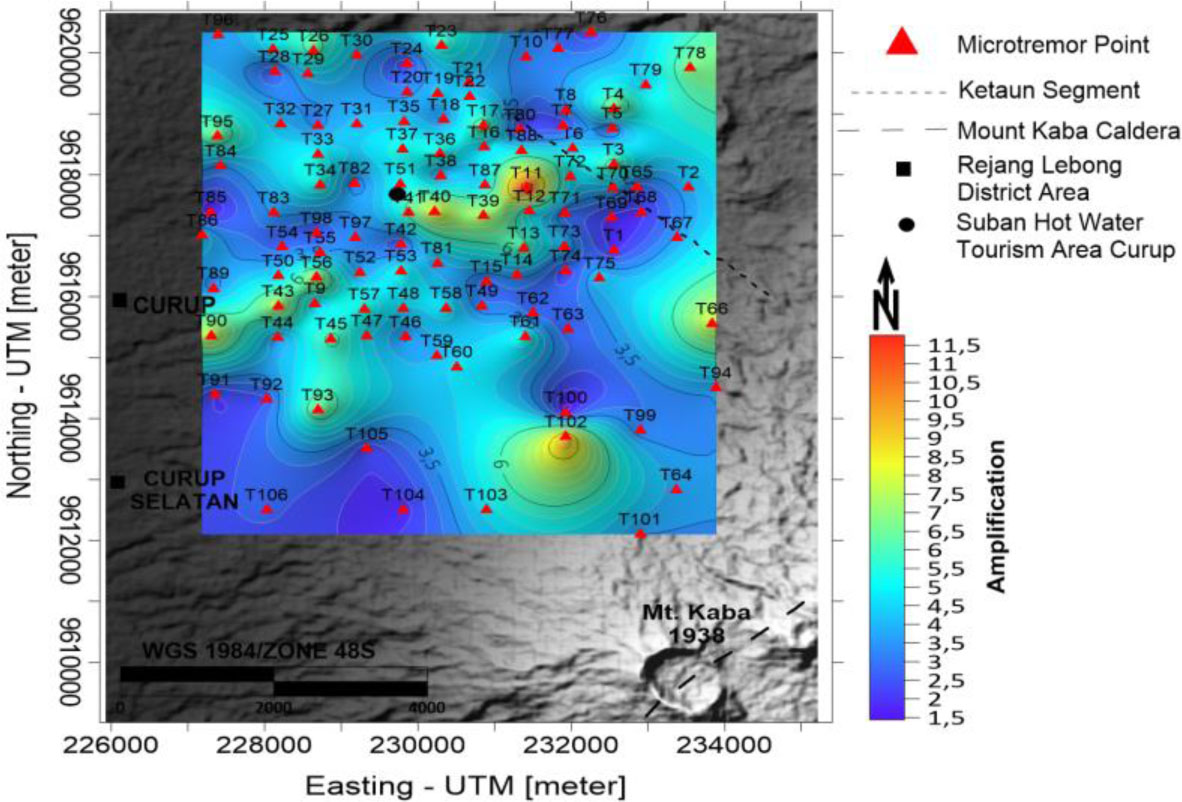
Figure 9:
Map of amplification
The spatial classification of f0 provides additional structural insight. Using Kanai’s (1983) classification, Type I (6.67–20 Hz) and Type II (4–6.67 Hz) dominate the eastern sector—particularly at T78, T77, and T23—and match the high-density, shallow-bedrock zones interpreted from the inversion results Susilo et al. (2024). These areas likely represent caprock composed of altered volcanic rocks with low permeability (Gupta & Roy, 2007). Conversely, low-frequency anomalies (1.5–4.5 Hz; Types III and IV) occur primarily in the western Suban region and correspond spatially to low-density zones identified in the 3D inversion. These are interpreted as reservoir units consisting of porous or fractured formations—such as volcanic breccia, tuff, sandstone, and limestone—that can store and transmit geothermal fluids.
The A0 strengthens this interpretation. Fig. 9 demonstrates that most of the Suban area exhibits a threefold amplification, with A0 values ranging from 1.07 to 12.51. The highest amplification values align with thick sediment deposits and altered or fractured rocks—features repeatedly associated with geothermal systems (Gupta & Roy, 2007; Haerudin et al., 2019). Based on Jiang et al. (2022), 30% of the sites fall into the low-amplification category, 57% into the medium category, 10% into the high category, and 3% into the very high category. The spatial pattern mirrors the gravity-derived reservoir model: high-amplification zones—especially around points T40, T78, T11, T66, and T90—correspond to the low-density reservoir blocks in the 3D inversion.
Structural control is evident. The Ketahun Fault (mapped as a dotted line) aligns with several high-amplification zones, suggesting that this fault acts simultaneously as a mechanical weak zone and a pathway for hydrothermal fluid migration (Ingebritsen & Manning, 1999). The Suban Curup Hot Spring is located within this high-A0 region, confirming the presence of active fluid upflow along the fault zone. The combined signatures—low f0, high A0, proximity to major faults, and surface manifestations—collectively indicate reservoir development controlled by fault permeability and volcanic heat input from Mount Kaba.
3.4. Seismic vulnerability
The Kg was calculated using the equation proposed by Siburian et al. (2024) as shown in Equation (2), yielding values ranging from 2 to 26 across the study area (Fig. 10). The highest Kg values are concentrated around points T90, T66, T61, T11, and T73. Notably, these locations spatially coincide with areas exhibiting high A0 (Fig. 9), reinforcing the relationship between seismic vulnerability and amplification response. This agreement between the two microtremor parameters suggests the presence of soft, weak, or hydrothermally altered formations in the subsurface (Gupta & Roy, 2007). High Kg values are typically associated with thick sedimentary layers, intensely weathered volcanic rocks, and zones affected by hydrothermal alteration—all of which are favorable for geothermal fluid storage and circulation. In geothermal systems, alteration serves as an indicator of interaction between hydrothermal fluids and host rocks, weakening the lithological fabric while enhancing porosity and permeability (Franco, 2009).
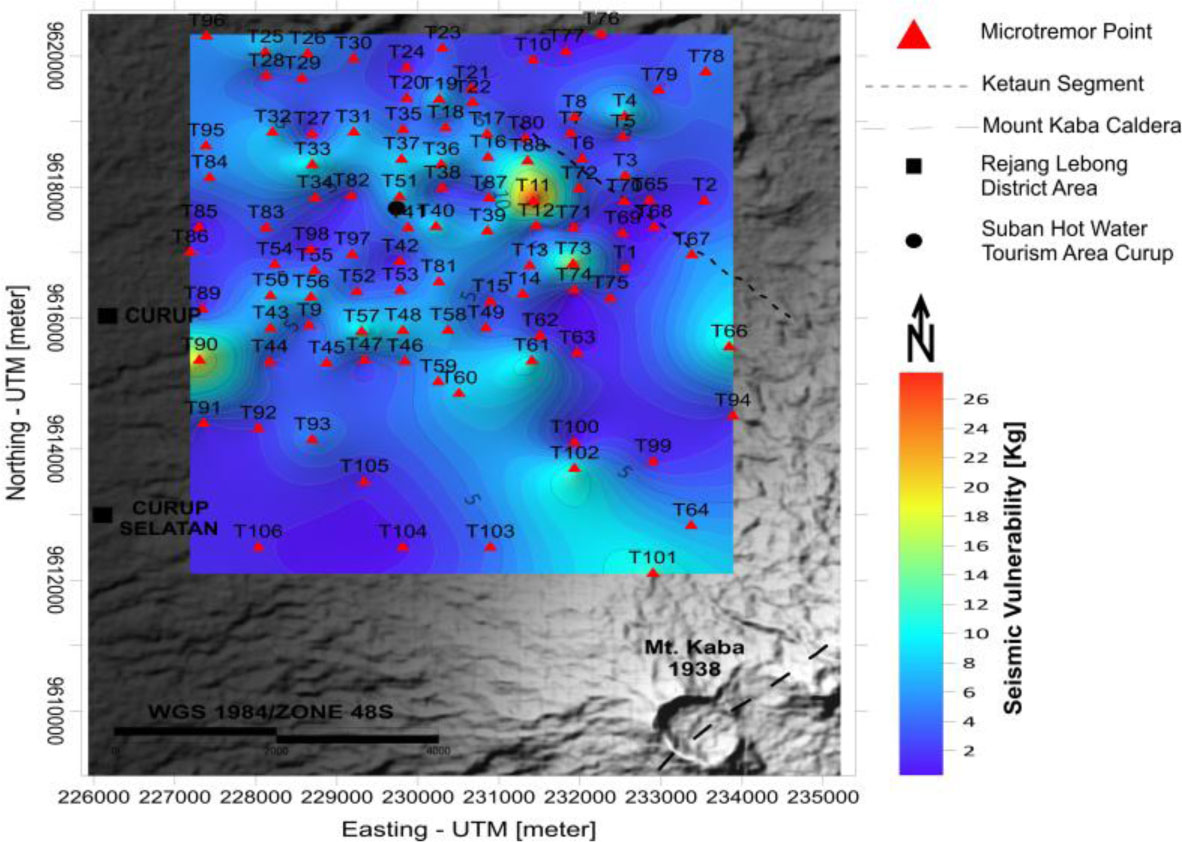
Figure 10:
Same as Figure 9, but for the spatial distribution of seismic vulnerability
To support spatial interpretation, Kg values were classified into four categories: low (Kg ≤ 3), medium (3 < Kg ≤ 5), high (5 < Kg ≤ 10), and very high (Kg > 10) (Amaliyah et al., 2017). Based on this classification, 47% of the sites fall in the low category, 22% in the medium, 20% in the high, and 11% in the very high category (Fig. 10). A clear spatial pattern emerges: high and very high Kg values (> 5) dominate the western part of the study area, where low f0 and high A0 values indicate thick and weak sedimentary layers. Conversely, low Kg values (< 3) are concentrated in the eastern highlands, characterized by hard rock formations with high f0 and low amplification—consistent with caprock interpreted from the 3D gravity inversion (Susilo et al., 2024).
Among all locations, point T11 stands out as a critical geothermal target. The area exhibits very high Kg values, lies close to the Suban Hot Spring, and is situated along the active Ketaun Fault Segment—a major permeable pathway for deep hydrothermal fluids (Sibson, 1996). The extremely high vulnerability index in this zone suggests significant fracturing or hydrothermal alteration, which is spatially consistent with the low-density reservoir blocks identified from the 3D gravity inversion. Furthermore, the proximity of this zone to the Mount Kaba Caldera provides additional evidence supporting its interpretation as part of the geothermal reservoir system. Calderas typically develop extensive fracture systems and retain residual magmatic heat beneath the surface—key drivers of volcanic-type geothermal systems (Hochstein & Browne, 2000). In this context, fractures generated by tectonic deformation along the Ketaun Fault and caldera-related fracturing likely interact to form zones of high permeability that sustain geothermal fluid circulation.
Collectively, the spatial distribution of Kg complements the 3D inversion and HVSR results by identifying structurally weak, fractured, and altered zones that coincide with low-density reservoirs, low f0, and high A0 anomalies. These overlapping geophysical signatures confirm the presence of an active geothermal system in the Curup–Rejang region. Therefore, areas with high and very high Kg—particularly around T40, T78, T11, T66, and T90—represent potential geothermal targets that warrant further geophysical exploration using magnetotelluric (MT) or resistivity imaging to determine reservoir geometry with greater precision.
3.5. Sediment thickness
The estimated sediment thickness across the study area ranged from 10 m to 70 m, with the greatest thickness reaching 102 m at point T73, located between the Suban Hot Spring zone and the Ketaun Fault Segment (Fig. 11). This spatial pattern is consistent with the earlier 3D inversion results, which identified low-density blocks in the same region, as well as with the microtremor signatures—low f0, high A0, and high Kg. Collectively, these geophysical indicators confirm that the thick sedimentary deposits in this zone represent permeable reservoir units filled by volcanic–sedimentary materials capable of storing geothermal fluids. Reservoir functionality is further enhanced when these sediments are covered by impermeable rocks acting as caprock, forming an effective geothermal trap (Hochstein & Browne, 2000).
In contrast, areas with low sediment thickness (10–30 m), such as T51, T82, and T37 around the Suban tourism area, indicate shallow bedrock. These zones spatially correspond to the high-density blocks observed in the 3D gravity inversion and to high f0 and low A0 values (Type I–II). This geophysical configuration reflects compact, low-porosity lithologies—such as solidified lava or intrusive bodies from Mount Kaba—that serve primarily as heat sources rather than fluid reservoirs. Thus, although these shallow-bedrock zones contribute thermally to the system, their low porosity and weak fracture connectivity limit their ability to store and transmit geothermal fluids.
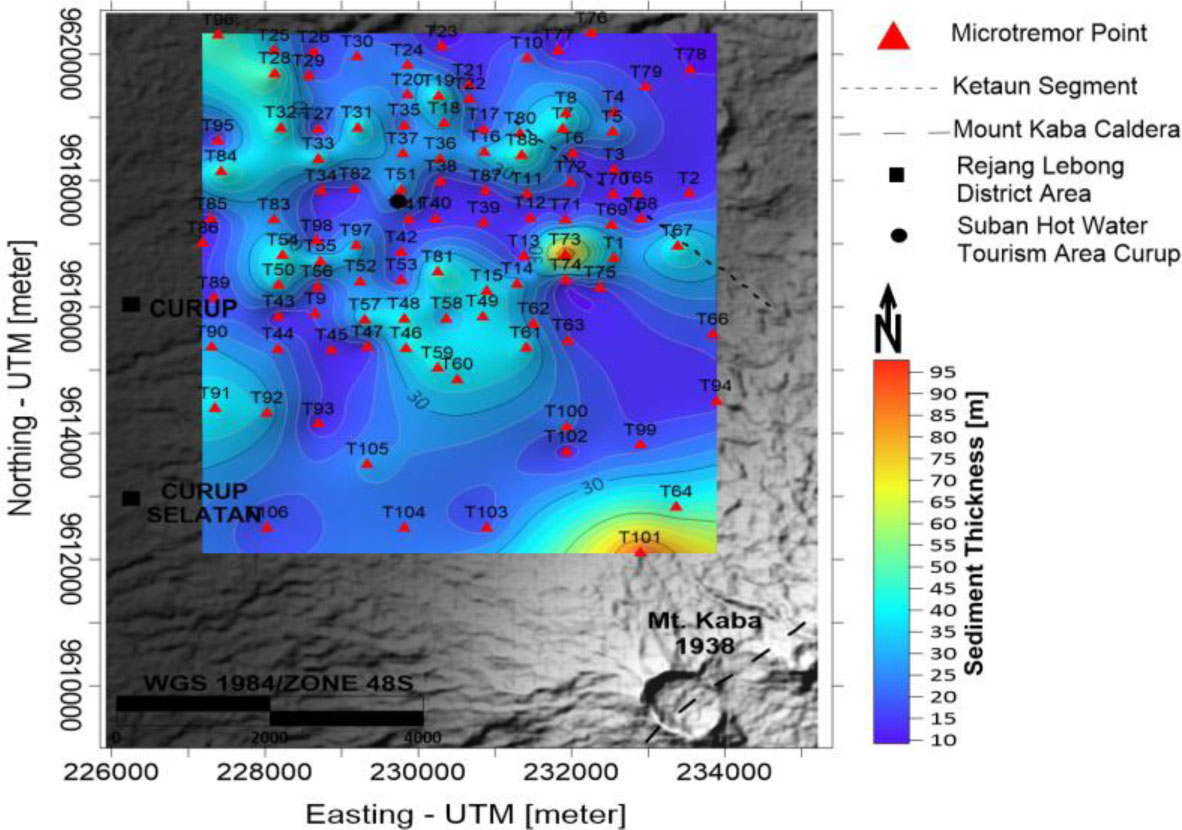
Figure 11:
Same as Figure 9, but for the spatial distribution of sediment thickness
The most significant geothermal manifestations occur in transition zones characterized by moderate to high sediment thickness—such as the Suban area. These transition zones coincide with high A0 and high Kg values, indicating that geothermal fluids migrate upward along fracture zones and faults before discharging at the surface. In this context, sediments of moderate to high thickness act as effective conduits and accumulation zones for hydrothermal fluids circulating upward from deeper heat sources (Franco, 2009). The alignment of these geothermal manifestations with structural discontinuities strengthens the idea that the Ketaun Fault plays a dominant role in controlling fluid pathways.
This configuration is consistent with the model proposed by Saylor and Horton (2014), which predicts that high sediment thickness is commonly observed in volcanic basins or grabens formed by earlier tectonic and volcanic processes. These depressions are infilled with volcanic and alluvial deposits, forming high-permeability geothermal reservoirs. Therefore, in the Curup–Rejang system, regions with greater sediment thickness—particularly around T73, T66, and T90—are the primary reservoir zones. In contrast, areas with thin sediments represent zones closer to the geothermal system’s heat source.
3.6. Interpretation of geothermal potential
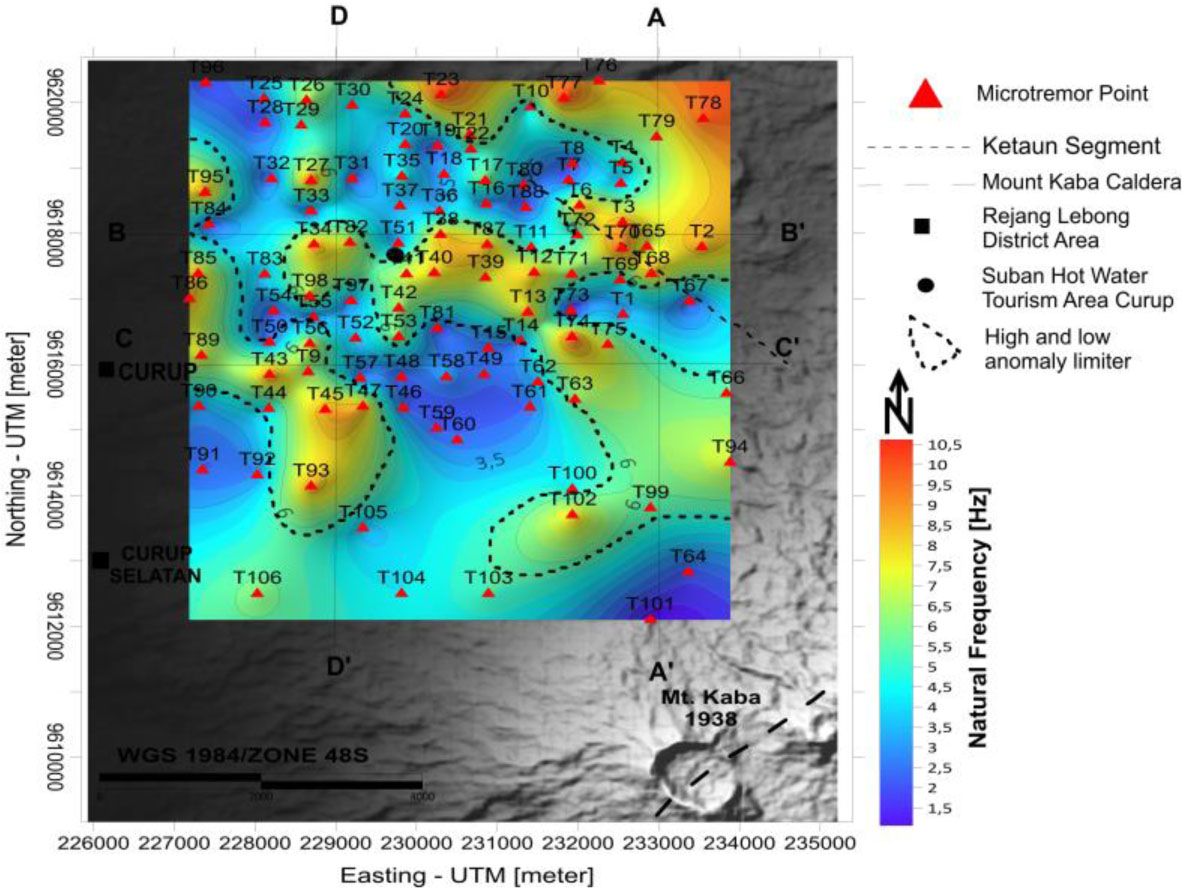
Figure 12:
Natural frequency distribution map of the Curup–Suban area based on microtremor measurements. Dashed black boundaries represent high- and low-anomaly zones. Profile lines A–A′, B–B′, C–C′, and D–D′ are shown for further subsurface interpretation
Fig. 12 clearly shows the boundary between the high- and low-anomaly zones. High anomaly values correspond to dense, impermeable formations, such as caprock units, that trap and seal the geothermal reservoir. These units are typically composed of hydrothermally altered lithologies such as shale (mudstone), claystone, halite, and anhydrite (Gupta & Roy, 2007). Surrounding the caprock, low anomaly zones indicate the presence of potential reservoir rocks. These low-density domains generally occur at greater depths and are associated with loose or intensely fractured formations—such as sandstone, limestone, dolomite, and fractured volcanic products—which provide both storage capacity and pathways for geothermal fluid circulation.
The pattern observed in the density and gravity anomaly maps is highly consistent with the conceptual structure inferred from the 3D inversion. The Suban Curup region is dominated by low densities (2.4–2.6 g/cm3) and negative gravity anomalies, which align with the reservoir blocks identified in the 3D model and coincide spatially with low f0, high A0, and high Kg zones. These independent geophysical signatures collectively indicate hydrothermally altered rock units that are fractured, permeable, and saturated—typical characteristics of productive geothermal reservoirs (Gafoer et al., 2007; Telford et al., 1990). In contrast, the Mount Kaba area exhibits higher densities and positive gravity anomalies, consistent with magmatic intrusion as the system’s primary heat source.
Structural control further strengthens this interpretation. The Ketaun Fault Segment, which cuts across the study area, appears to play a dominant role in transporting deep hydrothermal fluids to shallower reservoir zones (Sillitoe, 2010). The spatial overlap of the fault trace with high sediment thickness, low f0, high A0, and high Kg values demonstrates that tectonic deformation enhances fracture permeability, allowing geothermal fluids to accumulate and migrate. The Suban Hot Spring, situated along this fault-controlled permeability corridor, represents direct surface evidence of this system. Together, these relationships suggest a geothermal system governed by a volcanic heat source (Mount Kaba), a structurally controlled reservoir (Suban Curup basin), and an impermeable caprock that seals the system.
Collectively, 3D inversion, HVSR frequency–amplification attributes, seismic vulnerability, and sediment thickness mapping form a consistent conceptual model of the Curup–Rejang geothermal system. The western Suban region—especially the zones around T11, T73, T66, T78, and T90—exhibits the strongest reservoir characteristics and represents the most likely geothermal target. These findings indicate that the area is suitable for advanced exploration, including high-resolution resistivity or MT imaging, geochemical surveys, and exploratory drilling to validate reservoir geometry and production capacity.
To address these limitations, future studies should integrate complementary geophysical methods capable of directly imaging fluid distribution and permeability pathways. High-resolution magnetotelluric (MT) and electrical resistivity tomography (ERT) surveys would improve the delineation of reservoir and caprock boundaries with greater confidence. Seismic reflection surveys or passive seismic tomography could further constrain fracture systems associated with the Ketaun Fault and the Mount Kaba magmatic complex. Integration of geophysical observations with geothermal fluid geochemistry would provide additional constraints on reservoir temperature, permeability evolution, and subsurface fluid circulation. In addition, thermal remote sensing techniques using Thermal Infrared Sensor (TIRS) data from Landsat 8/9 or ASTER imagery could be employed to derive Land Surface Temperature (LST) maps. The integration of surface thermal anomalies with subsurface density contrasts and fault structures identified from gravity inversion would provide an independent means of validating hydrothermal fluid pathways and improving the spatial characterization of geothermal manifestations. Furthermore, numerical geothermal reservoir modelling and drilling validation are essential for constraining reservoir depth, thickness, and production potential. Such multidisciplinary approaches would reduce exploration uncertainty and contribute to a more reliable assessment of the geothermal resource potential and economic feasibility of development within the Curup–Rejang Lebong geothermal area.
4. Conclusion
Integrated satellite gravity analysis and HVSR microtremor measurements successfully delineate the key components of the geothermal system in the Curup–Rejang Lebong region, Indonesia. The combined interpretation identifies a structurally controlled geothermal system consisting of a low-density and highly permeable reservoir in the western Suban sector, a dense and relatively impermeable caprock in the eastern sector, and a magmatic heat source associated with Mount Kaba. The spatial alignment of these features along the Ketaun Fault indicates that the fault acts as the principal pathway for heat and fluid migration, linking the deep heat source to shallow geothermal manifestations, including the Suban Hot Spring. The strong agreement between gravity inversion, HVSR parameters, and sediment-thickness distribution demonstrates the effectiveness of integrating multiple geophysical datasets for geothermal exploration. This integrated approach reduces subsurface uncertainty and provides a more reliable framework for identifying reservoir boundaries, permeability pathways, and geothermal targets in areas where direct subsurface information is limited.
From a geothermal development perspective, the results highlight the western Suban area as the most prospective target for future exploration and resource assessment. The identified reservoir–fault–heat source configuration suggests favorable conditions for sustainable geothermal exploitation and provides a scientific basis for prioritizing detailed exploration activities. These findings contribute valuable information for reducing exploration risk, supporting investment decisions, and advancing the development of geothermal energy as part of Indonesia’s renewable energy transition.
Despite these promising results, several limitations remain, including the non-uniqueness of gravity inversion, the sensitivity of HVSR measurements to ambient noise conditions, and uncertainties associated with empirical sediment-thickness estimation. Future studies should incorporate higher-resolution geophysical methods, such as magnetotelluric (MT) and electrical resistivity tomography (ERT), together with geochemical investigations and exploratory drilling, to further constrain reservoir geometry, permeability distribution, and temperature conditions.
Acknowledgements
The authors would like to thank Curtin University for providing free and legal access to the high-resolution GGMplus 2013 and SRTM2gravity models. This research was funded by the Directorate of Research and Community Service (DPPM), Ministry of Higher Education, Science, and Technology of the Republic of Indonesia (Kemdiktisaintek), Fiscal Year 2025, under the Master’s Thesis Research Scheme, Contract No. 060/C3/DT.05.00/PL/2025. The authors gratefully acknowledge this financial support.
Notes
[1] Contributed by Author Contributions
P.K.P. conceived and designed the study, conducted the experiments, collected the data, and performed the analysis. M.M. supervision, data interpretation, and manuscript drafting. A.F.P. supervision, data interpretation, and manuscript drafting. A.M.L. guidance and supervision of data collection at measurement points 1–100 during the initial stage of the research. B.I.S. initial microtremor data acquisition. All authors critically reviewed and approved the final version of the manuscript and agreed to be accountable for all aspects of the work.