

1. Introduction
The rock creep property refers to the damage phenomenon of which the stresses and strains in the rock change when subjected to a constant external load. Rock creep is one of the important causes of large deformation and even instability in large-scale projects such as rock underground engineering, infrastructure construction and engineering slopes. Many large-scale geotechnical engineering structures have service lives spanning decades or even centuries. Following the completion of engineering construction, rock creep failure may not occur immediately. However, creep deformation gradually accumulates over time, ultimately leading to creep-induced disaster. This creep-induced disaster has been verified in many research and real cases (Wei, 2021; Hashiba et al., 2024).
Rock creep is roughly divided into 3 stages, as shown in Figure 1. (1) Initial creep or transition creep, strain increases with time, but the rate of increase gradually slows down. (2) Steady creep or constant creep, strain increases uniformly with time continuation, this phase is long. (3) Accelerated creep, accelerated increase in strain over time, up to the rupture point.
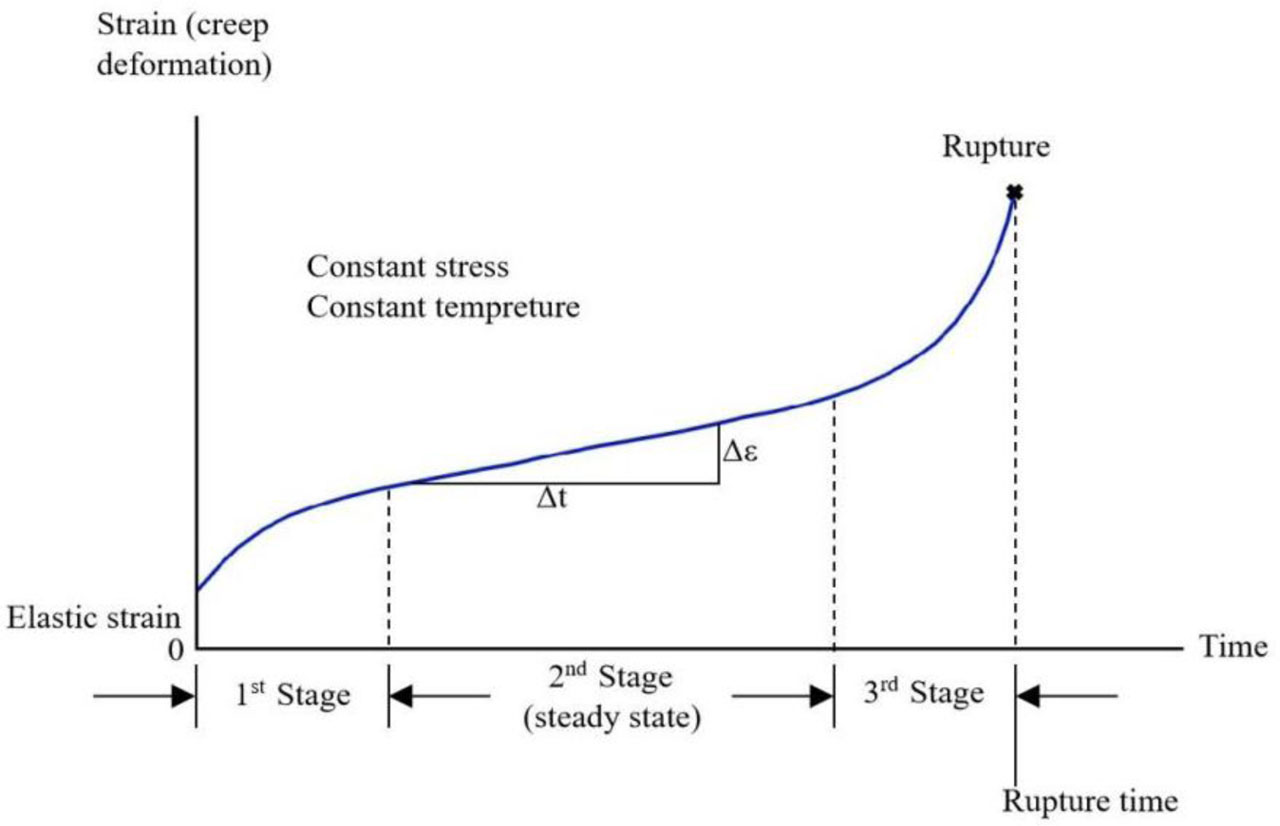
Figure 1:
Creep curves for the 3 stages
Extensive domestic and international research on rock mass creep testing has demonstrated that: Most rocks exhibit viscoelastic solid properties at low stress levels, and rock deformation is mainly manifested in the attenuation of the initial creep to steady creep. When the loading stress exceeds a certain value, it is mostly manifested as a viscoplastic fluid state, which in turn produces accelerated creep and damage (Huang et al., 2024; K. Li et al., 2024).
Under different stress conditions, the creep curves will show different characteristics. As shown in Figure 2, when σ = σ1, rock exhibits only initial creep and steady creep. When σ=σ2, the rock exhibits a complete three-stages creep curve. When σ = σ3, rock exhibits only steady creep and accelerated creep. For rocky slopes, the rock stress environments vary according to the burial depths, therefore, the manuscript suggests that the same rock within the slope should have different creep properties at different burial depths. The manuscript takes the Dadu River Crossing Bridge engineering slope in southwest China as the research object, exploring the rock creep patterns at different burial depths. Firstly, based on the octahedral strength theory, the rock creep patterns under different stress states (stress state=rock stress/rock strength*100%) was summarized. Then, the values of rock strength parameters were calculated in conjunction with the Hoek-Brown strength criterion. Next, numerical modelling is carried out to obtain the stress values of rock at various depths. Finally, the creep behaviour of the rock within the slope at different burial depths is determined.
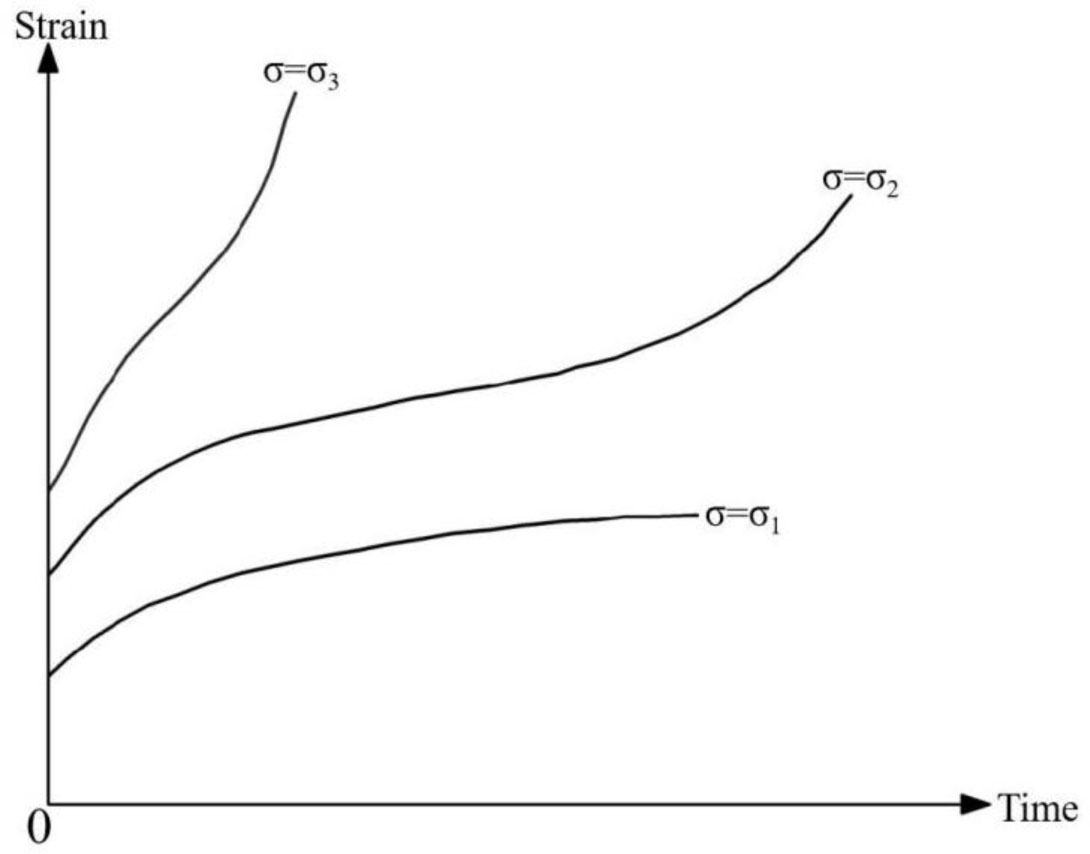
Figure 2:
Typical creep curves
1. Methodology
2.1. Analysis of Rock Creep Patterns Based on Octahedral Strength Theory
The unit cell shown in Figure 3 is an isotropic octahedron, which was proposed by ROS et al. (1923) and Nadai (1933), and applied to the derivation of octahedral shear stress strength theory. The octahedral stress is named after the geometric body formed by eight equally inclined planes, where the angles between the normal vectors of these planes and the three principal stress axes (σ1, σ2, σ3) satisfy cosα = cosβ = cosγ (Zhang et al., 2023; Sarah et al., 2024; Tang et al., 2024).
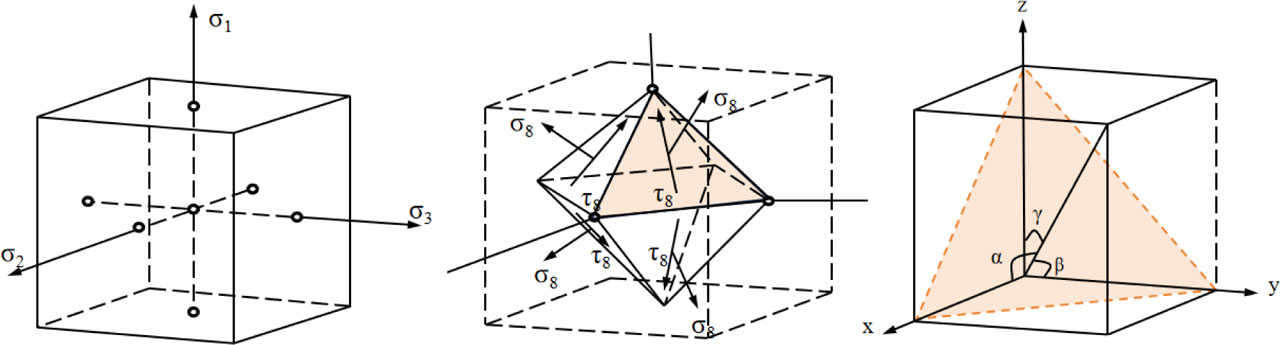
Figure 3:
Principal stress cells and isotropic octahedra
The assumption of the octahedral shear stress theory is that whether a material reaches a hazardous state depends on the octahedral shear stress. The theory assumes that when rock reaches the critical point of a dangerous state, its octahedral shear stress is τost. Under any state, if the rock's octahedral stress value is less than τost, the rock is in a stable state. Conversely, if the rock's octahedral stress value is greater than or equal to τost, the rock fails (Zhang et al., 2011; Xu et al., 2022), as shown in Equation (1):
Citation: The octahedral stresses σoct and τoct are defined as the normal stress component and shear stress component acting on planes (referred to as octahedral planes) oriented at equal angles to their respective principal stress directions, as shown in Figure 3. σoct and τoct in any state of stress can be expressed as Eq. (2):
Under isostatic triaxial stress conditions, when rock is in a critical state: σ2 = σ3, σ1 = σc (σc is the compressive strength of rock at the point of critical failure). The octahedral stress of the rock at this point is calculated as:
Under isostatic triaxial stress conditions, σ2 = σ3, where σ1 is the maximum principal stress. The octahedral stress of the rock at this point is calculated as:
Combining Eq. (3) and Eq. (4), when the current stress state of the rock is less than the critical value of its hazardous state (τoct1 = τoct2), the rock is in a stable condition. When the current stress state of the rock is greater than or equal to the critical value of its hazardous state (τoct1≤τoct2), the rock is damaged.
The term “fracture” as described above refers to damage in a macroscopic sense, meaning that the rock has experienced phenomena such as fracture/displacement at its points of weakness (typically along shear planes), or has undergone significant displacement. However, rock failure manifests not only in this way. Under prolonged stress conditions, rocks also gradually undergo displacement, known as rock creep. Even when the stress environment surrounding the rock is below its critical stress value, rock will still exhibit creep. Based on this, the manuscript analyses a large volume of rock creep test data from both domestic and international sources. By comparing the relationship between the stress environment during testing and the inherent strength of the rock itself, the manuscript summarizes the creep behaviour of rock under different stress conditions.
Through the search and collection of a large number of data on the rock creep tests (Han et al., 2007; Liang et al., 2018; Li, 2019; Yan et al., 2008; Gong, 2011; Yang et al., 2021; He, 2016; Zeng et al., 2016; Xu, 2016; Su et al., 2018; Wang et al., 2018; Ma et al., 2021), after generalization and collation, finally obtained the creep patterns of different rocks under different stress states, as shown in Table 1.
Table 1:
Creep patterns of different rocks under different stress states
| Rock classification | Rock name | Case | σc [MPa] | Loading conditions/MPa | Composite stress σ [MPa] | Creep behaviour | σ/σc [%] | |
|---|---|---|---|---|---|---|---|---|
| σ1 | σ2=σ3 | |||||||
| I | granite, diorite, basalt, gneiss, quartzite, etc. | granite | 69.38 | 42 | 5 | 37 | Initial-Steady creep | 53.3 |
| 92 | 5 | 87 | Initial-Steady-Accelerated creep | 125.4 | ||||
| gneiss | 109.5 | 50 | 10 | 40 | Initial-Steady creep | 36.5 | ||
| 190 | 10 | 180 | Initial-Steady-Accelerated creep | 164.4 | ||||
| II | limestone, dolomite, etc. | limestone | 56.07 | 12 | 0 | 12 | Initial-Steady creep | 21.4 |
| 55.2 | 0 | 55.2 | Initial-Steady-Accelerated creep | 98.4 | ||||
| III | marble, slate, calcareous sandstone, ferruginous sandstone, etc. | marble | 80 | 90 | 40 | 50 | Initial-Steady creep | 62.5 |
| 90 | 10 | 80 | Initial-Steady-Accelerated creep | 100.0 | ||||
| calcareous sandstone | 42 | 39.8 | 2 | 37.8 | Initial-Steady-Accelerated creep | 90.0 | ||
| gritstone | 53.32 | 27.16 | 0 | 27.16 | Initial-Steady creep | 50.9 | ||
| 52.15 | 0 | 52.15 | Initial-Steady-Accelerated creep | 97.8 | ||||
| IV | mica schist, kyanite, etc. | kyanite | 12.25 | 8.01 | 0 | 8.01 | Initial-Steady creep | 65.4 |
| 12.82 | 0 | 12.82 | Initial-Steady-Accelerated creep | 104.7 | ||||
| V | mudstone, shale, sandstone, conglomerate, tuff, etc. | mudstone | 15.95 | 15 | 0 | 15 | Initial-Steady-Accelerated creep | 94.0 |
| siltstone | 22.3 | 5 | 0 | 5 | None | 22.4 | ||
| 10 | 0 | 10 | Initial-Steady creep | 44.8 | ||||
| 17 | 0 | 17 | Initial-Steady-Accelerated creep | 76.2 | ||||
| salt rock | 31.28 | 24 | 0 | 24 | Initial-Steady-Accelerated creep | 76.7 | ||
| fault zone rock | 15 | 8 | 1 | 7 | Initial-Accelerated creep | 46.7 | ||
| 6 | 1.5 | 4.5 | Initial-Accelerated creep | 30.0 | ||||
| 6 | 0.5 | 5.5 | Initial-Accelerated creep | 36.7 | ||||
By summarizing and analysing the data in the table above, the following conclusions can be drawn:
(1) For rock classified as Class I, the integrated stress needs to reach about 30% of the uniaxial compressive strength of the rock to produce incomplete creep (Initial-Steady creep); The integrated stress reaches 120% of the uniaxial compressive strength of the rock to produce complete creep (Initial-Steady-Accelerated creep).
(2) When the integrated stress of the rock exceeds 20% of the uniaxial compressive strength of the rock, most of the rocks within rock classified as Class II, III, IV, and V, will produce different degrees of creep.
(3) For rock classified as classes II, III, and IV, complete creep occurs when the integrated stress reaches about 90% of the uniaxial compressive strength of the rock.
(4) For rock classified as Class V, complete creep occurs when the integrated stress reaches about 70% of the uniaxial compressive strength of the rock.
The conclusions summarised above are grouped and organised within the Table 2. Finally, a method for analysing the rock creep patterns based on octahedral strength theory is presented.
2.2. Calculation of Rock Parameters Based on Hoek-Brown Criterion
When using the creep patterns in Table 2 for rock creep evaluating, three basic information needs to be obtained: the rock classification, the rock stress states, and the rock uniaxial compressive strength. Among these, the rock uniaxial compressive strength may not be given in the ground investigation reports, so other methods are needed to obtain it, and the Hoek-Brown strength criterion is an accurate and effective method (Deshpande et al., 2024; Meng et al., 2025).
The Hoek-Brown strength criterion was first proposed in 1980 by E. Hoek and E. T. Brown (1980; 1980) and can reflect the non-linear empirical relationship between ultimate principal stresses in rock damage. In 1992, E. Hoek et al. (1992) improved H-B strength criterion so that it could be applied to both rocks and rock masses, calling it the generalised H-B rock strength criterion, which is expressed as Eq. (5):
If σ3=0 in Eq. (5), the uniaxial compressive strength of the rock mass can be obtained, (Evert Hoek et al., 2002).
Where:σ1 - the maximum principal stress at destruction,
σ3 - the minimum principal stress,
σc - uniaxial compressive strength of intact rock,
σcm - uniaxial compressive strength of rock mass,
mb, a - constants related to rock type,
mi - Hoek-Brown constants for intact rock (Wu et al. 2019), which can be taken from Table 3,
s - a rock fragmentation degree constant, s∈ (0.0~1.0), with s=1.0 for intact rock,
D - degree of disturbance of the rock by external factors (D∈ (0.0~1.0)),
GSI - geological Strength Indicator (Hulya Sonmez et al., 1999), obtained by checking GIS tables (Figure 4).
Table 3:
The approximate value of mi for different rocks
| Rock types | mi |
|---|---|
| Carbonate rocks with fully developed crystalline cleavage (dolomite, limestone, marble) | 7 |
| Mudstone (mudstone, shale and slate (perpendicular to the solution)) | 10 |
| Strongly crystallised sandy shales with poorly developed cleavage (sandstone and quartzite) | 15 |
| Fine-grained, multi-mineral igneous crystalline rocks (andesite, gabbro, basalt and rhyolite) | 17 |
| Coarse-grained igneous and metamorphic rocks (hornblende, gneiss, granite, granodiorite pyroclastics) | 25 |
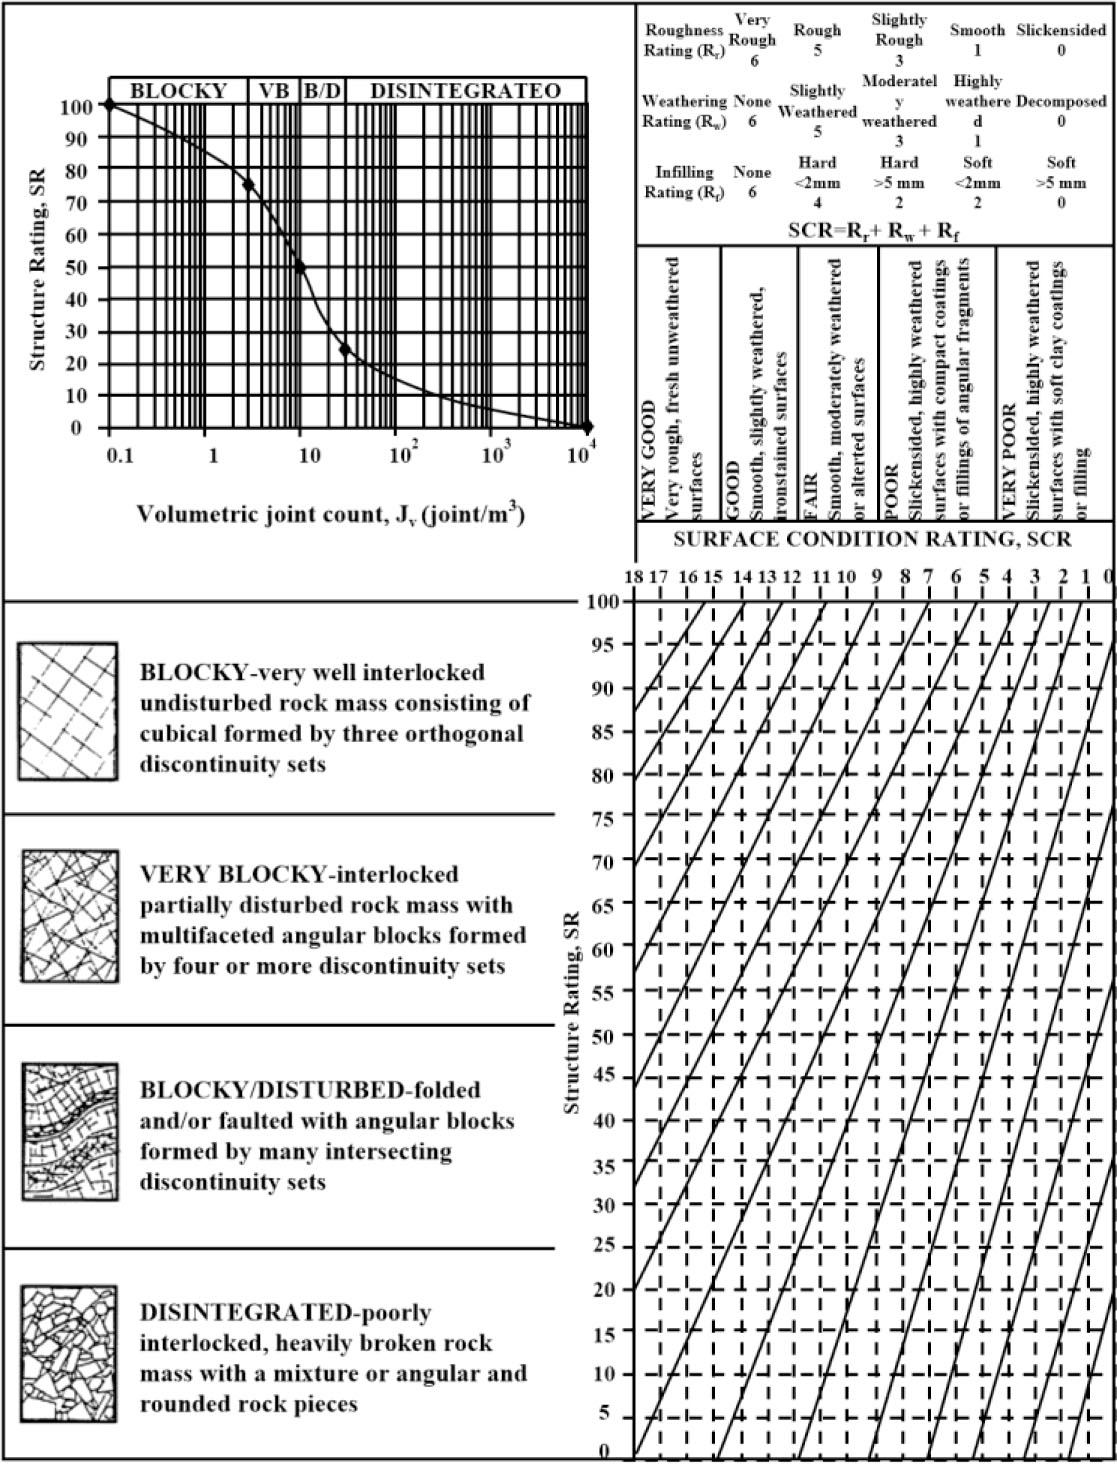
Figure 4:
Geological strength index (GSI) classification
It is clear from the above conclusions that the generalised Hoek-Brown rock strength criterion can be utilized to estimate the strength parameters of slope rock masses.
2.3. Analytical Model of Rock Creep Patterns
By integrating the theoretical study of rock creep patterns at different burial depths and the rock strength parameter calculation, combined with numerical analysis, an analytical model for rock creep patterns at different burial depths has been established, the evaluation steps of the model are as follows:
(1) Theoretical study: Based on the octahedral strength theory, the rock creep patterns under different stress states (stress state=rock stress/rock strength*100%) were summarised.
(2) Analytical calculations: Accurate estimation of the slope rock strength parameters (uniaxial compressive strength) is achieved based on the generalised Hoek-Brown rock strength criterion.
(3) Numerical analysis: Establish a numerical model of the slope based on the geological investigation report and carry out numerical analysis to obtain the magnitude of the integrated stress in the rock within the slope.
(4) After obtaining the stress states of the rock in the slope at different burial depths (stress state=rock stress/rock strength*100%), and comparing with the rock creep patterns, the rock creep behaviour at different burial depths can be evaluated (as shown in Figure 5).
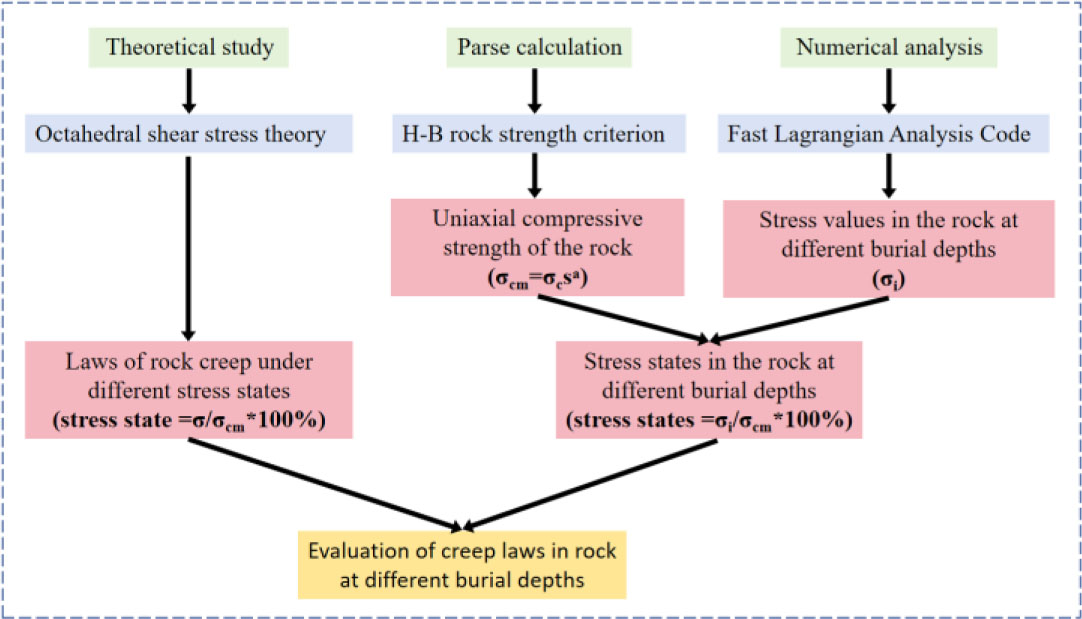
Figure 5:
Evaluation method of rock creep law at different burial depths
2. Results and Analysis
3.1. Geology of the Study Area
This paper takes engineering slope in south-west China as the research object, the geological environment of this region is extremely complex, under the action of long-term high stress environment, the crushed rock inside the slope is easy to generate creep deformation. According to the results of the ground investigation report, the study area is located in a tectonically mixed rock belt, and the area is mostly characterized by high and steep slopes.
The manuscript selected a typical high steep engineering slope as the target (Dadu River Crossing Bridge engineering slope), according to the results of the rock coring in the deep layer of the slope, selected the crushed rock as the object of study(Chen et al., 2019; Kang et al., 2021), the relevant engineering geological data as shown in Figure 6.
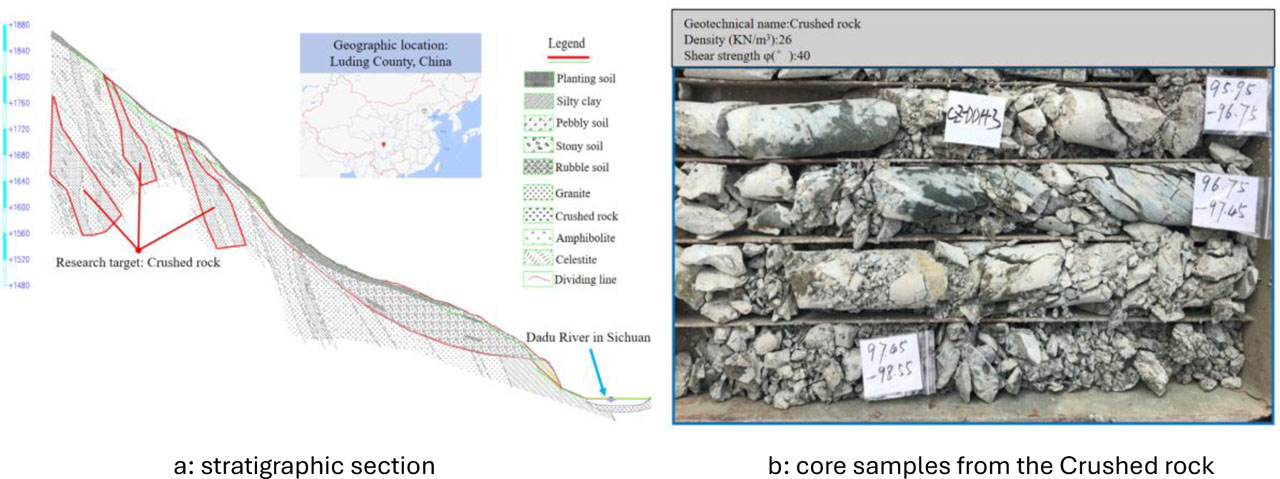
Figure 6:
Engineering geological data of Crushed rock
3.2. Calculation of Strength Parameters of Crushed Rock
From the above information, it can be seen that the geological report only delineates the stratigraphic information and the parameters such as the weight of the rock, while the strength parameters of the rock masses are not given. In order to get the mechanical parameters of rock strength (uniaxial compressive strength) within the engineering slope, the Hoek-Brown criterion can be used to calculate the rock strength parameters of the slope, and the calculation results are shown in Table 4.
Table 4:
Calculation of rock strength parameters of Dadu River using Hoek-Brown criterion
| Lithology | Rock quality classification | Hoek-brown basic parameters | Hoek-brown constant | Calculation strength parameters σcm [MPa] | |||||
|---|---|---|---|---|---|---|---|---|---|
| σc | GSI | mi | D | mb | s | a | |||
| Weakly weathered diorite | III | 65 | 63 | 23 | 0.3 | 4.9 | 0.01 | 0.502 | 6.56 |
| strongly weathered diorite | V | 54 | 56 | 20 | 0.6 | 2.1 | 0.002 | 0.503 | 2.49 |
| Weakly weathered granite | III | 75 | 67 | 25 | 0.3 | 6.2 | 0.02 | 0.501 | 9.71 |
| Crushed rock | V | 52 | 49 | 10 | 0.8 | 0.4 | 0.0002 | 0.507 | 1.04 |
3.3. Numerical Calculation of Stress Field in Crushed Rock
Firstly, a two-dimensional numerical calculation model of the engineering slope is established according to the geological investigation data of the engineering slope on the of the Dadu River Crossing Bridge; Then, the corresponding mechanical parameters and the constitutive model of various types of rock in the computational model are given; Finally, numerical analyses were carried out to obtain the magnitude of the stresses in the various rock types within the slope (stress clouds). The established 2D numerical computational model is shown in Figure 7, and the final computed stress cloud is shown in Figure 8.
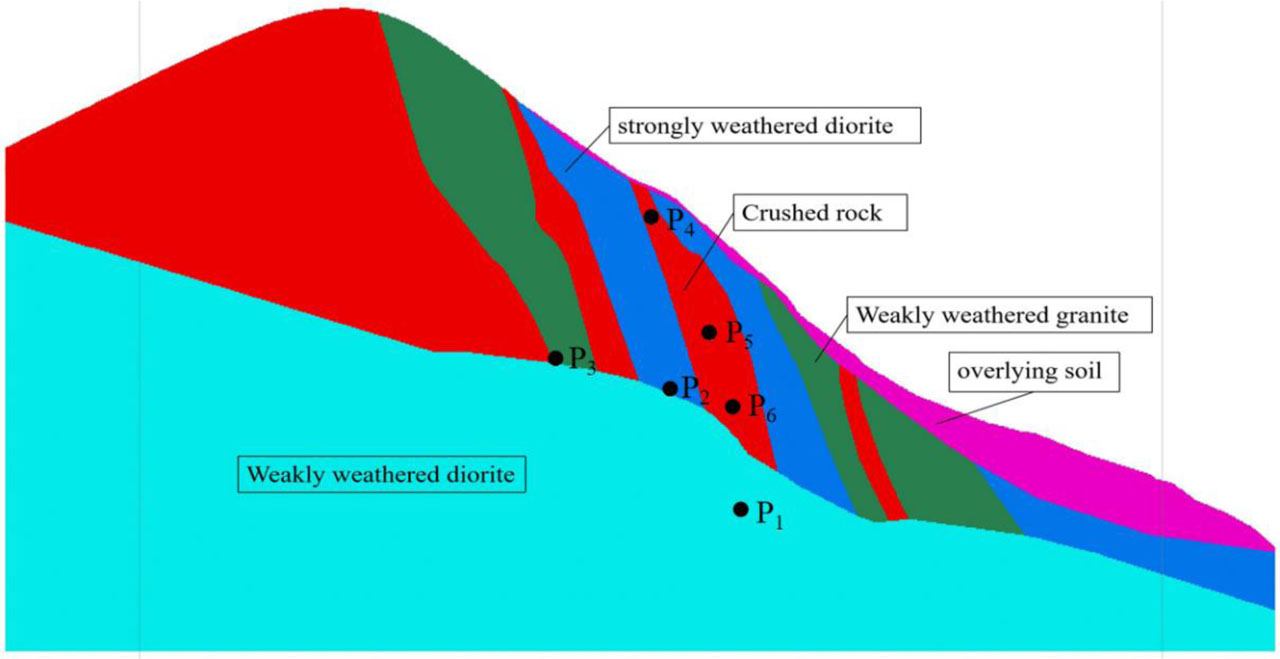
Figure 7:
Two-dimensional geological model of the slope
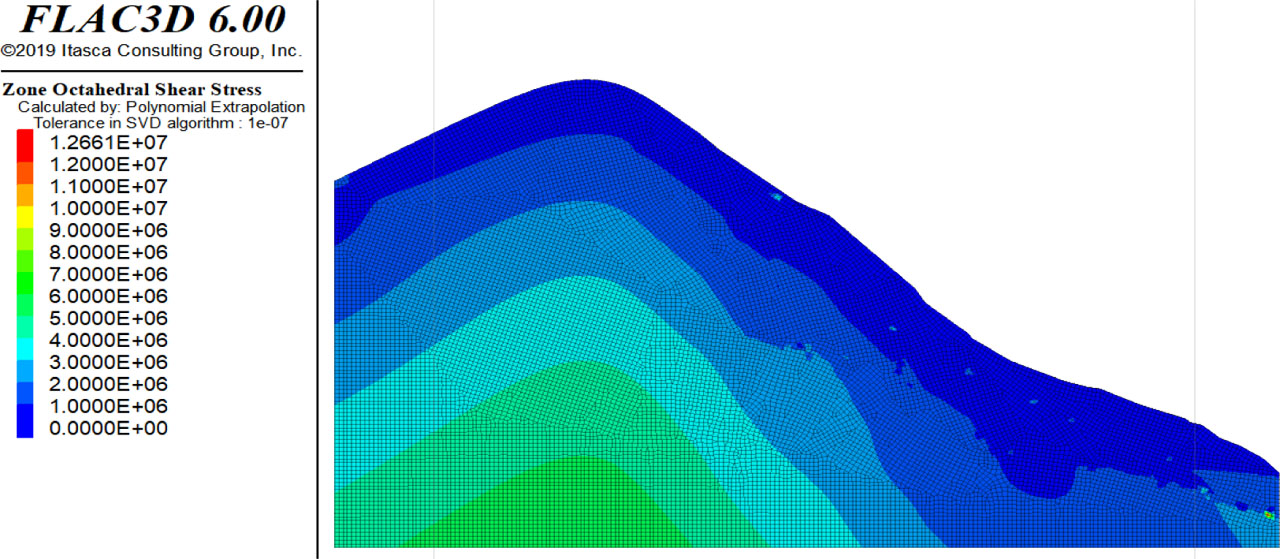
Figure 8:
Numerical computation of stress cloud of the slope
For the crushed rock mass, which is the main object of the calculation, three monitoring points, upper, middle and lower, were arranged in the rock layer of the numerical calculation (to obtain the stress values at different burial depths). For other rocks with better lithology, the monitoring points are placed only at the maximum burial depth to get the maximum stress value. The locations of monitoring points and the stress values obtained for each rock type are shown in Table 5.
Table 5:
Stress values of Rocks within the slope
| Monitoring point | Burial depth [M] | Lithology | σ [MPa] | σcm [MPa] | σ/σcm | Creep behaviour |
|---|---|---|---|---|---|---|
| P1 | 245 | Weakly weathered diorite | 1.24 | 6.56 | 18.9%<20% | None |
| P2 | 188 | strongly weathered diorite | 0.43 | 2.49 | 17.2%<20% | None |
| P3 | 220 | Weakly weathered granite | 1.80 | 9.71 | 18.5%<20% | None |
| P4 | 20 | Crushed rock (upper) | 0.13 | 1.04 | 12.5%<20% | None |
| P5 | 70 | Crushed rock (middle) | 0.36 | 1.04 | 34.6%>20% | Exist |
| P6 | 135 | Crushed rock (lower) | 0.77 | 1.04 | 74.0%>70% | Exist |
3.4. Evaluation of Creep Patterns in Crushed Rock at Different Burial Depths
As can be seen from the Table 5, among the various rock types within the Dadu River Crossing Bridge engineering slope, the stress states of weakly weathered saprolite, strongly weathered saprolite and weakly weathered granite at the maximum buried depth σ/σcm<20%, and then combined with the rock creep patterns based on the octahedral strength theory, it is judged that they will not undergo creep. As for the crushed rock, the stress states obtained from the upper, middle and lower monitoring points within the slope are: σ/σcm<20%, σ/σcm>20%, σ/σcm>70%, from which it can be judged that the upper part of the crushed rock layer within the slope does not undergo creep, while the middle and the lower part of the crushed rock layer undergoes creep to varying degrees. In order to further investigate the specific creep behaviour of the crushed rock at different burial depths within the engineering slope, the stress-depth curves (σ-H) are plotted based on stress values of monitoring points at different burial depths in crushed rock, as shown in Figure 9.
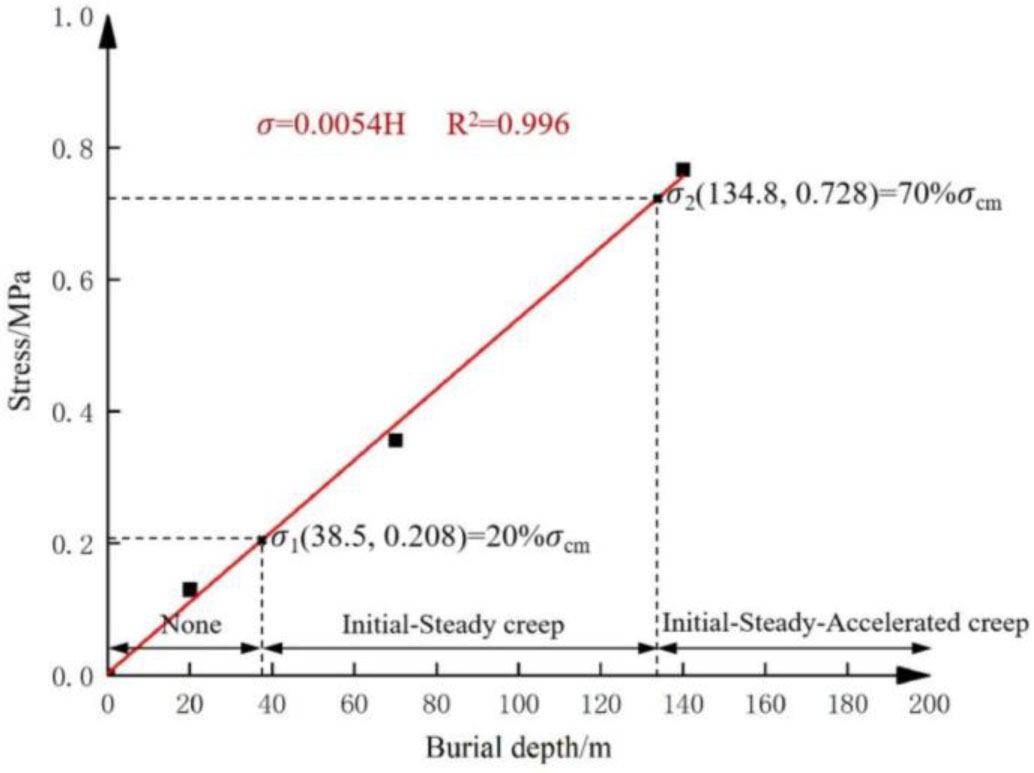
Figure 9:
Stress-depth curves (σ-H) of crushed rock at different burial depths
From the Figure 9 it can be judged that when the crushed rock is buried at a depth of 0~38.5m, the stress state σ/σcm<20%, and no creep occurs at this depth. When the burial depth of crushed rock is 38.5~134.8m, the stress state 20%≤σ/σcm>70%, and the crushed rock at this depth undergoes Initial-Steady creep. When the burial depth of crushed rock within the engineering slope is greater than or equal to 134.8 m, the stress state σ/σcm≥70%, and the complete creep phenomenon (Initial-Steady-Accelerated creep) occurs in the crushed rock at this depth. From this, the creep patterns of crushed rock at different burial depths are obtained, as shown in Figure 10.
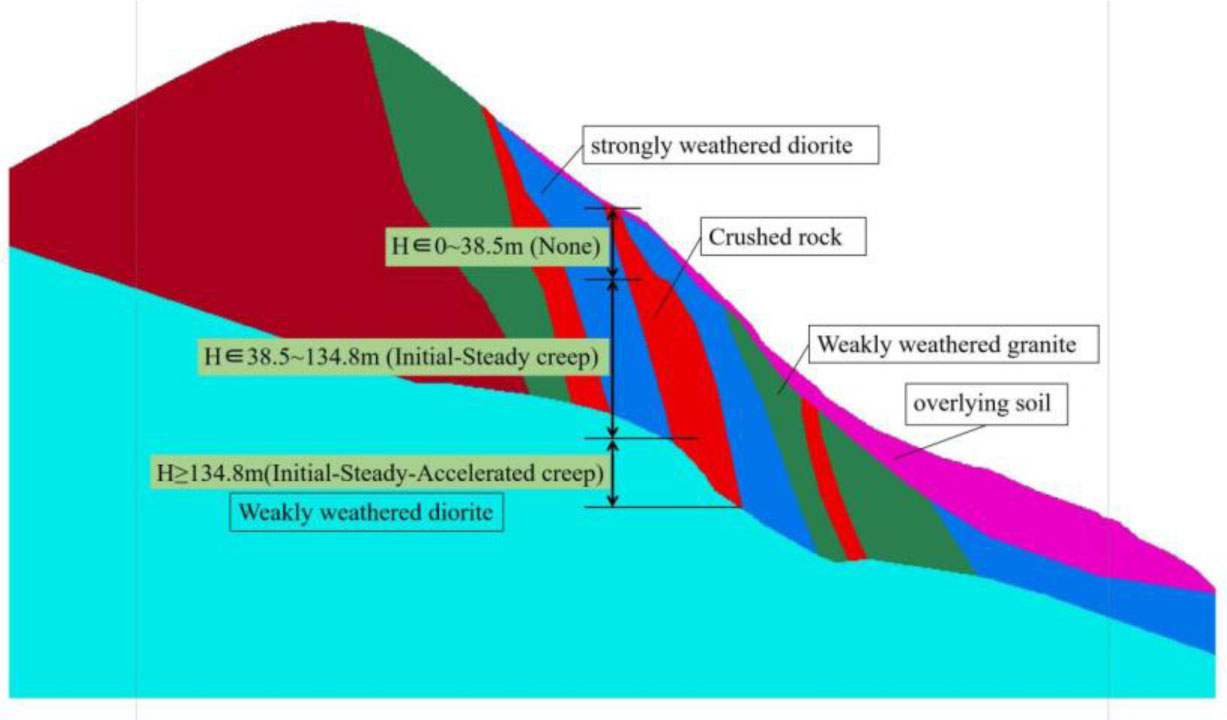
Figure 10:
Evaluation of creep behaviour of crushed rock at different burial depths
3. Results and Conclusions
4.1. Results
The manuscript takes the crushed rock within the Dadu River Crossing Bridge engineering slope in Southwest China as the research object. Exploring the rock creep patterns at different burial depths based on the octahedral strength theory (theoretical research), generalised Hoek-Brown rock strength criterion (analytical computation), and numerical analyses, and the results obtained are as follows:
(1) Based on the octahedral strength theory, the rock creep patterns under different stress states are summarised. Firstly, classifying the various types of rock according to their strength, and then the creep patterns of different rocks under different stress states is summarised according to the rock stress state (stress state = rock stress/rock strength*100%).
(2) Accurate calculation of the rock strength parameters is realised based on the generalised Hoek-Brown rock strength criterion. Based on the strength parameters of intact rocks, combined with the geological conditions in which the study object is located, and then using the generalised Hoek-Brown rock strength criterion, an analytical calculation of the rock strength parameters (uniaxial compressive strength) is realised.
(3) Using the above creep patterns of different rocks under different stress states based on the octahedral strength theory and the analytical calculation of rock strength parameters based on the generalised Hoek-Brown rock strength criterion. The creep behaviour of crushed rock at different burial depths was evaluated by taking the crushed rock within the Dadu River Crossing Bridge engineering slope in Southwest China as the research object.
4.2. Conclusions
This manuscript organically integrates and fully utilizes theoretical research, analytical calculations, and numerical analysis methods to establish a comprehensive evaluation model for rock mass creep behaviour at varying burial depths. The model has been successfully applied to practical engineering cases, thoroughly validating the accuracy of the research findings. The research results can provide a reference and basis for the rock mass creep analysis.
Acknowledgements
The authors thank the Natural Science Foundation of Sichuan Province (2025ZNSFSC0305): Intelligent inversion analysis of landslide stability based on point safety coefficient for motivation and support for this research work.
Notes
[1] Contributed by Author Contributions
W.S. & Y.T. conceived and designed the study. C.H. conducted the experiments and collected the data. Z. Z. performed the statistical analysis. T. H. contributed to data interpretation and manuscript drafting. All authors critically reviewed and approved the final version of the manuscript and agreed to be accountable for all aspects of the work.