

1. Introduction
With the rapid urbanization of cities and the expansion of transport logistics infrastructure, noise pollution is becoming an increasingly pressing environmental and public health issue. Research shows that approximately 20% of the European population lives in areas where noise levels exceed safe thresholds for human health, with road traffic identified as the primary source of noise (Guarnaccia et al., 2024). Noise originating from vehicles, warehouse operations, and logistics centres can lead to sleep disturbances, stress, cardiovascular diseases, and other health problems (World Health Organization, 2018). Therefore, noise dispersion modelling is becoming an increasingly important tool for managing and mitigating these adverse effects.
Transport logistics companies—particularly warehouses and distribution centres—generate significant noise due to the intensive movement of heavy vehicles, loading operations, and technological equipment. To assess and manage this impact, advanced noise dispersion modelling methods are essential. These methods allow the prediction of noise levels in various territories and enable the planning of effective noise mitigation measures.
Previous studies in this field have already revealed key insights. For example, research by Smith (2020) demonstrated that noise levels generated by transport logistics centres directly correlate with traffic intensity and vehicle speed, while noise dispersion is significantly influenced by local topography and the spatial arrangement of buildings. Jones et al. (2019) examined the application of various modelling methods, such as ray tracing and precomputed outdoor simulations, for predicting transport noise in urban environments, emphasizing the importance of model reliability. Wang and Lee (2021) found that meteorological conditions—particularly wind direction and speed—have a substantial impact on noise propagation trajectories and intensity. As a result, they recommend integrating dynamic weather forecasting into noise modelling algorithms. Several studies have been conducted assessing the impact of different types of intersections (standard and roundabouts) on noise emissions, where it has been found that converting an intersection into a roundabout will reduce noise levels (Decký et al., 2012; Jandacka et al., 2024). Furthermore, Chen and colleagues (2018) established that installing green zones and noise barriers can significantly reduce noise impact on surrounding residential areas and proposed optimizing the placement of such mitigation measures using geospatial data systems. Píry et al. (2023) identify transport infrastructure as one of the key pillars of a green infrastructure system. It encompasses a wide range of benefits and partial public interests, making a strong case for a much more comprehensive approach—also at the legislative level—to redefining and regulating green infrastructure. These earlier works form a solid foundation for further research to advance and refine noise dispersion modelling methods in the transport logistics sector.
Khan and Burdzik (2023) reviewed various methods for measuring and analysing transport noise and vibration, including international standards such as ISO 1996–2:2016. They also discussed multiple noise prediction models—such as CoRTN, RLS 90, and CNOSSOS-EU—highlighting their relevance in transport noise assessment. CoRTN is an empirical methodology for predicting road noise levels. It assesses traffic flows, speed, road type, distance to the receiver, terrain, weather conditions, etc. RLS-90 (German Road Noise Model) is based on empirical data and measurements. It uses values such as L10, L90; it assesses traffic speed, volume, road surface, terrain, screens, distances, etc.
CNOSSOS-EU is established by law in Lithuania and is used in state-level planning, for example, when creating noise maps in large cities or along major transport corridors. CoRTN and RLS-90 are not mandatory in Lithuania, but they are often used in practice when conducting local environmental impact assessments (EIA) or planning construction projects, when CNOSSOS-EU data or expertise are insufficient, or when a faster, simpler assessment is desired.
However, existing studies have primarily focused on individual noise components or post-construction assessments. Limited research has comprehensively evaluated the integrated noise environment of planned logistics facilities using contemporary modelling methodologies that incorporate multiple source types (mobile, point, and area sources) simultaneously. Furthermore, few studies have systematically compared projected noise levels against specific regulatory frameworks while accounting for existing background noise conditions.
This research addresses key gaps in current knowledge by providing a comprehensive assessment of noise impacts from logistics facilities. Unlike previous studies that typically focus on individual noise sources, it simultaneously models mobile sources (vehicle traffic), point sources (HVAC systems), and area sources (parking and loading zones) using CADNA A software and the ISO 9613-2 methodology. The study further evaluates compliance with Lithuanian HN 33:2011 standards and European Directive 2002/49/EC, establishing a practical regulatory framework applicable to similar projects. By incorporating background noise from the A1 highway, the research situates facility assessments within realistic acoustic contexts, producing more accurate predictions for decision-making. Importantly, the study emphasizes preventive noise impact assessment during the planning phase, allowing mitigation measures to be implemented before construction, in contrast to the reactive approaches often observed in prior literature.
The potential contributions of this study include validating preventive noise modelling methodologies, demonstrating effective integration of multiple noise source types in complex operational environments, and providing evidence that existing regulatory frameworks are adequate when properly applied. Additionally, it offers practical guidance for sustainable logistics development that maintains acoustic comfort in surrounding residential areas. Conversely, the research may reveal limitations of current modelling methods in predicting real-world noise levels, inadequacies of existing regulatory thresholds for cumulative exposure, challenges in modelling modern logistics operations accurately, and difficulties in balancing economic development with environmental protection.
The object of this study is the comprehensive noise environment generated by environmental and internal/external sources within a planned logistics warehouse. The research analyses noise levels in dB(A), explores noise propagation patterns in relation to distance from the planned warehouse, examines their impact on the surrounding residential environment, and evaluates the effectiveness of proposed mitigation measures in ensuring regulatory compliance and environmental protection.
2. Methodology
2.1. Existing and Planned Noise in the Logistics Warehouse Area
The planned economic activity is intended to be carried out in Kaunas District Municipality, Karmėlavos eldership, Lithuania. Before starting the assessment work, preliminary information was collected about the planned logistics warehouse activity (hereinafter referred to as the economic activity) and its immediate surroundings. The necessary data for noise dispersion modelling were gathered, identifying potential noise sources and determining the noise emission parameters for each (Figure 1).
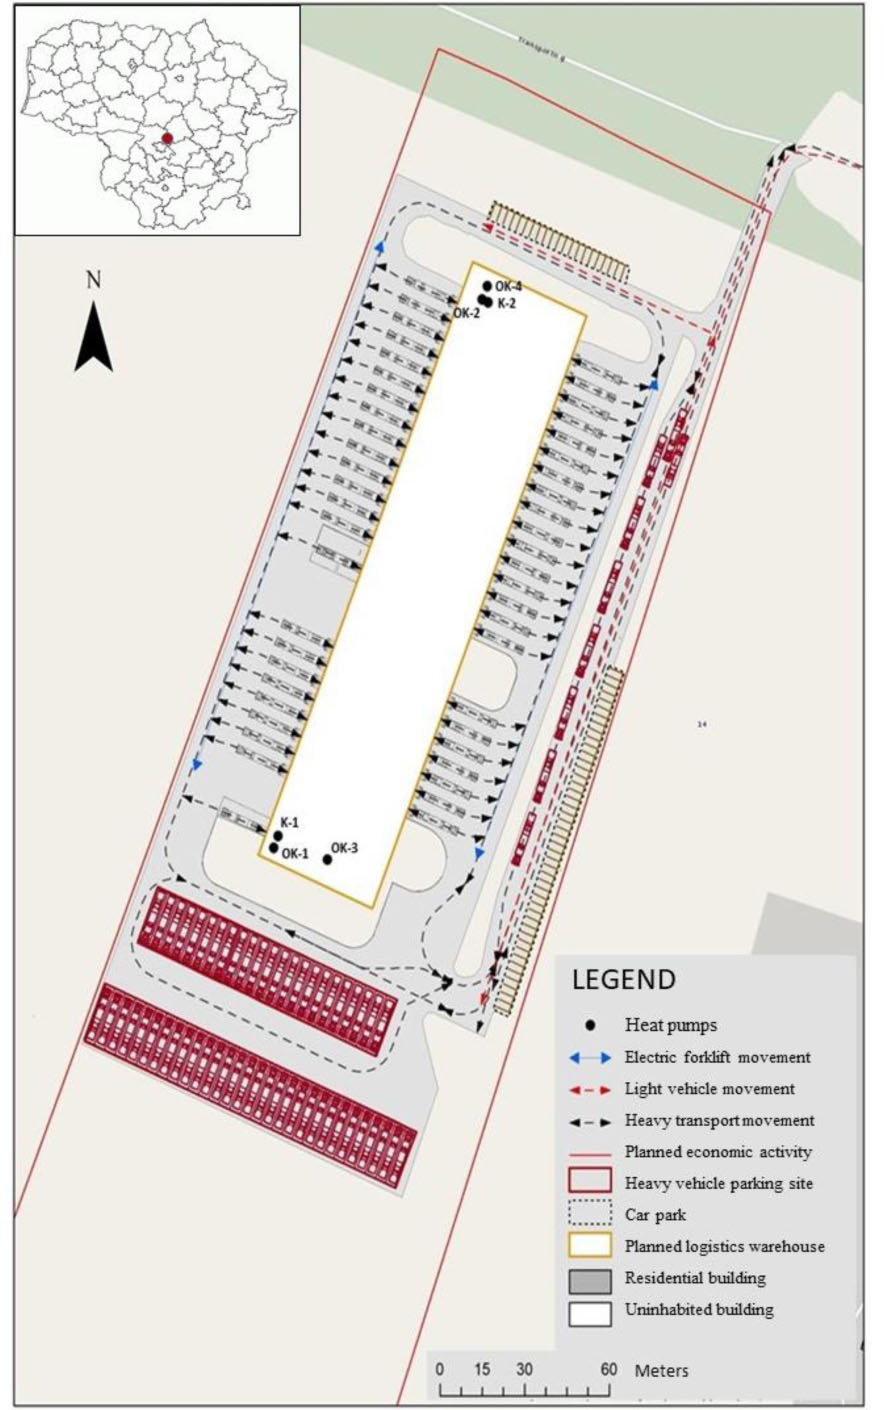
Figure 1:
Analysed area and noise sources
It is anticipated that during the operational phase of the planned economic activity, at peak production capacity, approximately 100 heavy-duty and 100 light vehicles will enter and exit the territory per day. Within the area, these vehicles will have designated routes with an assumed average speed of 20 km/h. Entry to the site is planned from the northeast side of the plot, via the existing street. Employee vehicles and other incoming light vehicles will be parked within the company's territory in parking lots with 45 and 20 spaces, respectively (totalling 65 spaces). Parking lots for heavy-duty vehicles are planned on the southern side of the territory, with 30 and 23 spaces (a total of 53 spaces). The parking areas, with their identified number of parking spaces, will be considered as area noise sources.
On the western and eastern sides of the planned building, 48 vehicle loading and unloading ramps are designed. At peak production capacity, approximately 48 trucks will arrive during the daytime, 28 in the evening, and at midnight at these ramps (Table 1).
Table 1:
Planned noise sources
| Location of source | Name of noise source | Number of sources, flow per day | Amount of noise emitted [dB(A)] | Location of the noise source | Working hours |
|---|---|---|---|---|---|
| Planned site | Heavy-duty vehicles (delivering and transporting stored products) | 100 cars | - | In the outdoor | 24 hours |
| Light vehicle traffic flow | 100 cars | - | In the outdoor | 8 hours | |
| Light vehicles (in the 65-space parking lot) | 96 cars | - | In the outdoor | 8 hours | |
| Planned warehouse | Loading and unloading operations with a forklift | 15 pcs. | 79 | Indoor and outdoor | 8 hours |
| Electric wheelchairs | 12 pcs. | 70 | Indoors | 8 hours | |
| Recuperator RS-1 | 1 pc | 62 | Indoors | 24 hours | |
| Recuperator RS-2 | 1 pc | 62 | Indoors | 24 hours | |
| Heat pumps (outdoor units): | 6 pcs. | Outside on the roof | 24 hours | ||
| OK-1 | 53 | ||||
| K-1 | 53 | ||||
| OK-2 | 56.5 | ||||
| K-2 | 56.5 | ||||
| OK-3 | 53 | ||||
| OK-4 | 56.5 |
To ensure greater clarity and reproducibility of the modelling process, the noise emission parameters of each identified source were specified in detail. Heavy-duty vehicles (100 units/day) were modelled as linear sources, with an assumed average speed of 20 km/h and 24-hour operation. Light-duty vehicles (100 units/day) were also modelled as linear sources, but their activity was limited to daytime (8 h). Parking lots, with 65 light-vehicle spaces and 53 heavy-vehicle spaces, were treated as area sources, considering the number of vehicle movements per day.
Loading and unloading activities were represented by 15 forklifts (sound power level: 79 dB(A)). One forklift was assumed to operate outdoors in the ramp area, while the others were used indoors. Electric pallet trucks (12 units) were considered exclusively indoor sources, with manufacturer-specified sound power levels ranging from 66–70 dB(A); the upper limit was adopted in the modelling as a worst-case scenario.
Ventilation systems included two recuperators (62 dB(A) each, continuous operation indoors) and six rooftop heat pumps, with sound power levels of 53–56.5 dB(A). These were modelled as point sources due to their small dimensions relative to the receiver distance. Indoor equipment noise was further attenuated by multi-layer sandwich panels with a weighted sound reduction index of Rw ≥ 27 dB(A), as specified for the planned building envelope.
Accordingly, vehicle flows and movements were modelled as linear sources, parking areas as area sources, and stationary machinery and HVAC units as point sources, in line with the methodological guidelines of the National Public Health Centre and ISO 9613-2 standards.
In the planned building, the dominant noise sources will be those generated by equipment used in technological processes. These noise sources are located indoors, meaning that environmental noise will be effectively mitigated by internal partitions and the closed external wall structures of the building, which are planned to be made of multi-layer “sandwich” panels with PIR core: 120 mm thick in the warehouse section and 180 mm thick in the administrative section. The calculations assume that the sound insulation rating of the walls will have Weighted Sound Reduction Index no less than Rw = 27 dB(A) (Table 2).
Table 2:
Technical and acoustic parameters of the planned and existing buildings
| Object | Wall thickness [mm] | Wall type | Sound absorption |
|---|---|---|---|
| Planned warehouse | 120 | Multilayer panels | RW- 27 dB(A) |
| Planned administration | 180 | Multilayer panels | RW- 27 dB(A) |
All planned equipment within the building is characterized by low noise levels (see Table 1), as none of the planned devices exceed 85 dB(A). However, as a worst-case scenario, a noise level of 85 dB(A) is assumed in the production area during modelling, since employees will be working near noisy equipment. According to the amendment of the Order No. A1-103/V-265 of the Minister of Social Security and Labour and the Minister of Health of the Republic of Lithuania of April 15, 2005, titled “On the Approval of the Requirements for the Protection of Employees from Risks Related to Noise”, and its amendment No. A1-310/V-640 of June 25, 2013 (Vilnius), the upper exposure action value Lex8, h = 85 dB(A) must not be exceeded in the employee working zone. Six air-to-air heat pumps will be installed on the roof of the planned building.
All stationary noise sources are assessed as point sources, as their dimensions are not large. According to the methodological guidelines of the National Public Health Centre (NVSC) “Noise Assessment and Management Model”, a point noise source is defined as one whose dimensions are significantly smaller than the distance to the noise assessment location (distance d from the individual equivalent source point to the assessment point must be at least twice the maximum dimension of the source Hmax, i.e., d > 2×Hmax). If this condition is met, a group of noise sources represented by a single source can be treated as an individual point noise source.
2.2. Residential Environment
The nearest residential building (No. 13) is located approximately 291 meters from the boundary of the analysed planned economic activity site. Other residential buildings and their protected (residential) environments are situated farther away (Figure 2).
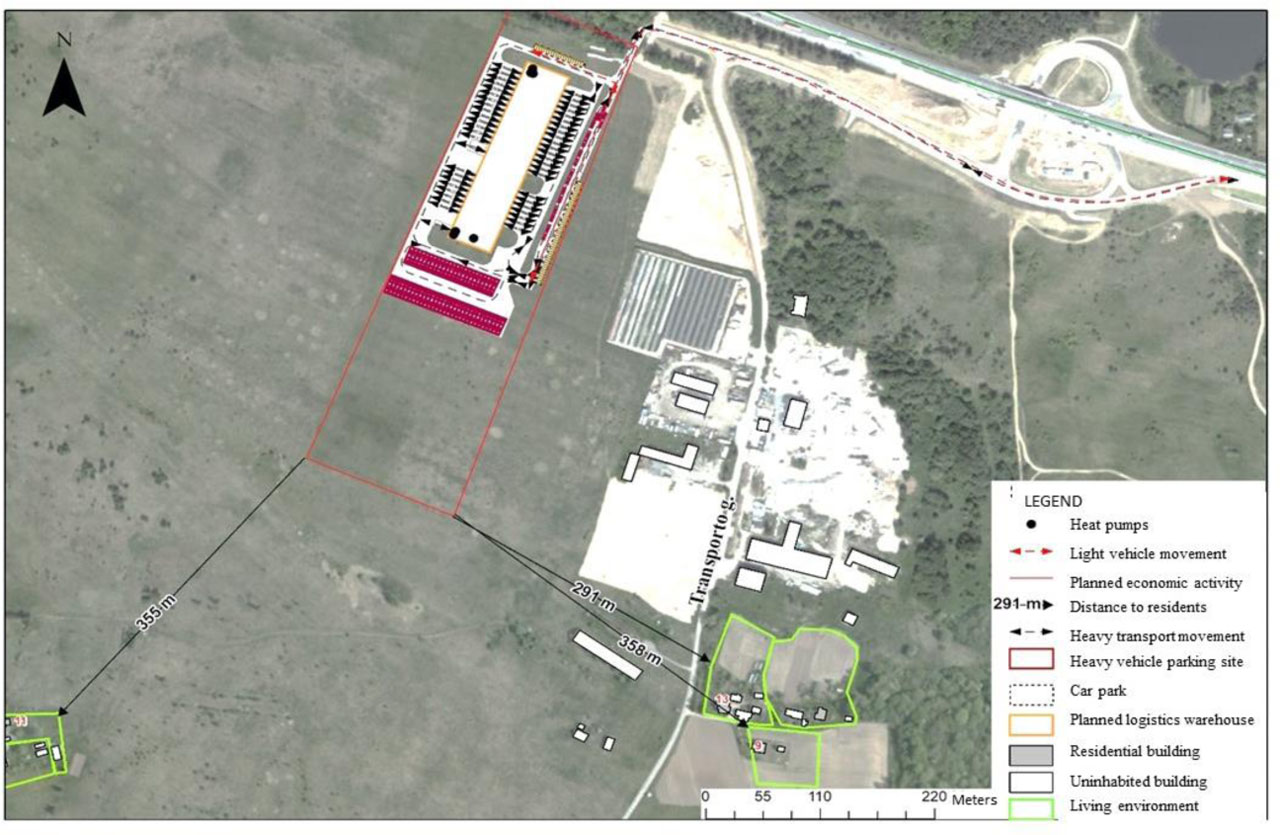
Figure 2:
Residential buildings and their protected environments closest to the planned logistics warehouse
Adjacent to the analysed site is the A1 highway (Vilnius–Kaunas–Klaipeda). The traffic intensity on this road is 25,916 vehicles per day (according to information provided on the website https://vialietuva.lt/eismo-intensyvumas), with heavy-duty vehicles accounting for 9.7% of the total traffic flow. The assumed vehicle speed is 110 km/h. This has been considered as a background noise source.
2.3. Materials and Procedures
Noise calculations were carried out to determine whether the operation of the planned logistics warehouse may result in exceedances of the permissible noise limits and if so, to identify measures to prevent them. The noise from the planned economic activity is assessed using the indicators Lday, Levening, Lnight, and Lden.
Noise calculations were performed using the CADNA A software, applying the methods specified in Table 3. The calculations are typically carried out by evaluating the noise emitted by mobile, linear, area, and point sources of economic activity during the day, evening, and night periods, respectively. The software allows for quick modelling of noise dispersion under different economic activity and infrastructure development scenarios, considering various variables such as traffic intensity, speed, the percentage of heavy and light vehicles in the calculated flow, the noise and operating time of linear, point, and area sources. This enables comparison of results and selection of the most suitable option for site development, building design, or noise reduction measures.
Table 3:
Terms and conditions of legal documents and recommendations (Juodkiene, 2023)
| Document | Terms, recommendations |
|---|---|
| The Noise Management Act of the Republic of Lithuania was approved on 26 October 2004. IX–2499, (Official Gazette, 2004, No.), Summary editorial from 2023-01-02. | Noise limit value shall mean an average value of Lday, Levening, or Lnight, the exceeding of which causes the manager of a noise source to enforce noise prevention and/or reduction measures. |
| Directive 2002/49/EC of the European Parliament and of the Council of 25 June 2002 relating to the assessment and management of environmental noise. | Annex II. Assessment Methods for Noise Indicators. |
| For industrial noise: ISO 9613-2: Acoustics — Attenuation of sound during propagation outdoors — Part 2: Engineering method for the prediction of sound pressure levels outdoors. | |
| For road traffic noise: The French national computation method ‘NMPB–Routes–96 (SETRA–CERTU–LCPC–CSTB)’, referred to in ‘Arête du 5 mai 1995 relatif au bruit des infrastructures routières, Journal Offieciel du 10 mai 1995, Article 6’ and French standard ‘XPS 31–133’. | |
| The above-mentioned methodology is also recommended by the Lithuanian Hygiene Regulation document HN 33:2011. | |
| Lithuanian Hygiene Regulation HN 33:2011: Noise limit values in residential and public buildings and their environment, approved by the Minister of Health of the Republic of Lithuania on June 13, 2011. by order No. V-604. | This Hygiene Regulation determines the limit values of noise emitted by noise sources in residential and public buildings and their surroundings and is applied when assessing the impact of noise on public health. |
Table 4:
Terms and conditions of legal documents and recommendations
| Measurement sites | Time of day, h | Equivalent sound pressure level (LAeqT), dB(A) | Maximum sound pressure level (LAFmax), dB(A) |
|---|---|---|---|
| Dwellings in residential buildings (houses), bedrooms in public buildings, wards in inpatient health care institutions. | 7–19 | 45 | 55 |
| 19–22 | 40 | 50 | |
| 22–7 | 35 | 45 | |
| In an environment of residential buildings (houses) and public buildings (except the catering facilities and culture centres), excluding transport noise. | 7–19 | 55 | 60 |
| 19–22 | 50 | 55 | |
| 22–7 | 45 | 50 |
The resulting noise level calculations are visualized on maps using ArcGIS software, with different colour intervals representing every 5 dBA. Noise dispersion was calculated at a height of 1.5 meters, with a grid resolution of dx(m): 5; dy(m): 5.
3. Results
3.1. Projected Situation - Project Without Background
Noise modelling has shown that the planned economic activity will not have a negative impact on the nearest residential environment. The noise level will comply with the limit values set by HN 33:2011 “In the environment of residential buildings (homes) and public buildings (excluding catering and cultural buildings), excluding transport-related noise.” All noise indicators near the closest residential buildings or their surroundings will be below the limit values specified in HN 33:2011. Detailed noise dispersion maps of the projected situation (daytime, evening, nighttime, and 24-hour (Lden)) are provided in Figure 1.
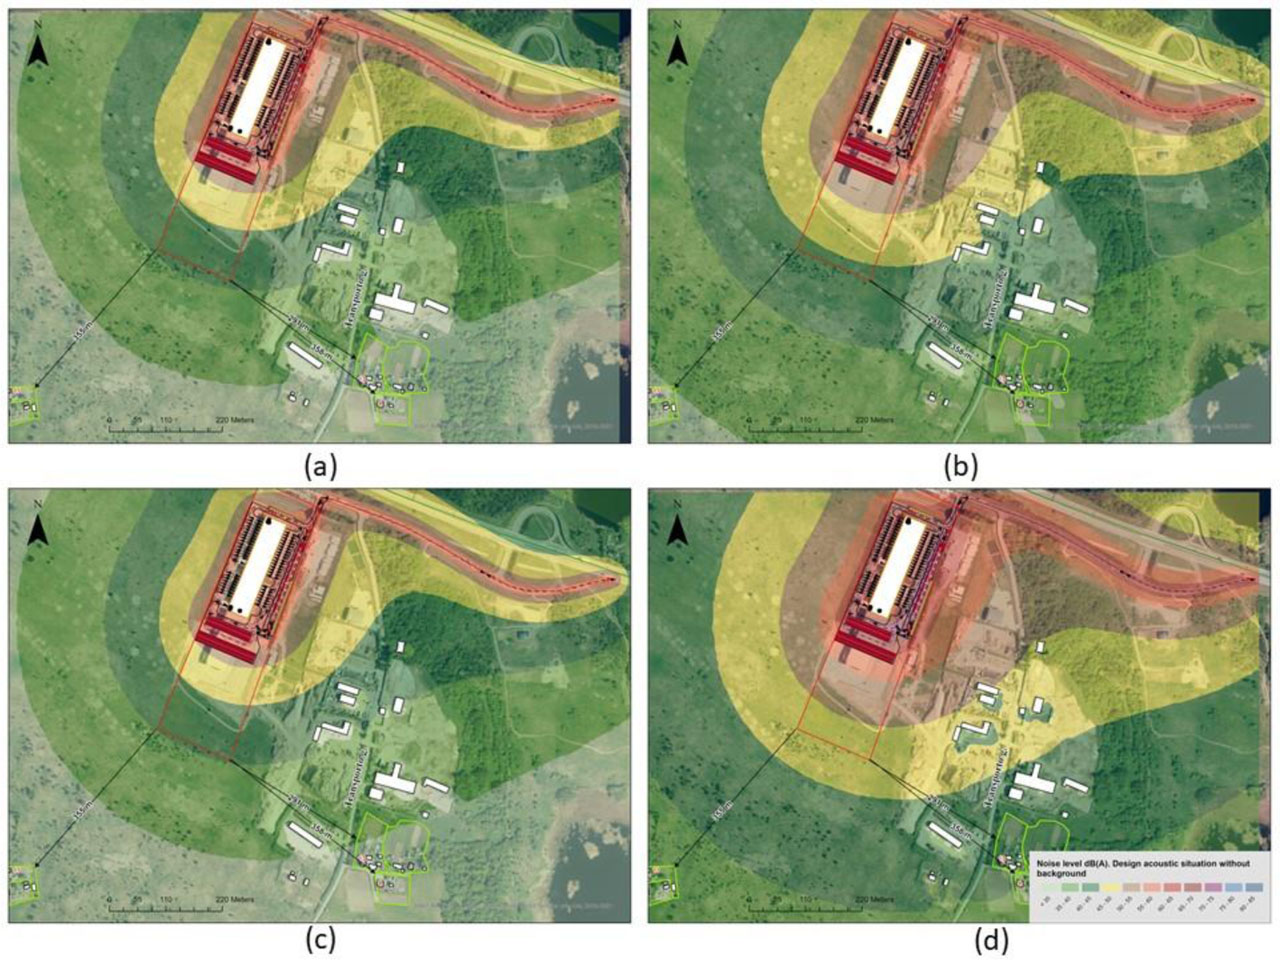
Figure 3:
Predicted noise dispersion maps without background noise sources (a) day, (b) evening, (c) night, and (d) Lden
The calculated current noise levels at the boundaries of the planned economic activity site are presented in Table 5. It is also very important to assess the impact of the noise level generated by the economic activity on the nearest residential environment.
Table 5:
Calculated noise levels of the projected acoustic situation without background noise sources
| Location | Lday, dB(A) | Levening, dB(A) | Lnight, dB(A) | Ldvn, dB(A) |
|---|---|---|---|---|
| Northern boundary of the site | 58.3 | 59.2 | 56.9 | 62.7 |
| Eastern boundary of the site | 63.1 | 65.6 | 62.0 | 69.2 |
| Southern boundary of the site | 41.3 | 44.8 | 40.9 | 47.8 |
| Western boundary of the site | 61.3 | 65.7 | 62.4 | 69.3 |
| Living environment No. 13 | <35 | 38.6 | <35 | 42.2 |
| Living environment No. 9 | <35 | 35.5 | <35 | 39.3 |
| Living environment No. 11 | <35 | 35.0 | <35 | 38.3 |
An assessment of the calculation results shows that during the day, evening, and night, noise level exceedances are possible along the northern, eastern, and western boundaries of the company’s site. These values are influenced by the road used by heavy vehicles (on the northern, western, and eastern sides) and light vehicles (on the northern and eastern sides) running along the boundaries of the planned economic activity site.
Detailed noise modelling has shown that the planned economic activity will not have a negative impact on the nearest residential environments. The noise level will comply with the limit values set by HN 33:2011 for the environment of residential and public buildings (excluding catering and cultural buildings), excluding transport-related noise.
The day, evening, and night indicators near the closest protected environment and residential building will be below 35 dB(A) during the day and night and will range between 35–38.5 dB(A) in the evening.
3.2. Projected Situation - Project with Background Noise
Detailed noise dispersion maps (daytime, evening, nighttime, and Lden) of the projected situation including background noise sources are presented in Figure 2.
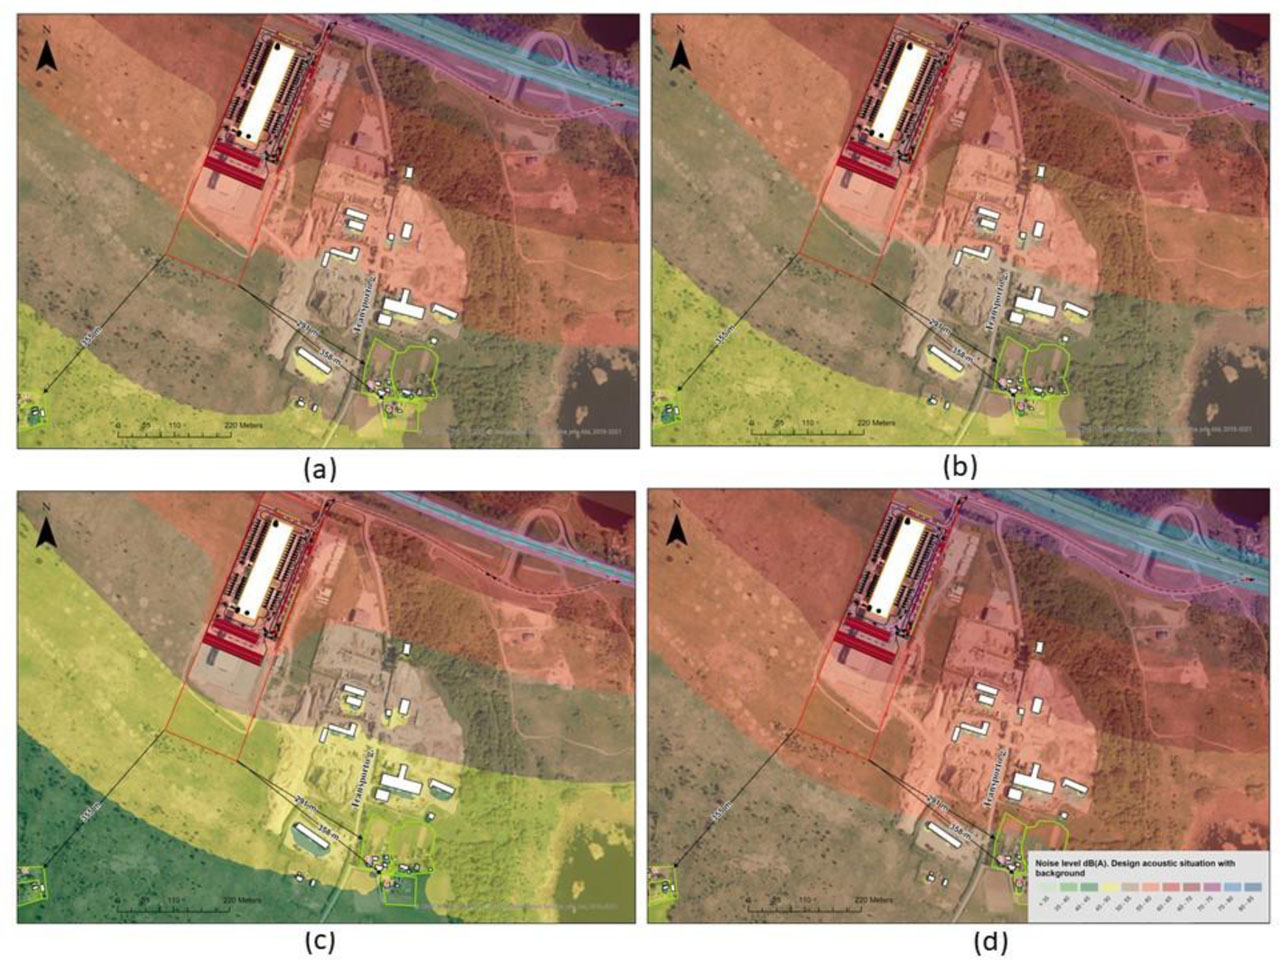
Figure 4:
Predicted noise dispersion maps with background noise sources (a) day, (b) evening, (c) night, and (d) Lden
Calculations were performed at residential buildings No. 13, 11, and 9 along their plots' boundaries. Based on the calculation results, it is evident that the noise levels comply with the limit values established by HN 33:2011 (the noise levels are presented in Table 6).
Table 6:
Calculated noise levels of the projected acoustic situation with background noise sources
| Location | Lday, dB(A) | Levening, dB(A) | Lnight, dB(A) | Ldvn, dB(A) |
|---|---|---|---|---|
| Northern boundary of the site | 68.9 | 67.4 | 65.0 | 70.9 |
| Eastern boundary of the site | 67.4 | 66.8 | 62.9 | 70.4 |
| Southern boundary of the site | 53.9 | 53.0 | 48.2 | 56.5 |
| Western boundary of the site | 65.8 | 64.4 | 60.8 | 70.6 |
| Living environment No. 13 | 51.7 | 51.4 | 46.4 | 54.8 |
| Living environment No. 9 | 50.3 | 50.4 | 45.4 | 53.7 |
| Living environment No. 11 | 48.5 | 47.6 | 42.5 | 51.0 |
After including background noise sources, the dispersion maps (Figure 2) show that the main source of noise is the traffic on the A1 motorway. Once the planned economic activity is implemented in the designated area, the dominant noise sources will be the nearby motorway and the light and heavy vehicles entering and exiting the site.
The noise level in the nearest protected environments within the studied area will comply with the limit values established by HN 33:2011 for residential and public buildings (excluding catering and cultural buildings) in areas affected by transport-related noise.
4. Discussion
Logistics warehouses and the associated heavy-duty transport are significant sources of noise, both within the warehouse areas themselves and in the surrounding residential zones. The main sources of noise include light and heavy vehicle traffic, cargo handling operations, and warehouse equipment (Riegert et al., 2023; Chowdhury et al., 2020). Noise levels often exceed recommended limits, especially in the evening hours when heavy vehicle traffic increases (Hilpert et al., 2020; Shearston et al., 2021; Vukić et al., 2024).
Studies show that warehouse operations can increase environmental noise levels, often exceeding 70 dB(A)—the limit recommended by the U.S. Environmental Protection Agency (EPA) for residential areas. For example, Hilpert et al. (2020) found that after the opening of a large warehouse, noise levels at four out of eight measurement sites exceeded 70 dB(A), with the most significant increase in truck traffic occurring during nighttime hours (9–12 p.m.) (Hilpert et al., 2020; Shearston et al., 2021). Similar results have been observed in other urbanized areas, where daytime noise levels exceeded 55 dB(A) and nighttime levels exceeded 45 dB(A), with some locations surpassing the limits by as much as 16 dB(A) (Zou et al., 2019).
The impact of noise on residential areas manifests in both physical and psychological discomfort. Approximately 60–70% of residents report that noise has a moderate to significant negative effect on their physical and mental well-being (Zou et al., 2019). Moreover, noise is often accompanied by other harmful factors, such as air pollution, which amplifies the overall impact on communities, particularly in low-income neighbourhoods (Ballare et al., 2022; Hilpert et al., 2020; Shearston et al., 2021). Low-frequency noise, often generated by warehouse equipment, also poses a health risk to residents, as A-weighted measurements do not always fully reflect the effects of low-frequency noise (Vijay & Thakre, 2024).
In many countries, noise regulation focuses on stationary sources, while truck traffic on local roads often remains insufficiently regulated (Riegert et al., 2023; Matijošius et al., 2020). Effective noise reduction measures include infrastructure redesign, installation of noise barriers, optimization of work processes (e.g., restricting loading operations at night), and the implementation of innovative technologies. According to the authors, it is important to apply comprehensive solutions that incorporate both technical and organizational measures (Matijošius et al., 2020; Vukić et al., 2024).
Our results demonstrate that even under intensive traffic flows (up to 100 heavy-duty and 100 light-duty vehicles per day) and warehouse equipment operation, the noise levels in the nearest residential environments did not exceed the permissible thresholds established by HN 33:2011. This contrasts with findings by Hilpert et al. (2020) and Zou et al. (2019), who reported exceedances of recommended residential noise limits. The difference can be attributed to the preventive measures incorporated at the design stage in our study, such as multilayer walls (Rw ≥ 27 dB(A)), indoor operations, and traffic flow management. These measures ensured effective noise reduction before the facility became operational.
Moreover, by including background noise from the A1 motorway, we identified that this existing infrastructure remains the dominant noise source in the study area, while the contribution of the planned logistics warehouse is minimal. This aligns with the recommendations of Wang and Lee (2021) and Matijošius et al. (2020), emphasizing the need to account for existing infrastructure and environmental conditions in predictive models. Unlike previous works, which mainly assessed noise impacts post-construction (Hilpert et al., 2020; Shearston et al., 2021), our study highlights the importance of preventive planning-phase assessment, which enables early adoption of mitigation measures.
In this respect, our study contributes two key insights to the existing body of research: (1) Methodological – the integrated modelling of multiple noise source types (linear, point, and area) using CADNA A and ISO 9613-2 provides a more reliable evaluation than analysing sources separately; (2) Practical – we demonstrate that well-planned construction and organizational measures can maintain regulatory compliance even under high-intensity logistics operations, while existing road infrastructure remains the primary source of environmental noise.
In summary, noise from logistics warehouses—particularly in terms of dB(A) levels—has a significant negative impact on the environment and residential areas, often exceeding recommended limits and leading to public dissatisfaction and health issues. Effective noise control requires both stricter regulation and the implementation of innovative noise reduction solutions.
5. Conclusion
The modelling of noise dispersion in the context of logistics warehouse operations is of considerable importance for research in environmental protection and public health. Contemporary logistics systems are characterized by a high intensity of transport flows, which constitutes one of the principal sources of acoustic pollution in urbanized areas. Accordingly, preventive assessments of this type not only ensure compliance with national regulations (HN 33:2011) and European directives (2002/49/EC) but also provide a critical basis for long-term strategies of sustainable development. After assessing background noise sources (e.g., the A1 highway), it was determined that they constitute the primary noise load in the examined area, while the contribution of the planned activity to the overall noise level is minimal.
The modelling results indicated that in the nearest residential buildings (Nos. 11, 9, and 13), the noise generated by the proposed activities would not exceed permissible levels within a distance of 290–358 m from the project boundary. Noise levels were estimated at <35 dB(A) during daytime and nighttime, and up to 38.5 dB(A) in the evening, remaining below the established regulatory thresholds.
When background noise sources were incorporated into the analysis (A1 motorway), it became evident that they account for the dominant share of the acoustic load in the study area, with daytime levels ranging from 54 to 69 dB(A). In comparison, the incremental contribution of the proposed logistics operations to the overall noise environment is negligible.
Notes
[1] Contributed by Author Contributions
V.J. designed the study and supervised the project, conducted the experiments and performed the data analysis. D.R. contributed to manuscript writing. All authors critically reviewed and approved the final version of the manuscript and agreed to be accountable for all aspects of the work.