

Rainfall data availability is the primary basis for hydrological, climatological, and metrological investigations (Qutbudin et al., 2019). The complex hydrological mechanisms that explain how rainfall and flow interact are demonstrated by the various paths that rainwater takes, including surface runoff and subterranean flow (Halecki et al., 2023). Hydrological characteristics, such as water flow direction, river networks, and basin morphology, are closely related to the availability of accurate rainfall and hydrological data (Abd Elrahman & Ataalmanan, 2023). The hydrological cycle and precipitation trends (rainfall) are one of the periodic seasonal processes that influence the amount of water resources in a region, which is part of the interconnected subsystems of the Earth (Smrčková et al., 2024). However, rainfall data collection often faces significant challenges, such as missing data. This phenomenon can be caused by various factors, ranging from station relocation due to urbanization (Liu & Niyogi, 2019), flaws in rainfall measurement methodologies, or equipment failure over time (Jeřábek & Kavka, 2024), particularly in flood-prone locations (Armanuos et al., 2020), (Wang et al., 2023). Missing values in rainfall data series can compromise the analytical output of hydrological and meteorological models (Duarte et al., 2022). Therefore, estimating missing values and filling these gaps has become crucial in contemporary hydrological research (Armanuos et al., 2020), (Hamzah et al., 2021).
Previous research employed rudimentary statistical methodologies, such as arithmetic averaging, to address the issue of missing data. The validity of the arithmetic mean method hinges on the stipulation that the average annual rainfall at adjacent stations must be within 10% of the target station’s standard annual rainfall. In the event that this criterion is not met, the arithmetic mean approach is deemed unfeasible to calculate the missing rainfall at the target station (Caldera et al., 2016), (Adilah & Hannani, 2021). However, algorithms, such as those used in artificial intelligence and data-driven machine learning, have emerged as more accurate approaches. These advanced methods utilize rainfall data obtained from neighboring stations within the same region and at the same time, taking into account stations with similar climatic conditions, irrespective of precipitation events (Sattari et al., 2017).
To create complete datasets, methods for filling missing rainfall values are used to impute model-based rainfall estimates into the incomplete time series. Popular approaches include regional vectors, linear regression models, and the regional weighting method (Wangwongchai et al., 2023). The inverse distance weighting approach (Teegavarapu & Chandramouli, 2005), the gauge mean estimator (Strachan et al., 2016), and ordinary Kriging (Borga & Vizzaccaro, 1997), (Plouffe et al., 2015), (Xu et al., 2018) have also become more popular due to their simplicity and convenience. These methods, albeit having different mathematical formulations, are based on a common logic. Using data from nearby locations facilitates the estimation of missing values at the target location by "averaging" these values (Rohma, 2022). According to (Duarte et al., 2022), these techniques are better suited for estimating monthly and annual rainfall levels because of the significant spatial variability and intermittent character of the rainfall process at fine temporal scales. The aggregation process lessens small timeframe extremes and dry spells, which efficiently smoothest out the higher-resolution time series. Consequently, there may be a significant decrease in estimation errors (Beran et al., 2020). Nonetheless, hydrological modeling and rainfall frequency analysis depend on daily and sub-daily precipitation data. Models that fill in missing information at such short intervals are typically limited and have poor predictive powers because of the high degrees of unpredictability in the process (Hasan & Croke, 2013).
A common practice to address this problem is to remove years (or other time periods) with incomplete data. Consequently, the random variable distribution’s upper tail might not be adequately described, or extremely tiny samples might be produced (Hristopulos & Baxevani, 2020). If the modeling mistakes are acceptable—which is rarely the case with daily data—an additional choice is to approximate the missing values using regression-based techniques. Multiple linear regression (Nathans et al., 2012), simple substitution (Pappas et al., 1955), and machine-learning algorithms (Shin et al., 2021) have all been employed for this purpose. These approaches rely on the ability of the measuring network to reproduce the observed rainfall fields, especially those with intricate spatial patterns and the more intense events. Therefore, further research is needed to address these deficiencies in daily rainfall data (Longman et al., 2020).
Rainfall estimates obtained from remote-sensing data sources, including satellites, have been more and more popular in recent years among researchers and practitioners worldwide, particularly in areas with inadequate density gauging (Brocca et al., 2014). In actuality, satellites offer end users inexpensive costs, high sample frequencies, enhanced spatial resolution at huge catchments or areas, and products free from missing data corruption (Haloho & Supriyadi, 2024). This feature has led to the question of whether using satellite rainfall estimates is a more accurate and efficient way to fill in the gaps in rainfall gauging stations that are surrounded by satellite pixels than using data from nearby locations.
The rationale for completing missing rainfall values over longer periods, such as monthly or seasonal, has been addressed in recent studies (Siabi et al., 2020), (de Moraes Cordeiro & Blanco, 2021), (Abu Romman et al., 2021). However, to the best of our knowledge, the literature has not thoroughly examined the use of satellite retrievals to supplement daily rainfall data. The primary objective of this study is to determine the feasibility of directly imputing remote sensing data from TRMM, GPM-IMERG, and GSMaP satellites to address the research gap caused by the absence of rain gauge data.
This study was conducted in the Kuranji watershed in Padang, West Sumatera, Indonesia, located at 00°48′–00°56′ N and 100°20′–100°34′ E along Sumatra’s western coast. The upper portion of the Kuranji watershed borders Padang City and Solok Regency. The Kuranji watershed’s elevation ranges from 1858 meters above sea level to an average altitude of 215.615 square kilometers (Andari et al., 2024b). Figure 1 shows a map of the Kuranji Watershed.
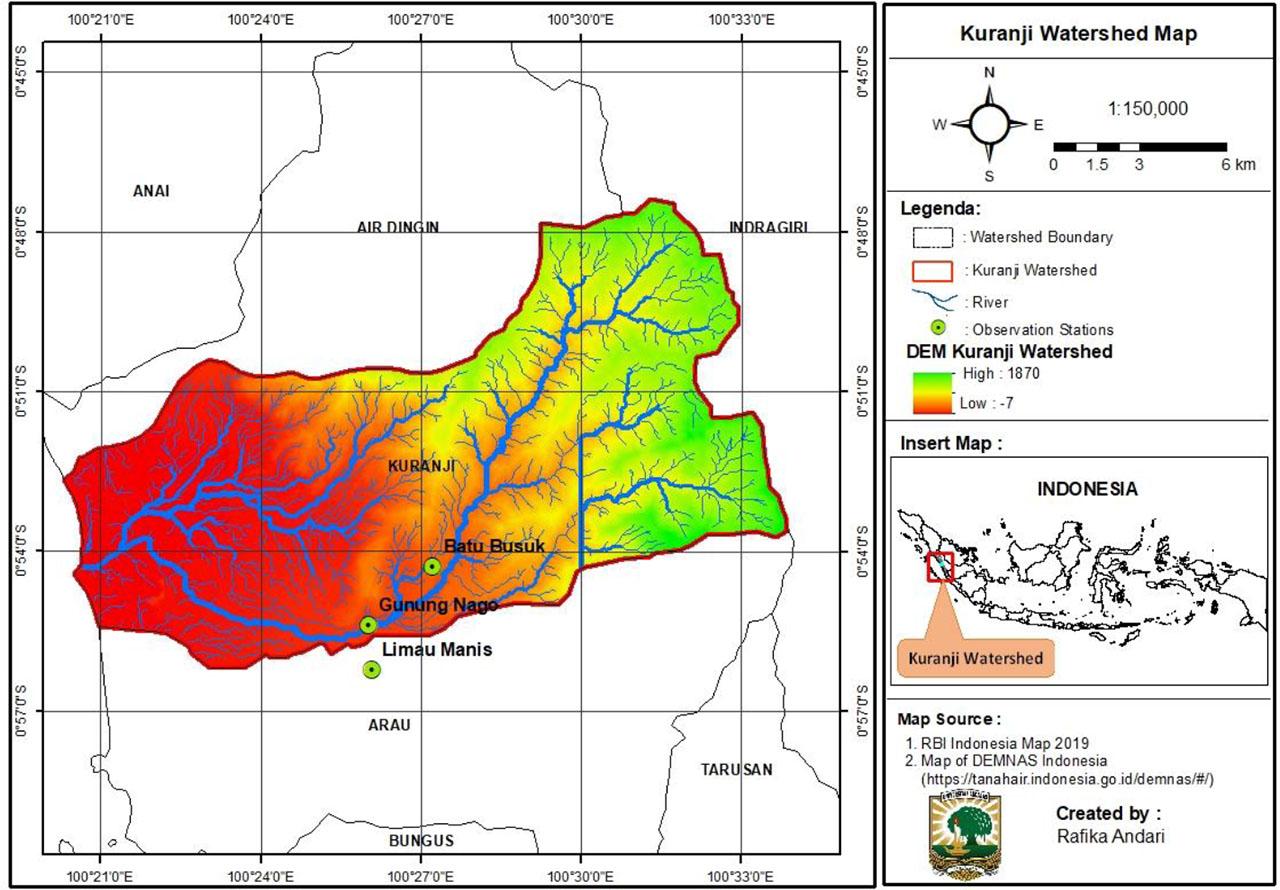
Map of The Kuranji Watershed (Source : Authors)
Daily rainfall data was collected from gauging stations within the Kuranji watershed for this study. Specifically, data were collected from three observation sites: Limau Manis, Batu Busuk, and Gunung Nago. These daily precipitation records, obtained between 2014 and 2016, were provided by the Dinas Pengelolaan Sumber Daya Air (PSDA)/Water Resources Management Department, West Sumatera.
This study assesses satellite rainfall products from the TRMM, GPM-IMERG, and GSMaP datasets. On November 27, 1997, the NASA-JAXA collaborative project TRMM was initiated. Its main goals were to support research on global climate change and to track and analyze tropical precipitation (de Moraes Cordeiro & Blanco, 2021), (Rozante et al., 2018). Specifically, TRMM rainfall data was retrieved from product 3B42, version 7, using the Giovanni platform (GESDISC Online Visualization and Analysis Infrastructure). This platform is accessible via https://giovanni.gsfc.nasa.gov/. A geographic resolution of 0.25° × 0.25° was used to collect and evaluate the TRMM’s daily results (Elnashar et al., 2020).
The GPM-IMERG satellite was developed by NASA and JAXA to replace the TRMM satellite, which only monitored tropical rainfall, and launched in 2014. GPM-IMERG produces precipitation data with temporal resolution up to 30 min and a spatial resolution of 0.1° × 0.1° (Ramadhan, et al., 2022). The GPM-IMERG satellite produces three main products (IMERG Early, IMERG Late, and IMERG Final) with varying degrees of precision and temporal delay, which are very useful for hydrological analysis, especially in areas without ground-based precipitation measuring equipment (Zhou et al., 2020). The primary distinction between the three data kinds is the amount of time it takes for the data to become available; early and late data have a 4 and 12 hour delay, respectively, while final data has a 2.5–3.5 month wait (Ramadhan, et al., 2022).
GSMaP was created in partnership with PMM, the Japan Aerospace Exploration Agency’s Precipitation Measuring Mission. For the GSMaP project, the PMM team produced three precipitation datasets. There are numerous products available, such as GSMaP-MVK, GSMaP-Gauge, and GSMaP-NRT (Ramadhan et al., 2023), (Nepal et al., 2021).
Daily rainfall data from the rain gauges were estimated using two methods for addressing missing data: linear regression and regional weighting (dos Santos et al., 2021). The data from the rain gauges was used to apply the regional weighting approach. The data from the rain gauges and the satellite pixels containing the analysis gauges were utilized independently for the linear regression, allowing the estimations to be compared.
In hydrology, simple and multiple linear regression techniques are frequently employed to estimate monthly and annual hydrological data (Elshorbagy et al., 2000). At each measurement site with comparable weather conditions, the missing weather data is estimated using this statistical method (Armanuos et al., 2020). There are two parts involved in this method: first, the relationship between the predictor and the missing value is estimated, and then the gap is filled using a trend equation (Yozgatligil et al., 2013). The following equation is used to estimate data (Armanuos et al., 2020).
Where:
a - the linear coefficient,
b - the angular coefficient,
y - the projected rainfall data,
x - the observed rainfall data.
The regional weighting method is a widely used approach for estimating missing or average rainfall values by leveraging data from nearby rain gauges. This method improves the completeness and reliability of rainfall datasets, which is crucial for hydrological and climate studies. The missing or average rainfall value is calculated as a weighted average of the available data from neighboring stations, giving more influence to stations that are closer or more similar to the target location (Byun et al., 2024; Gomes et al., 2018; Nathans et al., 2012). The estimation by regional weighting was made by equation:
Where:
p(x) - the estimated monthly rainfall,
x - the rainfall measurement that was taken during the same time period as the missing data in p(x),
Nx and Ny - stand for the average annual rainfall at nearby gauges and the rain gauge with missing data,
N - the number of surrounding gauges that were used in the weighting process.
To estimate missing rainfall data, two methods were employed: the linear regression method and the regional weighting method. For statistical comparison, four coefficients were utilized: correlation coefficient (R), root mean square error (RMSE), Nash-Sutcliffe Efficiency (NSE), and relative bias (RB). The evaluation will proceed according to the formula provided below.
Where:
Gi - the data from the observed rain gauge,
Si - the amount of rainfall as determined by the satellite,
n - the number of samples.
The correlation coefficient (R) quantifies the relationship between measured and estimated ground precipitation data. The closer the data aligns with gauge measurements, the higher the R-value, ranging from 0 to 1, with 1 being optimal. The accuracy of simulated and observed data calculations is assessed using the RMSE, which ranges from 0 to positive infinity. Higher estimation accuracy is indicated by RMSE values closer to zero (de Moraes Cordeiro & Blanco, 2021), (dos Santos et al., 2021).
NSE is used because it complements the evaluation of model fit. NSE can accurately determine the presence and extent of bias in a model, indicating whether it underestimates or overestimates (McCuen et al., 2006). The estimation result is considered good if the Nash-Sutcliffe Efficiency coefficient (NSE) exceeds 0.75, and adequate if the NSE is less than 0.75 (Motovilov et al., 1999), (Van Liew et al., 2007). Conversely, the disparity in relative volume between the estimated and observed volumes is determined by the relative bias (RB). A negative value indicates underestimation, while a positive value indicates overestimation (Ramadhan et al., 2023).
This analysis uses daily rainfall measurements from 2014, 2015, and 2016. Figure 2 compares the distribution of daily rainfall data from satellite data with 2014 data from the Batu Busuk observation station.
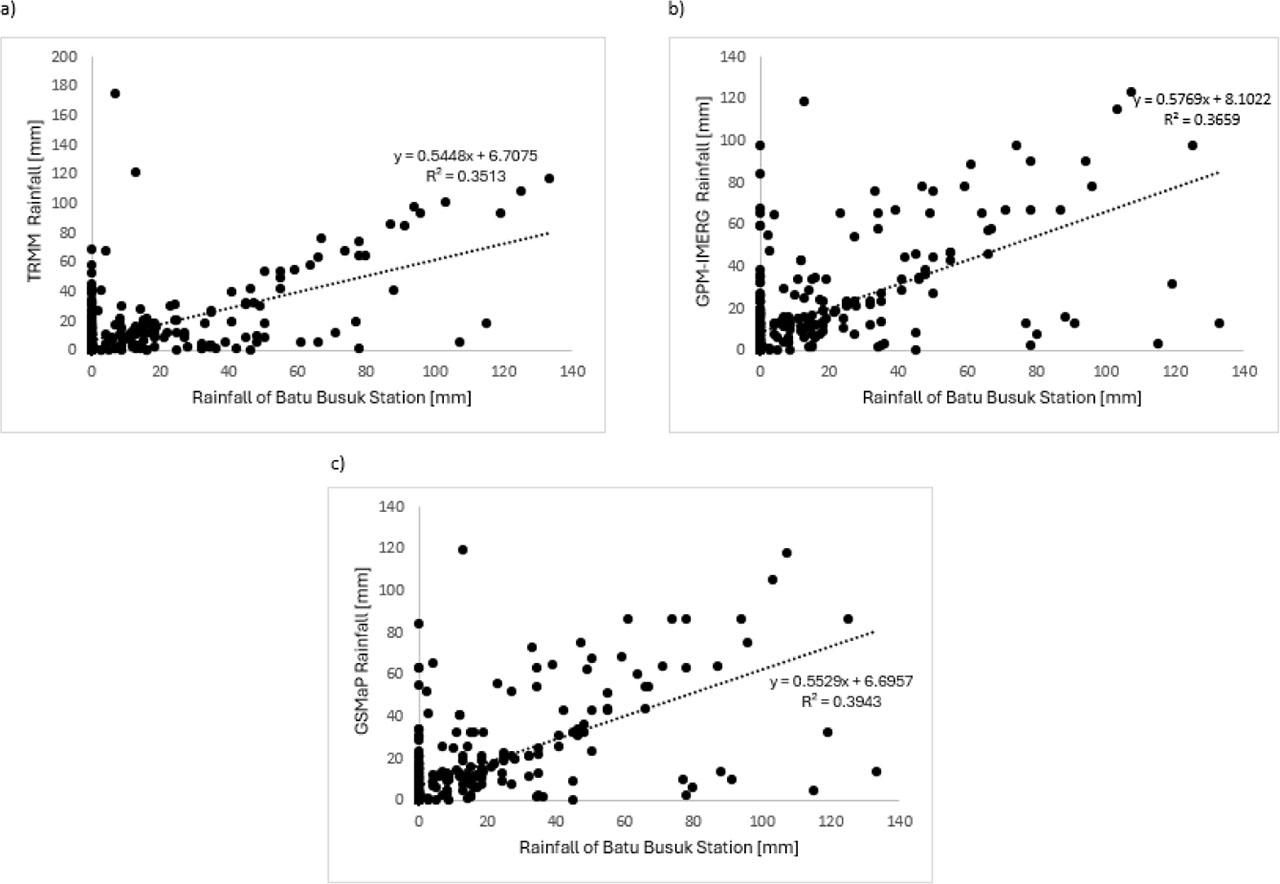
Distribution graph between rainfall at Batu Busuk Station and rainfall predicted by satellite data in 2014, a) TRMM satellite, b) GPM-IMERG satellite, and c) GSMaP satellite
The linear regression graphs in Figure 2 show the relationship between rainfall measurements at Batu Busuk Station and rainfall estimates from satellite data (TRMM, GPM-IMERG, and GSMaP). These graphs show varying levels of accuracy. While all three indicate a positive relationship, the coefficients of determination (R2) are low: 0.351 for TRMM, 0.366 for GPMIMERG, and 0.362 for GSMaP. These R2 values suggest that the linear regression method explains only 35–36% of the data’s variation. This suggests that satellite estimates account for only a small portion of the observed rainfall variability, indicating significant inaccuracies, especially for high-intensity events. These inaccuracies may be due to factors such as limited spatial resolution, topographic influences, and variable meteorological conditions in the study area.
Figures 3 and 4 show the linear regression graphs and coefficients of determination (R2) obtained during the estimation of missing rainfall data for the Limau Manis and Gunung Nago observation stations, respectively.
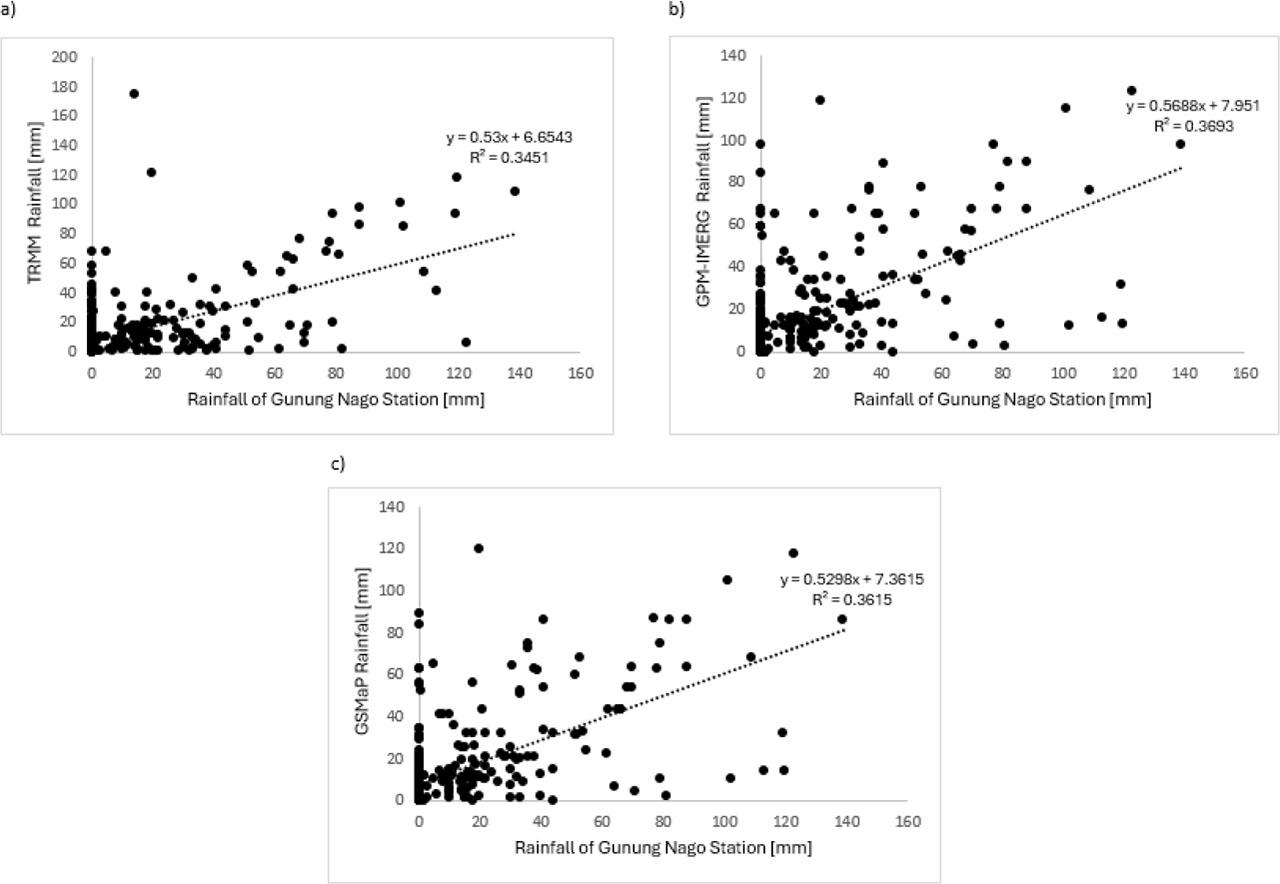
Distribution graph between rainfall at Gunung Nago Station and rainfall predicted by satellite data in 2014, a) TRMM satellite, b) GPM-IMERG satellite, and c) GSMaP satellite
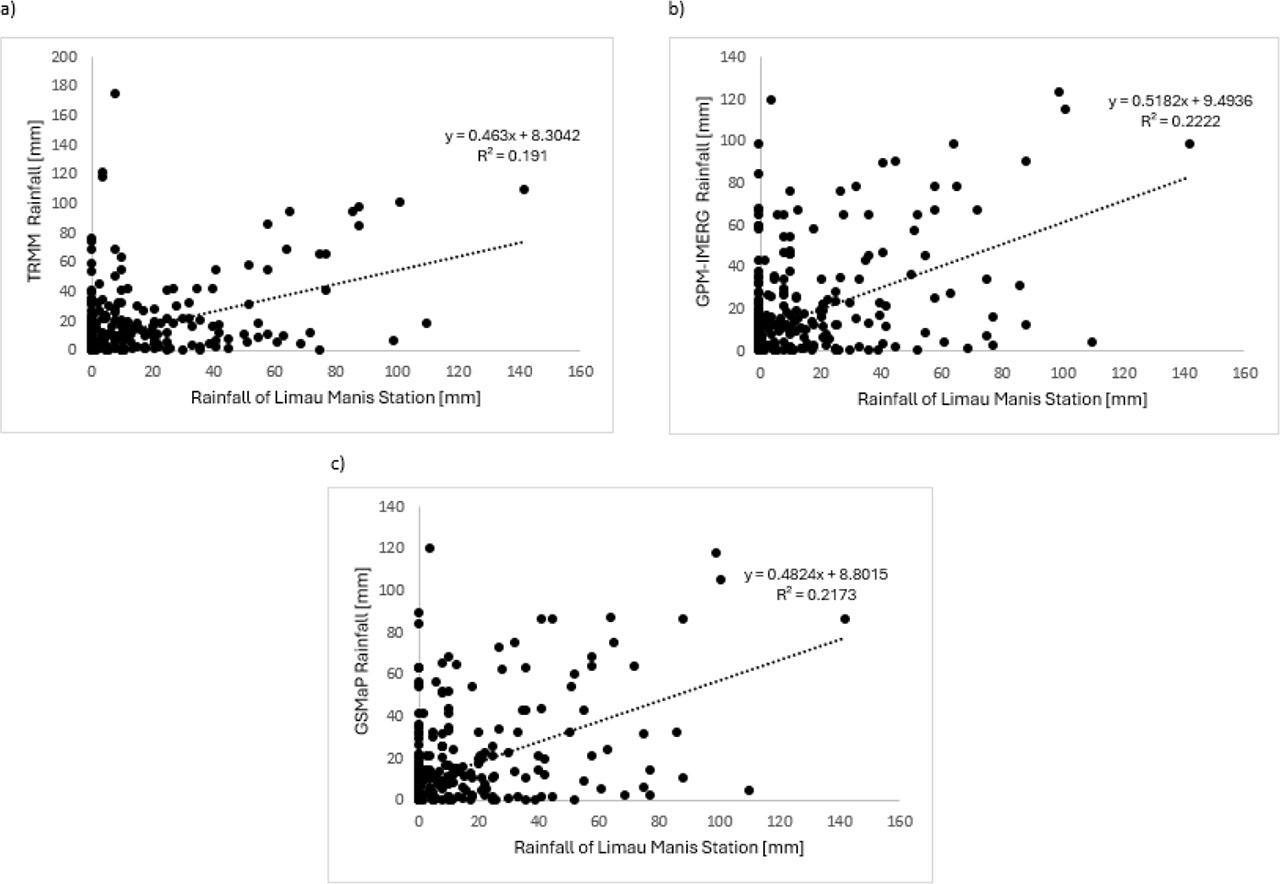
Distribution graph between rainfall at Limau Manis Station and rainfall predicted by satellite data in 2014, a) TRMM satellite, b) GPM-IMERG satellite, and c) GSMaP satellite
The regression analysis in Figure 3 reveals a positive linear relationship between the three satellite data sources and the rainfall data from Gunung Nago Station. The R2 values vary, indicating that the linear regression method explains 34–36% of the data’s variation. The GPM-IMERG satellite shows the strongest correlation, suggesting its rainfall estimates are more accurate than those of TRMM and GSMaP for this station.
As shown in Figure 4, the regression graphs for the three satellites demonstrate that the rainfall data has a lower correlation than the data from the Batu Busuk and Gunung Nago stations. At the Limau Manis station, this linear model explains 19–22% of the rainfall data variability.
Similarly, the estimation procedure was applied to daily rainfall data from 2015 and 2016. The recalculated regression equations and R2 values for each year are presented in Tables 1 and 2, respectively.
Recapitulation of Linear Regression Equations in Estimating Missing Rainfall Data in 2015
| Observation Station | Satellite data | Linear Regression Equation | R2 [-] |
|---|---|---|---|
| Batu Busuk | TRMM | y = 0.4335x + 5.6047 | 0.3089 |
| GPM-IMERG | y = 0.4357x + 7.8819 | 0.2985 | |
| GSMaP | y = 0.4505x + 8.6002 | 0.2961 | |
| Gunung Nago | TRMM | y = 0.206x + 7.8342 | 0.0788 |
| GPM-IMERG | y = 0.2304x + 9.9243 | 0.0944 | |
| GSMaP | y = 0.2411x + 10.688 | 0.0959 | |
| Limau Manis | TRMM | y = 0.2778x + 7.6487 | 0.0784 |
| GPM-IMERG | y = 0.3133x + 9.6995 | 0.0954 | |
| GSMaP | y = 0.3262x + 10.464 | 0.0960 |
Recapitulation of Linear Regression Equations in Estimating Missing Rainfall Data in 2016
| Observation Station | Satellite data | Linear Regression Equation | R2 [-] |
|---|---|---|---|
| Batu Busuk | TRMM | y = 0.4595x + 4.6877 | 0.4659 |
| GPM-IMERG | y = 0.7002x + 7.8673 | 0.5021 | |
| GSMaP | y = 0.5752x + 6.8665 | 0.4637 | |
| Gunung Nago | TRMM | y = 0.141x + 8.1554 | 0.2421 |
| GPM-IMERG | y = 0.1679x + 13.905 | 0.1592 | |
| GSMaP | y = 0.1456x + 11.703 | 0.1639 | |
| Limau Manis | TRMM | y = 0.3968x + 5.9521 | 0.2292 |
| GPM-IMERG | y = 0.5874x + 9.9886 | 0.2331 | |
| GSMaP | y = 0.5334x + 8.0376 | 0.2630 |
Table 1 shows that GPM-IMERG and GSMaP beat TRMM in estimating lost rainfall in 2015, with higher R2 values. The Batu Busuk station consistently demonstrated higher R2 values, indicating more accurate rainfall estimations. These disparities are due to variances in satellite algorithms, resolution, and sensitivity to environmental factors.
As shown in Table 2, the linear regression equation for estimating missing rainfall data in 2016 reveals that the Batu Busuk station has a higher R2 value than the other two stations. The GPM-IMERG satellite has the highest R2 value (0.5021). In contrast, the linear regression model for the Gunung Nago station has a relatively low R2 value (below 0.2), suggesting it explains less of the rainfall data variation. The R2 value for this station is also low, with the highest recorded value (0.2630) measured by the GPM-IMERG satellite.
Tables 3–5 present a comparison of the missing rainfall data filling approaches, showing the adjusted regression models and estimations produced by the linear regression and regional weighting methods.
Performance Assessment Results of the Missing Rainfall Filling Method in 2014
| Station Analyzed | Parameter Statistics | Linear Regression Method | Regional Weighting Method | ||
|---|---|---|---|---|---|
| TRMM | GPM-IMERG | GSMaP | |||
| Batu Busuk | R [-] | 0.75 | 0.76 | 0.75 | 0.93 |
| RMSE [-] | 16.94 | 16.17 | 16.77 | 8.89 | |
| NSE [-] | 0.50 | 0.54 | 0.51 | 0.86 | |
| RB [%] | 40.16 | 24.47 | 32.52 | 0.01 | |
| Gunung Nago | R [-] | 0.74 | 0.76 | 0.76 | 0.92 |
| RMSE [-] | 17.57 | 16.61 | 17.27 | 9.90 | |
| NSE [-] | 0.48 | 0.54 | 0.50 | 0.84 | |
| RB [%] | 43.54 | 27.77 | 36.04 | −0.03 | |
| Limau Manis | R [-] | 0.62 | 0.65 | 0.66 | 0.78 |
| RMSE [-] | 16.53 | 15.76 | 15.80 | 13.72 | |
| NSE [-] | 0.37 | 0.43 | 0.42 | 0.57 | |
| RB [%] | 25.49 | 9.32 | 20.12 | 0.02 | |
Performance Assessment Results of the Missing Rainfall Filling Method in 2015
| Station Analyzed | Parameter Statistics | Linear Regression Method | Regional Weighting Method | ||
|---|---|---|---|---|---|
| TRMM | GPM-IMERG | GSMaP | |||
| Batu Busuk | R [-] | 0.78 | 0.78 | 0.77 | 0.63 |
| RMSE [-] | 16.20 | 15.25 | 14.86 | 18.39 | |
| NSE [-] | 0.40 | 0.46 | 0.49 | 0.23 | |
| RB [%] | 53.89 | 42.87 | 36.61 | −0.03 | |
| Gunung Nago | R [-] | 0.63 | 0.65 | 0.64 | 0.74 |
| RMSE [-] | 19.93 | 19.04 | 18.72 | 22.23 | |
| NSE [-] | 0.20 | 0.27 | 0.29 | −0.01 | |
| RB [%] | 62.96 | 52.97 | 48.36 | −0.01 | |
| Limau Manis | R [-] | 0.77 | 0.80 | 0.75 | 0.67 |
| RMSE [-] | 13.21 | 11.98 | 11.92 | 19.04 | |
| NSE [-] | 0.35 | 0.47 | 0.47 | −0.34 | |
| RB [%] | 58.89 | 47.21 | 40.01 | 0.04 | |
Performance Assessment Results of the Missing Rainfall Filling Method in 2016
| Station Analyzed | Parameter Statistics | Linear Regression Method | Regional Weighting Method | ||
|---|---|---|---|---|---|
| TRMM | GPM-IMERG | GSMaP | |||
| Batu Busuk | R [-] | 0.84 | 0.85 | 0..83 | 0.66 |
| RMSE [-] | 19.60 | 13.27 | 15.94 | 22.83 | |
| NSE [-] | 0.38 | 0.71 | 0.59 | 0.16 | |
| RB [%] | 62.51 | 14.90 | 36.95 | 0.05 | |
| Gunung Nago | R [-] | 0.50 | 0.45 | 0.47 | 0.55 |
| RMSE [-] | 57.24 | 55.57 | 56.37 | 49.08 | |
| NSE [-] | 0.04 | 0.10 | 0.07 | 0.30 | |
| RB [%] | 75.40 | 56.40 | 65.39 | 0.04 | |
| Limau Manis | R [-] | 0.68 | 0.67 | 0.70 | 0.56 |
| RMSE [-] | 16.82 | 15.33 | 14.67 | 23.80 | |
| NSE [-] | 0.31 | 0.42 | 0.47 | −0.39 | |
| RB [%] | 50.95 | −2.25 | 19.50 | −0.05 | |
Table 3 demonstrates the analysis of the performance of the missing rainfall filling method in 2014. The Regional Weighting method consistently demonstrated superior performance across three stations, exhibiting the highest correlation (R), efficiency (NSE), and lowest relative bias (RB). This indicates its strong ability to accurately capture rainfall patterns. While the Linear Regression method showed comparable performance at most stations, it generally had lower accuracy and higher bias. Specifically, at Batu Busuk, Regional Weighting achieved an R-value of 0.93 and an NSE of 0.86. Similarly, at Gunung Nago, it excelled with an R-value of 0.92, an NSE of 0.84, and the lowest RB. At Limau Manis, the Regional Weighting method continued its strong performance with an R-value of 0.78 and an NSE of 0.57. Overall, the Regional Weighting method proved superior to the Linear Regression method in capturing rainfall patterns at all three observed stations.
Based on Table 4, the Linear Regression method, utilizing both GPM-IMERG and GSMaP satellite data, generally exhibited superior performance compared to the Regional Weighting method in terms of correlation (R), RMSE, and NSE. However, the Regional Weighting method excelled in relative bias (RB), showing values closer to zero, particularly at the Batu Busuk and Limau Manis stations. The highest R-value (0.80) was observed for the Linear Regression method using GPMIMERG satellite data at Limau Manis station, while the lowest (0.63) came from the Regional Weighting method. Although Regional Weighting recorded the highest R-value (0.74) at Gunung Nago station, RMSE analysis indicated that Linear Regression with GPM-IMERG and GSMaP satellites had smaller prediction errors across all stations. Furthermore, the highest NSE values were achieved by the Linear Regression method, with GSMaP reaching 0.49 at Batu Busuk, whereas the Regional Weighting method showed negative NSE values at Gunung Nago (−0.01) and Limau Manis (−0.34). Conversely, the Regional Weighting method demonstrated a very small relative bias compared to the Linear Regression method, which tended to overestimate with significantly positive RB values, such as TRMM reaching 53.89%. These results confirm that while the Linear Regression method is more accurate in representing rainfall patterns, the Regional Weighting method is more reliable in terms of bias estimation.
As shown in Table 5, the linear regression method, particularly when using satellite precipitation products such as GPM-IMERG and GSMaP, consistently outperforms the regional weighting method. At Batu Busuk Station, linear regression with GPM-IMERG had the highest correlation (R) of 0.85 and the lowest root mean square error (RMSE) of 13.27. This method also had good Nash-Sutcliffe efficiency (NSE) of 0.71, though it had moderate relative bias (RB) of 14.90% overestimation. At Gunung Nago Station, all methods showed a decline in performance. However, Linear Regression with GSMaP was slightly better in terms of R (0.55) and RMSE (56.37). It should be noted that the RB was very high (up to 75.40%), indicating significant overestimation. This is in contrast to the minimal bias in the Regional Weighting Method (0.004%). At Limau Manis Station, Linear Regression with GSMaP was the best method, showing the highest R (0.70) and relatively low RMSE (14.67). GPMIMERG Linear Regression showed slightly more desirable underestimation (RB = −2.25%), while Regional Weighting Method showed poor predictive performance, with negative NSE. Thus, although satellite-based linear regression methods offer higher accuracy, spatial variations must be considered, and careful validation and calibration are necessary to address potential location-based biases.
An evaluation of the overall statistical parameters for the 2014–2016 data revealed a fairly strong correlation in R values across all methods and locations, though variations occurred between years and locations. The linear regression method using the GPM-IMERG satellite consistently produced the highest R values in nearly all locations and years, suggesting greater predictive accuracy than other methods. Regional weighting produced relatively lower R values, suggesting that it may be less effective than linear regression in this context. Variation in R values among locations (Limau Manis, Gunung Nago, and Batu Busuk) highlights the influence of spatial characteristics on satellite product performance.
A comprehensive statistical evaluation shows relatively strong correlations (R values) for all methods and locations, although variations exist between years and locations. The linear regression method using the GPM-IMERG satellite consistently produces the highest R values in most locations and years, indicating better prediction accuracy compared to other methods. In contrast, regional weighting shows comparatively lower R values, suggesting it may be less effective than linear regression in this context. The variation in R-values between locations (Batu Busuk, Limau Manis, and Gunung Nago) suggests that spatial characteristics influence the performance of the satellite data (Andari et al., 2024b).
Overestimation or underestimation of satellite estimations may be caused by the spatial variability of weather systems and potential errors in rain gauge data (de Moraes Cordeiro & Blanco, 2021). The frequency of short-lived convective complexes, which occur within a few hours and are not always fully captured by satellites, contributes to precipitation forecast inaccuracy (Soares et al., 2016). Thus, discrepancies between rainfall data and satellite estimates arise from various factors, including errors in precipitation estimation algorithms, errors in algorithms used to aggregate estimates, satellite sampling limitations, and errors in bias correction algorithms for rain gauges (dos Santos et al., 2021), (Andari et al., 2024a).
Compared to prior research using statistical methods for filling missing rainfall data, such as (Portuguez-maurtua et al., 2022) and (Camuffo et al., 2022), this study found slightly lower Root Mean Square Error (RMSE) and RB values, with sufficiently high correlation values for both methods. This discrepancy may be due to variations in climatic conditions, such as alternating wet and dry periods, and the occurrence of significant rainfall events, which can affect the direct comparison of results across different regions is discrepancy could be attributed to variations in climatic conditions, characterized by alternating periods of wet and dry weather, as well as the occurrence of substantial rainfall events. These factors potentially influence the direct comparison of results across different geographical regions (Duarte et al., 2022).
Completing missing data is often a complex and time-consuming task, but it is essential for effective water resource planning and management. Satellite data has shown similar behavior to data from nearby rain gauges in estimating missing hydrological data within the study area, indicating its potential as a data source for analysis (Bárdossy & Pegram, 2014).
The utilization of satellite data to address the deficit in observational rainfall data carries profound ramifications for hydrological studies, weather forecasting, and climate monitoring. Satellite data like GPM-IMERG and GSMaP offer high spatial resolution, improving the accuracy of rainfall estimates across geographic areas (de Moraes Cordeiro & Blanco, 2021). This is particularly useful in areas with complex terrain or inadequate rain gauge networks (Chua et al., 2023). Then, satellite data is an effective solution for addressing deficiencies in observational datasets, especially when conventional methods are ineffective due to constraints such as instrument failures, maintenance issues, or natural barriers like mountains that impede radar observations (Lutfiah et al., 2024).
While this study successfully demonstrates the potential of both linear regression and regional weighting methods, particularly with GPM-IMERG satellite data, for addressing missing daily rainfall data in the Kuranji watershed, several limitations affect the broader interpretation of its findings. The inherent spatial resolution limitations of satellite data, coupled with topographic influences and variable meteorological conditions in the study area, can lead to inaccuracies, especially for high-intensity rainfall events. Furthermore, potential errors within the satellite’s precipitation estimation and aggregation algorithms, as well as bias correction algorithms for rain gauges, contribute to discrepancies between observed and estimated rainfall. The challenge of accurately filling daily and sub-daily rainfall data is also acknowledged due to its high unpredictability. Finally, the generalizability of these results to other regions may be limited given the influence of varying climatic conditions.
This study demonstrates that satellite-based rainfall estimation, especially using the GPM-IMERG product, is effective for filling gaps in daily rainfall data in the Kuranji watershed, Padang. The linear regression method utilizing satellite data achieved higher correlation and Nash-Sutcliffe efficiency across most observation stations compared to the regional weighting approach, although the latter showed superior performance in minimizing relative bias. Variations in method performance across locations underscore the importance of considering spatial characteristics and local meteorological conditions. The findings imply that integrating satellite rainfall data can enhance the quality and completeness of rainfall records, which is critical for water resource management, disaster mitigation, and hydrological research, particularly in regions with limited ground-based observations. Future research should focus on developing more adaptive calibration and validation techniques to improve accuracy during intense rainfall and diverse climatic conditions.