

Intersections are typically regarded as the most critical points of the urban road network. The efficiency of intersections significantly impacts the overall efficiency of road networks (Al-Rubaee & Hameed, 2024), (Khalaf et al., 2015), (Joni & Jasim, 2022). The transportation network has seen substantial stresses caused by rising trends in population expansion and urbanization (Latief et al., 2023), (Hamed & Husein, 2024). The increasing demand for traffic at intersections with limited capacity results in congestion. The primary cause of traffic congestion is the continuous crowding that results from the ongoing growth of urban areas in various cities worldwide. Urban cities generally face a growing daily problem that worsens and becomes unmanageable; therefore, it is a significant concern for the public. Air pollution, psychological impacts, and service levels (represented by delays) are among the effects of traffic congestion (Danquah, 2010). The rapid increase in Iraq's population, particularly in Baghdad, which is expected to surpass 10 million, has a significant impact on many aspects of society, including transportation networks. The substantial population growth immediately coincides with an increase in the number of vehicles using the traffic networks (Abduljabbar, 2022). The significant growth in the number of vehicles directly correlates with the increasing congestion observed in Baghdad over recent years. In Baghdad, statistics indicate that the total number of private vehicles, including those with permanent, temporary, and newly registered plates, was approximately 2,087,039 in 2015, rising to nearly 2,791,639 in 2022 (Statistics, 2022). This increase is equivalent to a 4.5% increase in the number of vehicles per year. This percentage increase implies that it is necessary to evaluate the efficiency of the existing transportation system.
Traffic congestion is a global issue, particularly in Baghdad, due to the presence of numerous vital centers and the absence of modern techniques and traffic management studies to mitigate its negative impacts (Mohammed, 2019), (Al-Jabbar et al., 2011), (Aboud et al., 2019). During peak hours, several significant roundabouts are unable to handle the increasing volume of traffic. This has become a specific problem in areas where roundabouts link major and minor road networks (Shadhan & Alkaissi, 2022).
At roundabouts, unbalanced flows, high directional flows, and excessive approach demand reduce capacity because priority control is ineffective for one or more approaches (Osei et al., 2021). (Rodegerdts, 2010) stated that the flow from one entry may dominate downstream entries during peak periods to the extent that there are not enough gaps available, resulting in excessive delays and queues at the downstream entry. Prior research has examined the function of traffic signals at roundabouts, with different conclusions. (Jurewicz et al., 2015) and (Stevens, 2005) argued that signalized roundabouts enhance the operational efficiency in some congested roundabouts. However, the performance of traffic flow is not always significantly improved by signaling roundabouts. (Chimdessa et al., 2013) Suggests that traffic signals and roundabouts can effectively manage medium-traffic volumes before reaching high volumes. They recommend a combined system of controlling traffic lights and circuits in areas with medium or high traffic volumes before converting them into signalized intersections. However, these studies did not clearly assess the efficacy of signaling a roundabout in comparison to converting it into a fully signalized intersection under identical traffic circumstances. In order to address that gap, this study implements and evaluates a signalized roundabout as an intermediary stage before its potential changes to a fully signalized intersection, using an advanced traffic simulation model developed with the VISSIM software to assess the operational efficiency of the signalized intersection in terms of vehicle delay and queue length. The results of simulation models for the roundabout and signalized intersections are compared to investigate the effect on their operational performance.
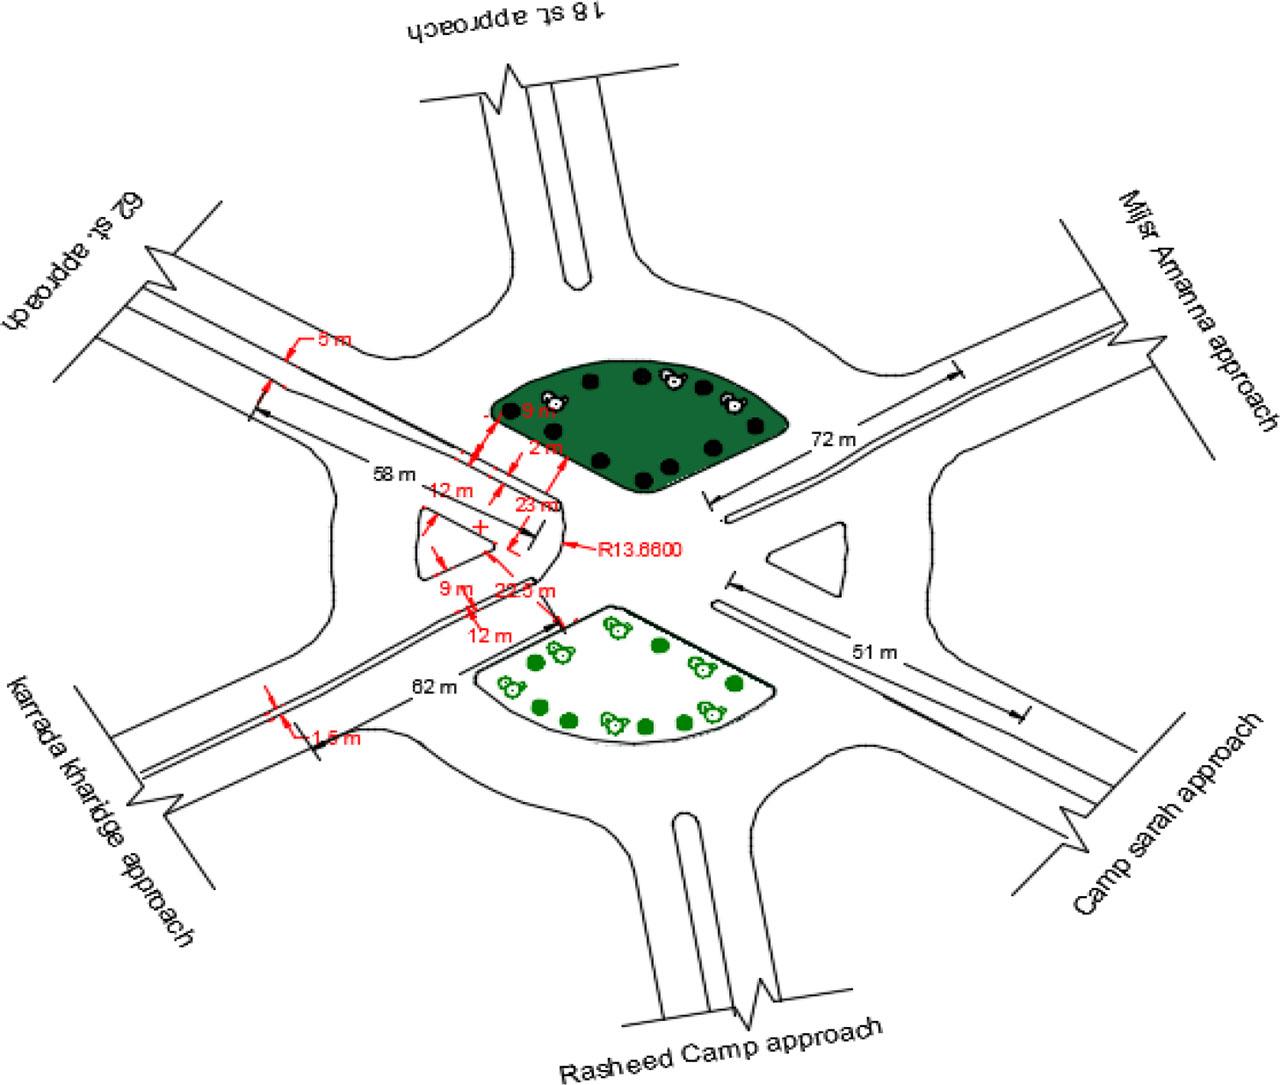
Al-Karrada Al-Sharqiya is the most significant district in Baghdad, due to its diverse mix of land uses, including commercial, educational, and residential areas, which serve as a center of activity and a representation of the vibrant urban life of Baghdad. Karrada is located on the eastern side of Tigris River, known as the Rusafa side of Baghdad. Abdelkader El Jazairi's roundabout is a six-leg roundabout with geometric characteristics shown in Table 1. The location of the case study is shown in Figure 1 Abdelkader El Jazairi's roundabout represents one of the most congested roundabouts in Baghdad city. During peak hours, poor traffic conditions were noted, often exceeding the roundabout's designed capacity. A frequent source of concern has been the queues that develop on major roads during peak periods. These queues are the result of the continuous flow of circulating traffic, which effectively blocks the entrance to the roundabout, causing traffic to spill back onto major roads and resulting in delays.
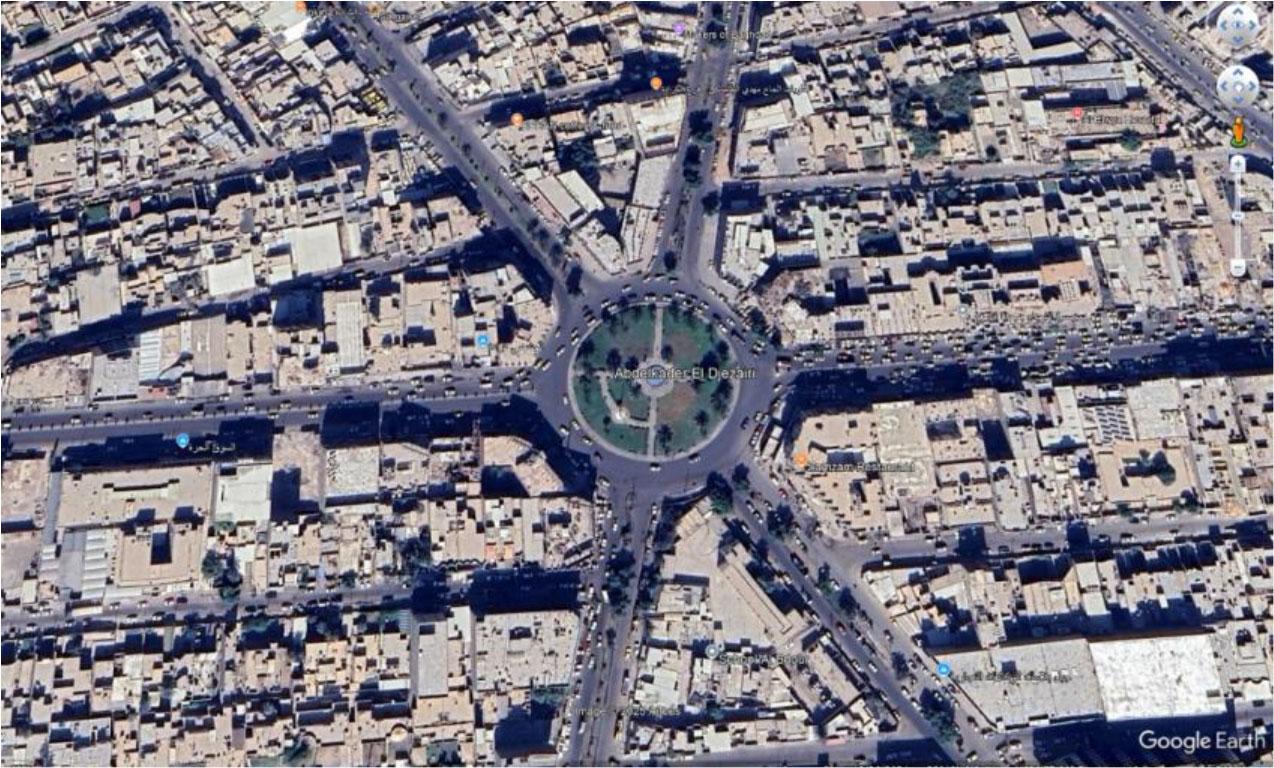
Google earth map of Abdelkader El jazairi Square
Geometric features of the roundabout’s approaches
| Approach | No. of lanes | Approach width [m] |
|---|---|---|
| Karrada Kharidge | 2 | 9 |
| 62 Street | 2 | 9 |
| 18 Street | 2 | 9 |
| Mijsr Amanna | 2 | 9 |
| Camp Sarah | 2 | 9 |
| Rasheed Camp | 2 | 9 |
Repeated visual visits are conducted, and information from traffic policies is collected to assess the performance of a selected study area. A decision on the peak flow periods has been reached based on these repeated visual visits. Video count was used in this study. Beginning on Sunday, 10 October 2024, traffic volumes were calculated from recorded videos by movement for the six approaches over a five-day period in favourable weather conditions. Data collection periods were from 8:00 am to 10:00 am for morning peak hours and from 1:00 pm to 3:00 pm for afternoon peak hours. Abdelkader El Jazairi Square had a peak hour volume of approximately 5,603 vehicles per hour between 8:00 and 9:00 AM on Thursday. The number of vehicles at the roundabout during the highest observed day is shown in Table 2. Figure 2 illustrates the hourly Traffic histogram of the highest observed day. Figure 3 illustrates the peak hours traffic volume in the studied roundabout, showing the distribution of traffic volume in correlation with the days and times of the week. The vehicle types were classified using data from Traffic Survey, a video analytics platform that utilizes artificial intelligence and machine learning to extract accurate traffic data automatically from recorded videos (Datafromsky), which showed that passenger cars constituted 82%, light trucks 5%, heavy vehicles 1%, vans 4% and motorcycles 7% of the total volume.
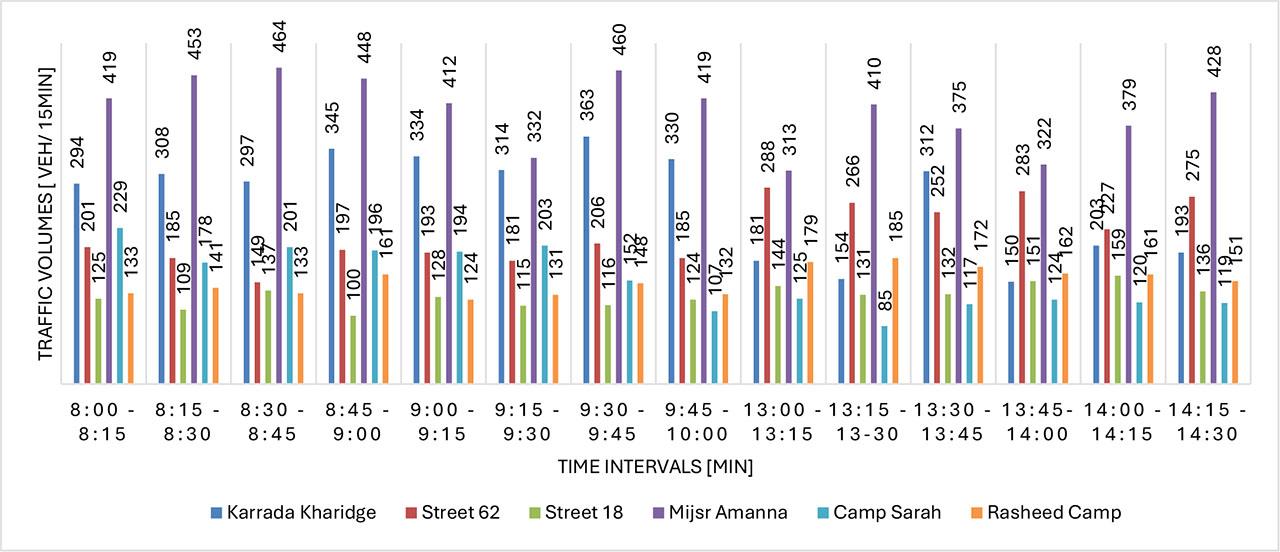
Hourly traffic load distribution by leg at the roundabout
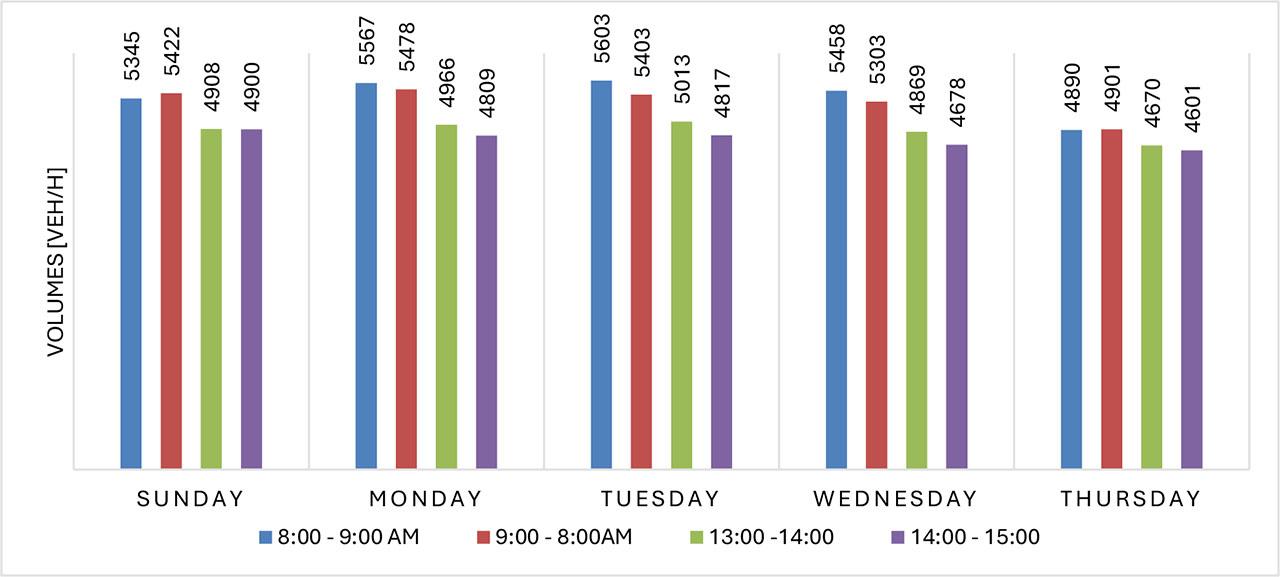
Peak hours traffic volume of Abdelkader El Jazairi Square
The number of vehicles at the roundabout during the highest observed day
| Time Interval [min] | Karrada Kharidge [veh] | Street 62 [veh] | Street 18 [veh] | Mijsr Amanna [veh] | Camp Sarah [veh] | Rasheed Camp [veh] |
|---|---|---|---|---|---|---|
| 8:00 – 8:15 | 294 | 201 | 125 | 419 | 229 | 133 |
| 8:15 – 8:30 | 308 | 185 | 109 | 453 | 178 | 141 |
| 8:30 – 8:45 | 297 | 149 | 137 | 464 | 201 | 133 |
| 8:45 – 9:00 | 345 | 197 | 100 | 448 | 196 | 161 |
| Total | 1244 | 732 | 471 | 1784 | 804 | 568 |
| 9:00 – 9:15 | 334 | 193 | 128 | 412 | 194 | 124 |
| 9:15 – 9:30 | 314 | 181 | 115 | 332 | 203 | 131 |
| 9:30 – 9:45 | 363 | 206 | 116 | 460 | 152 | 148 |
| 9:45 – 10:00 | 330 | 185 | 124 | 419 | 107 | 132 |
| Total | 1341 | 765 | 483 | 1623 | 656 | 535 |
| 13:00 – 13:15 | 181 | 288 | 144 | 313 | 125 | 179 |
| 13:15 – 13-30 | 154 | 266 | 131 | 410 | 85 | 185 |
| 13:30 – 13:45 | 312 | 252 | 132 | 375 | 117 | 172 |
| 13:45– 14:00 | 150 | 283 | 151 | 322 | 124 | 162 |
| Total | 797 | 1089 | 558 | 1420 | 451 | 698 |
| 14:00 – 14:15 | 203 | 227 | 159 | 379 | 120 | 161 |
| 14:15 – 14:30 | 193 | 275 | 136 | 428 | 119 | 151 |
| 14:30 – 14:45 | 136 | 271 | 138 | 294 | 119 | 149 |
| 14:45 – 15:00 | 142 | 255 | 149 | 331 | 122 | 160 |
| Total | 674 | 1028 | 582 | 1432 | 480 | 621 |
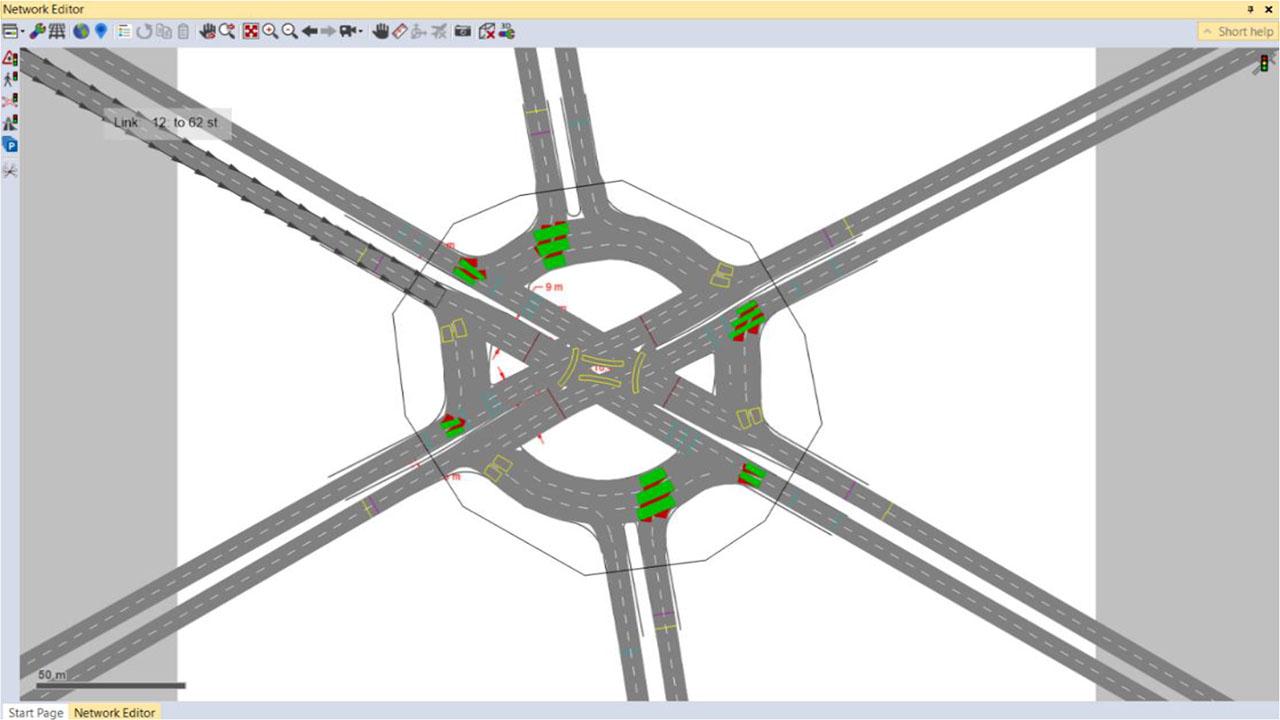
Recently, simulation models have been widely used globally to evaluate the effectiveness of various traffic infrastructure and management techniques for creating efficient and sustainable transportation networks (Farrag et al., 2020), (Badshah et al., 2022), (Mutar et al., 2021), (AL SHAIKHLI et al., 2024). The microscopic traffic simulation software PTV VISSIM version 2024 (thesis) is used to develop the roundabout model and simulate traffic conditions. The roundabout model was created by scaling a satellite image of a road section to match its actual dimensions. Drawing straight roads and linking them to the roundabout map was part of the modeling process. To ensure that vehicles yield to oncoming traffic, priority rules were allocated for entering approaches. Traffic survey data was used to create traffic flow parameters, and traffic input was represented by dynamic assignment. Based on traffic patterns and peak hour volumes, zones, origins-destinations, and routes were defined. Figure 4 shows VISSIM simulation model for the selected roundabout.
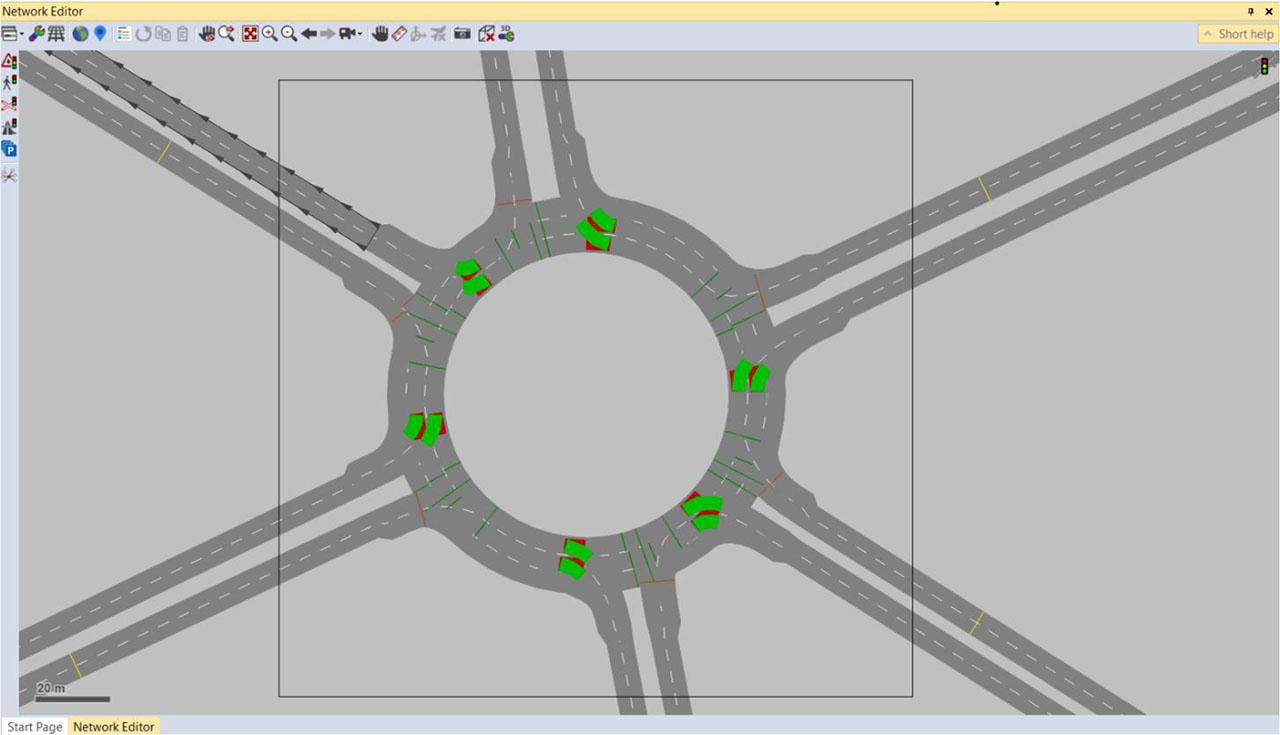
VISSIM simulation model of Abdelkader El jazairi square
Understanding of heterogeneous driving conditions may be enhanced by the calibration of microscopic simulation models (Jehad et al., 2022). The calibration and validation of microsimulation models is a crucial step in ensuring the models' reliability in representing local conditions (Farrag et al., 2020), (Alkaissi, 2024). Specific calibration processes are crucial when calibrating a microsimulation model for mixed traffic, given the distinct features of this traffic type Therefore, a three-step approach is proposed: vehicle modeling, geometry modeling, and traffic modeling. After that, a multi-parameter sensitivity analysis is conducted, with ranges selected heuristically and parameter values determined through an optimization model. The traffic representation considers various distinguishing features of mixed traffic. First, the model must be simulated using the default settings (before calibration) to assess the necessity of calibration. The outcome values are compared to field values; if the error is insignificant, the model with default settings may be accepted without further adjustment. Significant errors necessitate the implementation of calibration procedures.
To calibrate the PTV VISSIM program in this study, the car-following model and lane-changing parameters were calibrated based on the nearby signalized intersection (Al-Masbah intersection) within the study area. The intersection was selected for calibration due to its consistent traffic behavior and flow characteristics, which correspond with those observed at the roundabout. The simulation model results were compared with the average delay calculated using the HCM method based on actual field data. The comparison revealed a significant error percentage of approximately 17.4%, which indicates unacceptable convergence, necessitating the need for calibration. Calibration is accomplished based on the average delay of the Signalized Intersection (Al-Masbah Intersection). The Elementary Effects (EE) method (Morris, 1991) was used to identify the parameters significantly influencing VISSIM driving behavior. The parameters selected for the sensitivity analysis include 10 parameters related to car-following behavior and three parameters related to lane-change behavior. Five simulation runs were performed for this section to account for model stochasticity. The variables exhibiting a significant elementary effect throughout all three trials were standstill distance (CC0), headway time (CC1), following variation (CC2), and Oscillation acceleration (CC7). Therefore, these four characteristics were determined to be sensitive. Following comprehensive calibration efforts regarding sensitivity analysis conducted on the model used in this study, the values presented in Table 3 are determined to best replicate the field conditions. After iterative driver behavior and lane-changing parameter adjustment, the calibrated simulation model's average delay results were compared to field data. The comparison revealed a 5.3% error, indicating that the calibrated parameters achieved an acceptable level of convergence and an error below 10% between the simulation model and the actual field data.
Default and calibrated values for car following and lane-change model parameters
| Model parameters | Default value | Calibrated value |
|---|---|---|
| look ahead distance [m] | 0 – 250 | 5 – 100 |
| look back distance [m] | 0 – 150 | 30 – 150 |
| Following distance oscillation [m] | 4 | 1.5 |
| Negative speed difference | −0.35 | −0.3 |
| Positive speed difference | 0.35 | 0.3 |
| Oscillation acceleration [m/s2] | 0.25 | 0.4 |
| Waiting time before diffusion [sec] | 60 | 300 |
For the validation process, the roundabout model with calibrated parameters was compared to the results obtained from field observation data to simulate the actual congestion of the roundabout. The average delay results obtained from VISSIM model were compared with the observed field delay data. The percentage difference between the simulation and field data was 7.82%, indicating adequate convergence and an error of less than 10% for validating the simulation model.
The conversion of the roundabout into a signalized intersection is shown in Figure 5, and the simulation model for the signalized intersection is presented in Figure 6. In this process, the four major approaches have been signalized and their geometric characteristic modified by adding left turn lanes to accumulate high left traffic. For the two minor approaches, the geometric characteristics, such as dimensions and lane numbers, remain unchanged. The signal program was optimized by VISSIM, where various timing scenarios were simulated to fine-tune the green splits. The signal timing design procedure started with the calculation of cycle length using Webster’s method, informed by the key lane volumes and expected lost times, and found to be 85 seconds. In order to optimize the signal time in VISSIM, it was necessary to calculate the inter-green interval between conflicting movements based on yellow and all red time. The calculation of yellow change and red clearance was based on the Kell and Fullerton equation (Manual, 2000), resulting in an inter-green of 4 seconds. The signal program is shown in Figure 7.
Abdelkader El jazairi signalized intersection
VISSIM simulation model of signalized intersection
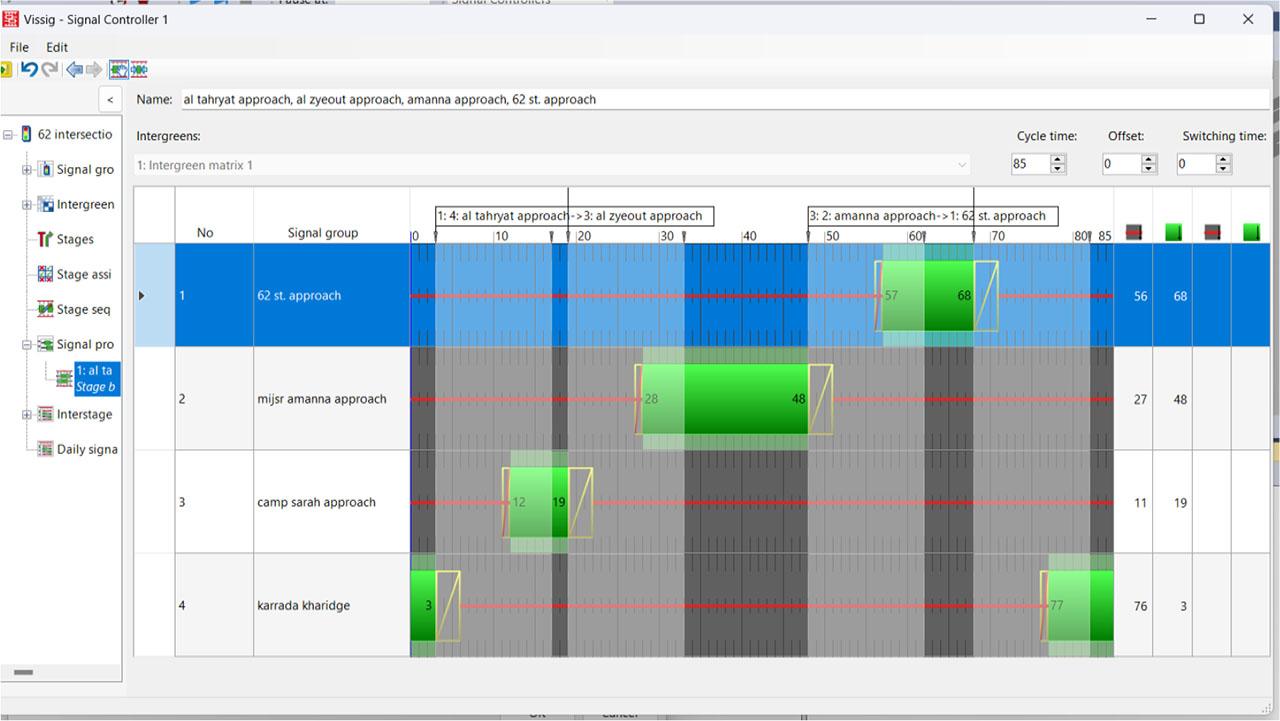
signal program of signalized intersection
The traffic indices used for the performance assessment of the roundabout and the signalized intersection, specifically vehicle delay and queue length, were comprehensively estimated. For every scenario, the simulation duration was set at 3600 s. Several test runs were conducted, and the results were averages of the outputs from the test runs.
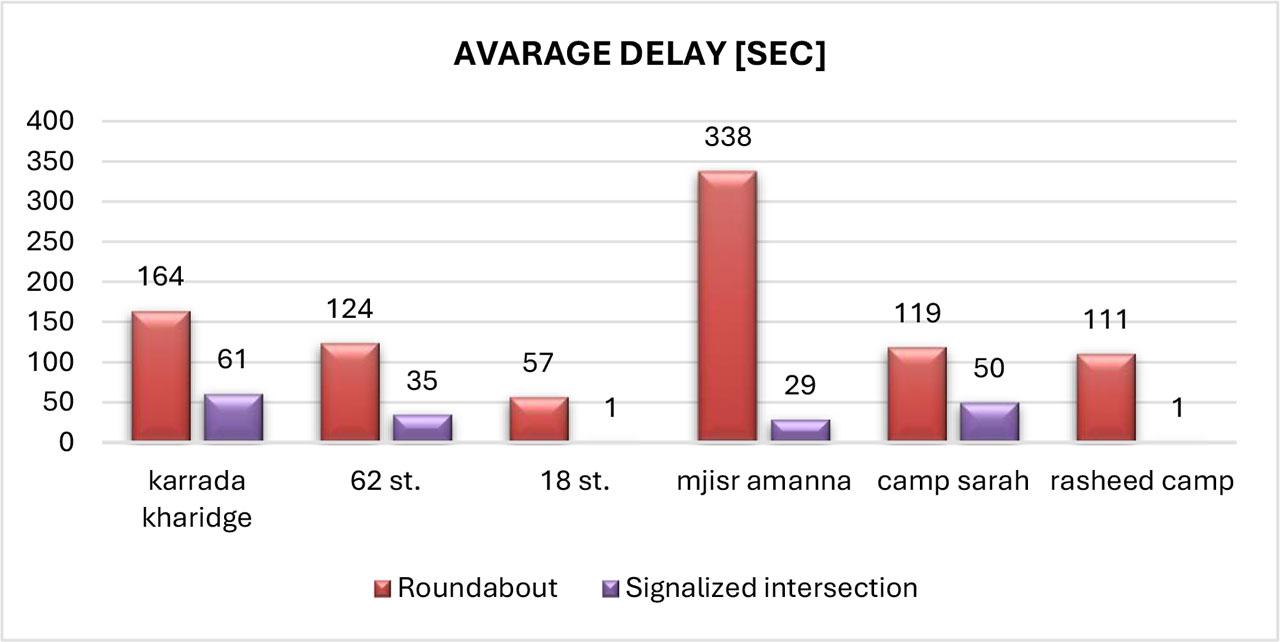
As an intermediate step, the roundabout was partially signalized from the two major approaches with the most significant volume rate. This study was conducted to evaluate the impact of signaling on the roundabout's performance and traffic flow before its conversion to a signalized intersection. Figures 8 and 9 illustrate the comparison of the average delay and queue length between the actual roundabout and the signalized roundabout. Implementing traffic signals on the Karrada Kharidge and Mijsr Amanna approaches, increases the average delay and queue length on these approaches as the vehicles were required to stop during red light. While improving the average delay and queue lengths for the other approaches by ranging from 15% to 78%. However, the roundabout's performance had not significantly improved, and its service level remained at grade F. These findings suggest that partial signalization may result in an imbalanced performance, which could be advantageous for certain movements while adverse to others. This implies that complex multi-leg roundabouts, where traffic volumes and flow patterns are not uniformly distributed, may not be well-suited for partial signal control strategies. In order to accomplish proportionate improvements across all approaches, it may be necessary to implement a more comprehensive solution, such as full signalization or conversion to a signalized intersection.
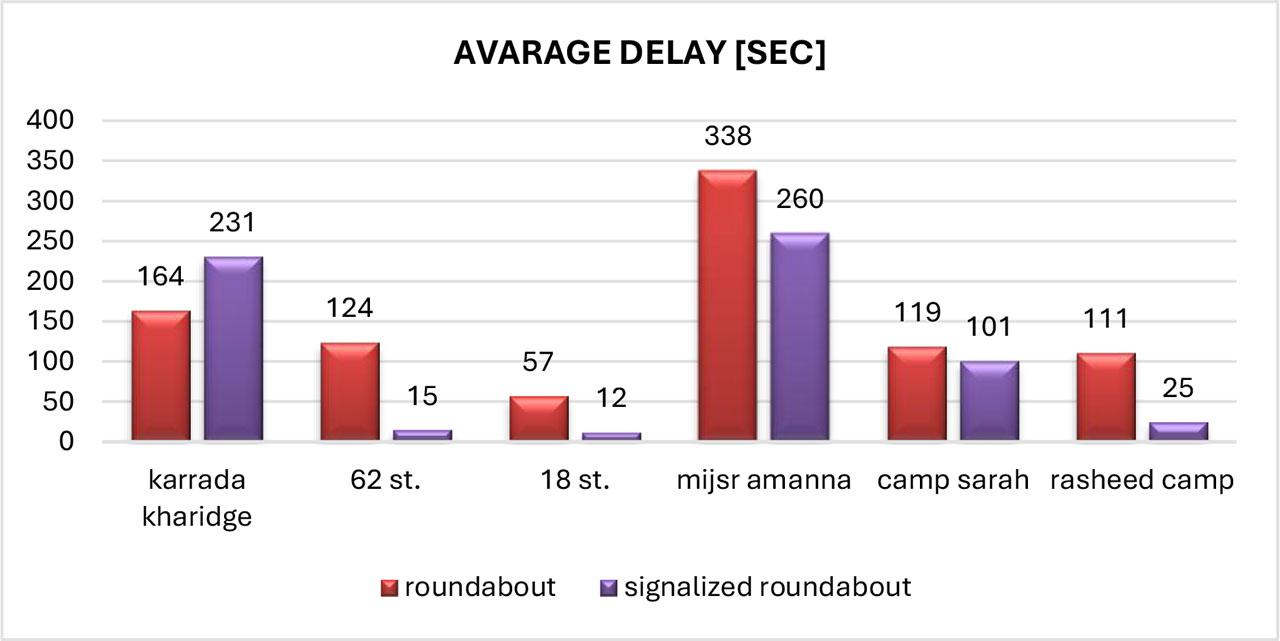
Simulated results of vehicle delay of the roundabout and the signalized roundabout
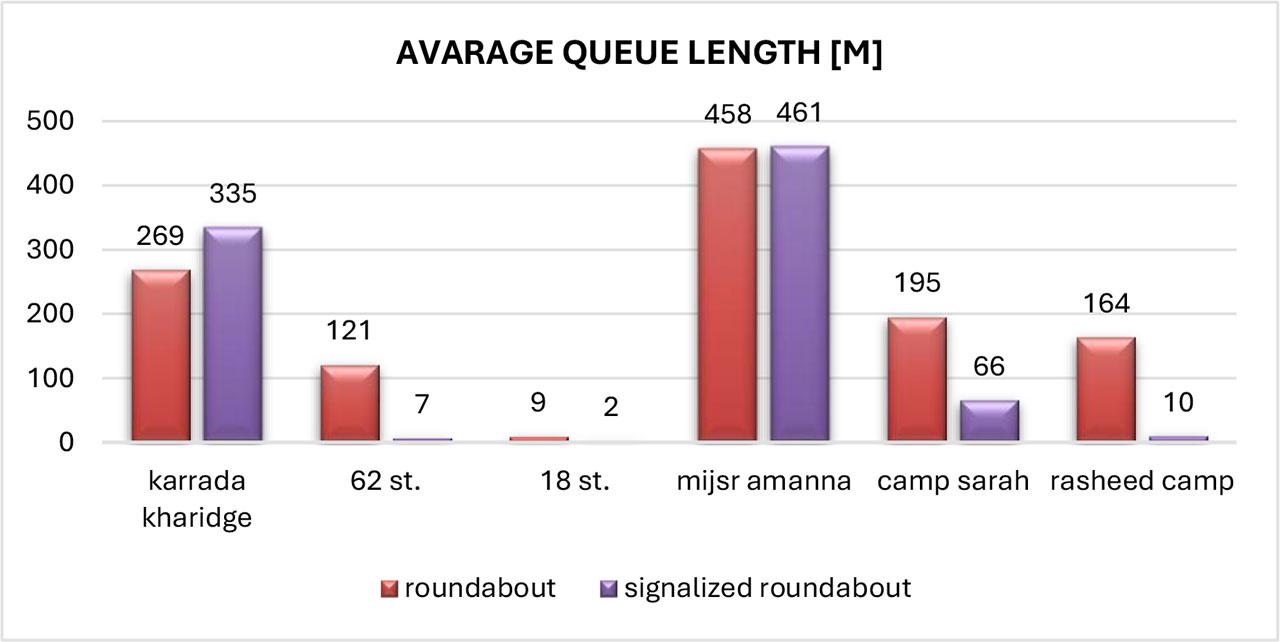
Simulated results of queue length of the roundabout and the signalized roundabout
Figure 10 shows the simulated average vehicle delay for the roundabout and the signalized intersection. It was found that the signalized intersection induced less vehicle delay than the roundabout. The signalized intersection reduced the average vehicle delay by 74% and improved the performance level of service from (F) to (C). The comparison in this study was also conducted for the queue length. Figure 11 presents the simulation result of the average queue length for the roundabout and the signalized intersection. The roundabout showed a longer queue length, especially in Mijsr Amanna and Karrada Kharidge approaches, which experienced longer queues due to the priority-based entry system. For the signalized intersection approaches, it was observed that:
Karrada Karidge's approach experienced improvement in the operational performance, with the level of service enhanced from F to E. The average delay was reduced by 63%, and the queue length decreased by 88%.
Mjisr Amanna's approach has had significant improvements. After experiencing congestion and long queues, its performance has improved significantly. It was exhibiting minor delays and quickly dissipating queue when it arises. It was operated at a level of service C, with a significant reduction in average delay and the queue length, which were about (95 and 98) %, respectively.
62 Street and Camp Sarah approaches were operated at a level of service of D and C; they exhibited a moderate delay and queue length during peak hour. The average delay was reduced by 72% for 62 Street approach and 58% for Camp Sarah approach. The queue length was decreased for both approaches by about 90%.
For the non-signalized approaches, both 18 Street and Rasheed camp approaches operated at free-flow conditions, showing no delay. The average delay was decreased by 98% for 18 Street approach and 99% for Rasheed camp approach. Zero queueing was observed at these approaches.
Simulated results of vehicle delay of the roundabout and the signalized intersection
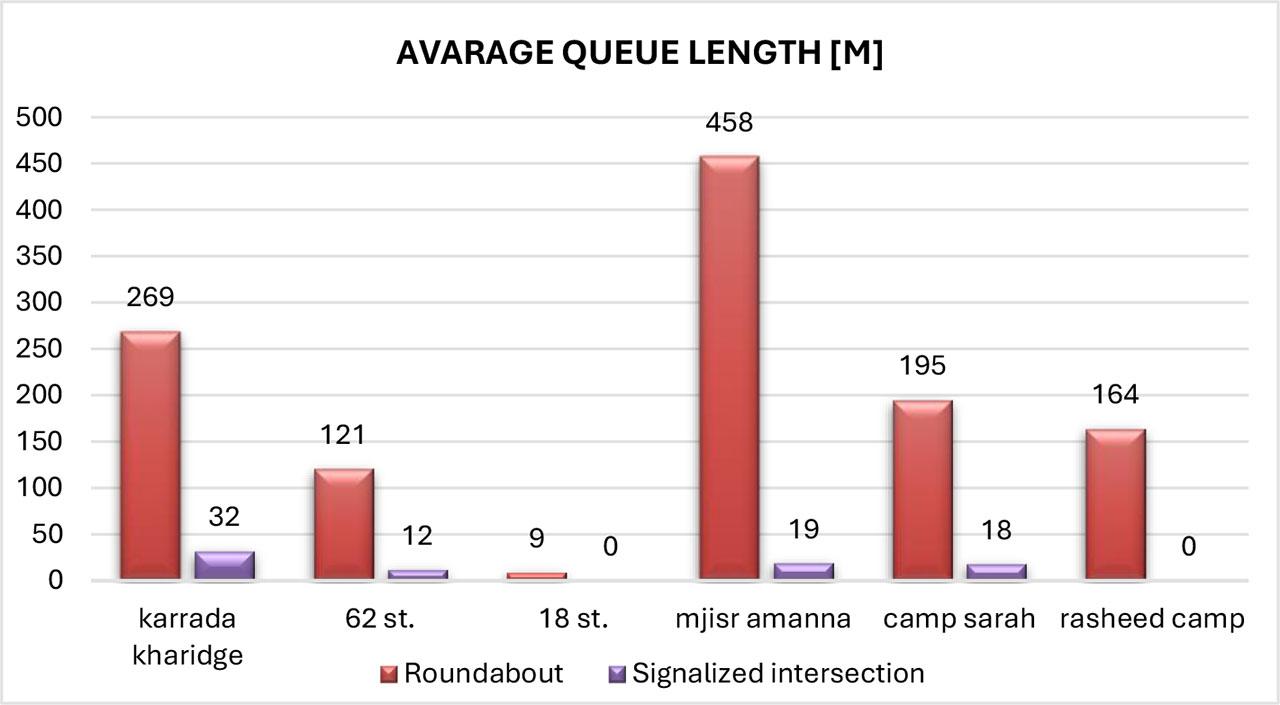
Simulated results of queue length of the roundabout and the signalized intersection
The signalized intersection improved performance by addressing the main operational issues through the regulation of traffic flow using signal timing. The downstream blockage is being migrated. Additionally, it enhances safety by reducing the number of conflict points where high-volume and low-volume traffic streams intersect. enabling vehicles in a lighter flow to cross the intersection efficiently without waiting for an acceptable gap. In general, the efficacy is optimized and the delay is reduced.
After assessing the signalized intersection’s performance, the performance of the signalized intersection over a five-year period will be discussed, assuming a 3% growth rate in traffic volumes, as per the Statistics Division of the Ministry of Planning. A simulation of a signalized intersection model with a growth rate of 3% was made and the evaluation of the signalized intersection after 5 years is illustrated in Figure 12. It is noted that the average delay increased by 91.5%. After comparing the delay value with the HCM limitation, it was observed that the level of service returned to level E after five years.
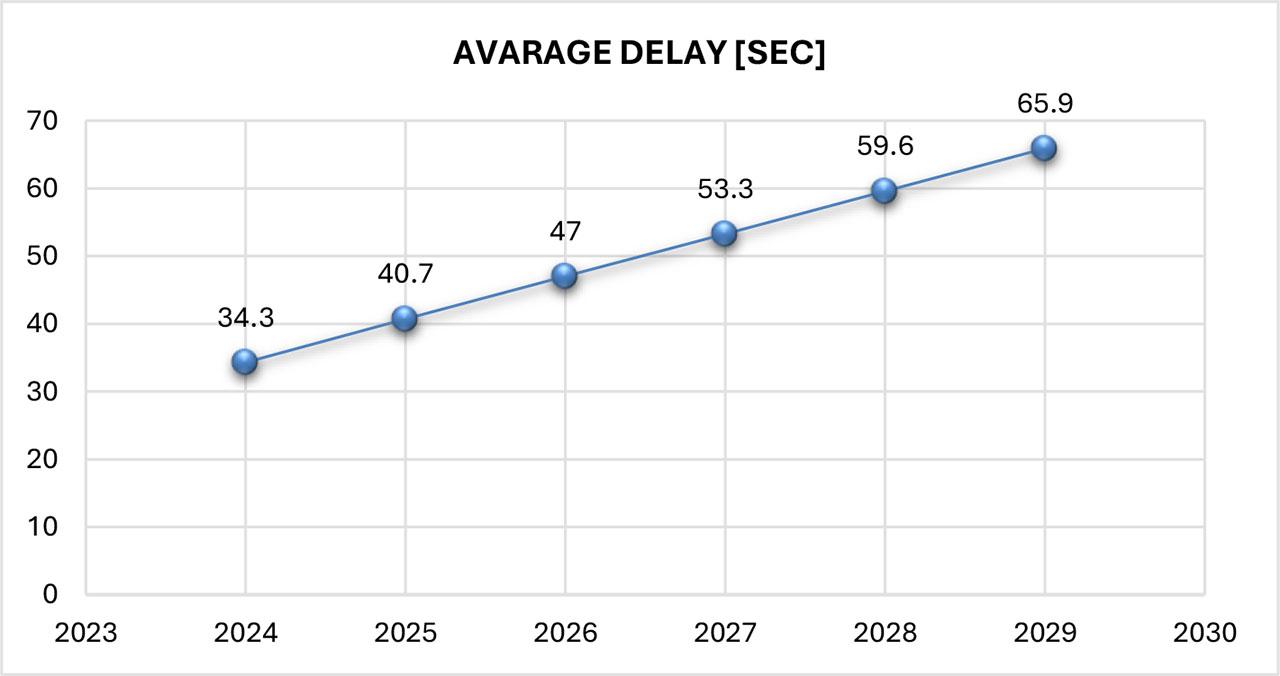
The average delay in the next 5 years in the signalized intersection.
This study evaluated the conversion of a six-leg roundabout into a signalized intersection using the VISSIM program as a simulation tool. The analysis examined the performance of the roundabout with the proposed signalized intersection design, with a special focus on important metrics such as queuing length and delay. The study evaluated the impact of partial signalization on a roundabout's performance and traffic flow before converting it to a fully signalized intersection. It found that while partial signalization improved average delays and queue lengths for some approaches (by 15% to 78%), it increased delays and queues on the Karrada Kharidge and Mijsr Amanna approaches, resulting in an overall service level of grade F. This suggests that partial signal control may not be effective for complex multi-leg roundabouts with uneven traffic distribution. In contrast, a fully signalized intersection significantly reduced average vehicle delays by 74% and improved the service level from F to C. Specific improvements were noted for various approaches, with Karrada Kharidge and Mijsr Amanna experiencing substantial enhancements in operational performance. The signalized intersection also reduced queue lengths and improved safety by regulating traffic flow and minimizing conflict points. Overall, the findings indicate that a comprehensive solution, such as full signalization, is necessary for balanced improvements across all traffic approaches. In the context of investigating the impact of traffic volume growth on the LOS at the intersection under study, it was determined that the signalized intersection will return to level E within a few years, with a maximum of five years. This implies that the intersection will experience congestion, elevated delays, and an unstable flow. Indicating the potential for the intersection to return to level F after five years. It suggests that the issue is more significant than a particular intersection or roundabout, necessitating the development of radical solutions. It is recommended that city governments should concentrate on improving transportation infrastructure in order to successfully deal with the rising issue of traffic congestion during the next five years. This involves supporting public transit projects and coming up with alternative methods to deal with the growing amount of traffic. Strategies should include extending the present traffic infrastructure, building additional roads to manage the growing number of people and private vehicles, and updating the current traffic light system to one that is more flexible and can better handle changes in traffic patterns daily.