

The incorporation of natural rubber into asphalt binders has gained significant attention as a sustainable strategy to enhance pavement performance in recent decades [1], [2], [3]. Rubber-modified asphalt, especially using solid natural rubber such as SIR-20, has been shown to improve elasticity, resistance to permanent deformation, and fatigue performance compared to conventional binders. These improvements are particularly relevant in tropical and sub-tropical climates, where pavement structures are frequently exposed to high temperatures and heavy traffic loads.
In Southeast Asian countries like Malaysia and Thailand, natural rubber has been successfully adopted in asphalt pavement construction, supported by national initiatives and technical research [3]. In Indonesia, which ranks among the world's top natural rubber producers, the potential for adopting rubberised asphalt is substantial. However, large-scale implementation remains limited due to both regulatory inertia and technical incompatibilities, particularly concerning aggregate gradation design. Most existing mix design standards in Indonesia, such as the AC-WC gradation in SNI 2018 Rev.2, are optimised for conventional penetration-grade binders (e.g., PEN 60/70) and do not account for the distinct rheological properties introduced by rubber modification.
Recent studies have highlighted that rubber-modified binders interact differently with aggregates during compaction and service life [2], [3]. It can be demonstrated that conventional dense gradations could lead to excessive voids or poor cohesion when used with highly elastic binders. Similarly, the performance of rubberised asphalt mixtures was heavily influenced by the compatibility between the binder and the aggregate gradation structure. These findings suggest that traditional gradation curves may not adequately accommodate the altered viscoelastic response of rubberised binders, which can affect stiffness, durability, and resistance to rutting or cracking.
Despite this, limited research in Indonesia has systematically evaluated how aggregate gradation influences the performance of asphalt mixtures modified with natural rubber. Most prior works focus on evaluating binder rheology or adjusting asphalt content, with little emphasis on structural compatibility between binder and aggregate matrix. Therefore, a key research gap remains in identifying and validating performance-based gradations specifically tailored for rubberised asphalt under tropical conditions.
Recent studies have promoted the use of waste-based materials such as alkali-activated POFA for soil stabilization, demonstrating significant improvements in strength and deformation properties while reducing environmental impact [1]. This reflects a broader trend of developing sustainable alternatives in pavement material design, including natural rubber-modified asphalt.
To address this gap, this study aims to develop and evaluate asphalt mixtures incorporating 7% natural rubber (SIR-20) by weight of binder, focusing on the effect of different aggregate gradations on mechanical and volumetric performance. Five alternative aggregate gradations (Gradation A to E) were designed and compared against the standard control gradation (Datum) based on Indonesian specifications. The evaluation includes key performance parameters such as Marshall stability, flow, void characteristics (VMA, VIM, VFB), Marshall Quotient, wheel tracking performance, and resilient modulus, using the Marshall mix design method and complementary performance tests [4], [5].
The experimental plan includes the preparation of 300 laboratory specimens across six gradation types and five asphalt content levels (ranging from 5.0% to 7.0%), followed by mechanical testing to assess load-bearing capacity, flexibility, volumetric balance, rutting resistance, and stiffness. Performance results are then used to identify the optimal gradation configuration that is structurally compatible with rubberised binders.
By exploring the interplay between rubber binder modification and aggregate gradation, this research seeks to establish a performance-based gradation framework tailored to enhance the mechanical behaviour and longevity of rubberised asphalt mixtures. The findings are intended to provide practical guidance to pavement engineers, researchers, and policymakers aiming to implement more durable and sustainable flexible pavement technologies in Indonesia and other tropical regions.
The materials used in this study consist of asphalt binder, natural rubber modifier, and aggregates sourced from local quarries. The base binder was a 60/70 penetration grade asphalt, commonly used in Indonesian road construction. To produce rubberised asphalt, the binder was modified by incorporating 7% solid natural rubber (SIR-20) by weight of asphalt. The mixing process was carried out using a high-shear mixer at elevated temperatures (160–170°C), ensuring homogeneity and proper dispersion of the rubber particles, following national standards for rubber-modified asphalt.
Table 1 presents a summary of laboratory test results for modified asphalt binder, evaluated against Indonesian national standards (SNI). Tests were conducted at two laboratories: BBPJN North Sumatra and BPJN West Sumatra.
The 7% natural rubber asphalt (SIR-20) properties.
| No. | Type of test | Modified asphalt specification | Unit | Test results | |||||||
|---|---|---|---|---|---|---|---|---|---|---|---|
| Laboratory of BBPJN North Sumatra | Laboratory of BPJN West Sumatra | ||||||||||
| 06-Sep-21 | 04-Jan-22 | 10-Jan-22 | 15-Jan-22 | 17-Jan-22 | 22-Jan-22 | 27-Jan-22 | 22-Jun-22 | ||||
| 1 | Penetration at 25°C (SNI 2456:2011) | Min. 50 | 0.1 mm | 68.4 | 58 | 59 | 54.8 | 60.4 | 58.2 | 57 | 58.45 |
| 2 | Softening point (SNI 2434:2011) | ≥ 52 | °C | 52 | 53 | 54 | 53 | 53 | 52.5 | 52.5 | 52.5 |
| 3 | Ductility at 25°C, 5 cm/min (SNI 2432:2011) | ≥ 100 | cm | 140 | 151.5 | 153.5 | 154 | 152 | 153 | 149.5 | > 140 |
| 4 | Flash point (COC) (SNI 2433:2011) | ≥ 232 | °C | 319 | - | - | - | - | - | - | 320 |
| 5 | Specific gravity (SNI 2441:2011) | ≥ 1.00 | - | 1.016 | - | - | - | - | - | - | 1.0164 |
| 6 | Weight loss (SNI 2441:1991) | ≤ 1.0 | % | 0.0002 | - | - | - | - | - | - | 0.0856 |
| 7 | Solubility (AASHTO T-44-03) | ≥ 99.0 | % | 99.66 | - | - | |||||
| 8 | Elastic recovery after pull (SNI 2866:2016) | ≥ 30 | % | 34 | 33 | 35 | 32 | 35 | 31 | - | |
As shown in Table 1, key performance indicators include penetration at 25°C, softening point, ductility, flash point, specific gravity, weight loss, solubility, and elastic recovery. All results meet or exceed the minimum specification requirements. Penetration values range from 57 to 68.4 (specification: ≥50), indicating suitable binder consistency. Softening points are consistently above the minimum of 52°C, ensuring resistance to softening at high temperatures. Ductility values exceed 140 cm, demonstrating excellent flexibility. Flash points surpass the 232°C minimum, confirming safe handling during production. Specific gravity is consistent, and weight loss values are well below the 1.0% maximum, indicating good thermal stability [2], [3], [4].
Solubility results are above 99%, reflecting binder purity. Elastic recovery values, between 31% and 35%, indicate good resilience against permanent deformation. Overall, the modified asphalt binder tested in both laboratories demonstrates high quality and compliance with national standards, confirming its suitability for use in road construction and ensuring long-term pavement performance.
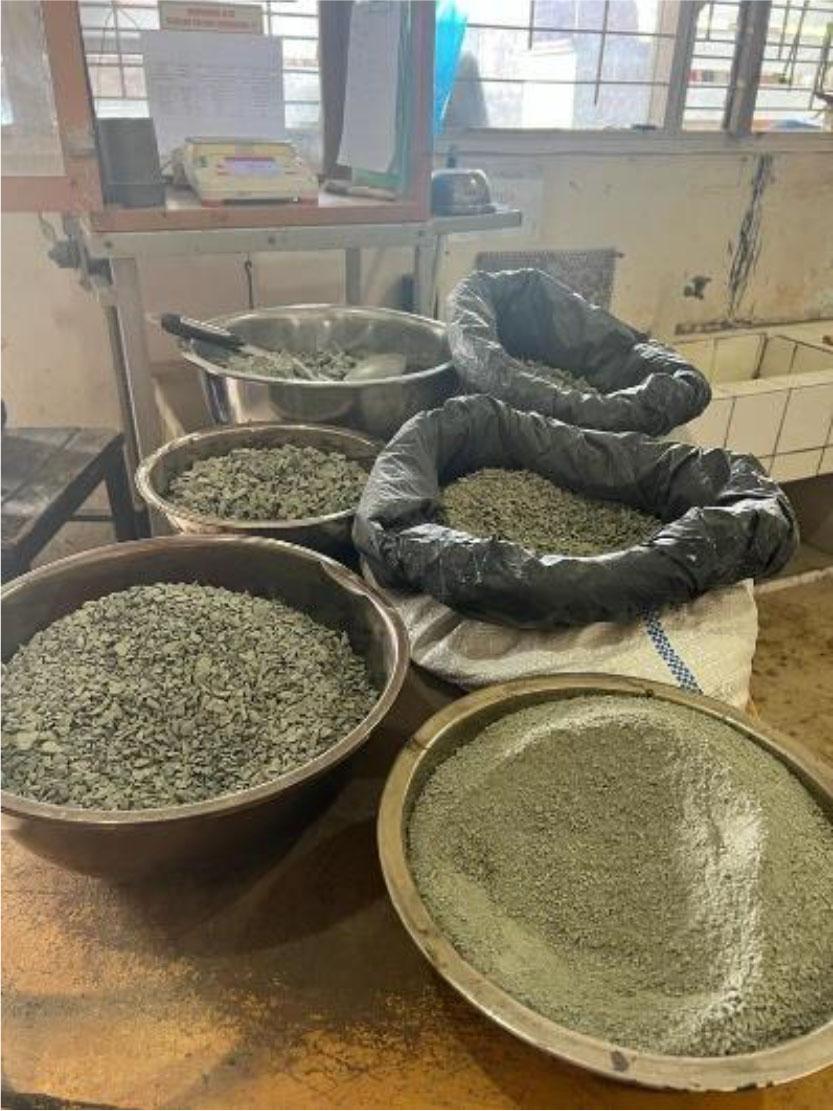
Coarse, medium and fine aggregates.
Aggregates used in the mixture were obtained from the Koto Alam quarry in West Sumatra. As can be seen from Fig. 1, there are three types of aggregates prepared: coarse aggregates, medium aggregates, and fine aggregates (stone dust).
Laboratory characterisation showed that all aggregates met the requirements of the Indonesian Ministry of Public Works Specification 2018 Rev.2, particularly in terms of specific gravity, absorption, and Los Angeles abrasion values as shown in Table 2 [5].
Aggregate properties.
| No. | Properties | Coarse aggregate | Medium aggregate | Fine aggregate | Specification |
|---|---|---|---|---|---|
| 1. | Bulk specific gravity (gr/cc) | 2.682 | 2.659 | 2.583 | ≥ 2.53 |
| 2. | Saturated surface dry specific | 2.718 | 2.697 | 2.647 | ≥ 2.54 |
| 3. | Apparent specific gravity (gr/cc) | 2.78 | 2.764 | 2.759 | ≥ 2.63 |
| 4. | Absorption (%) | 1.315 | 1.425 | 1.459 | ≥ 1.37 |
| 5. | Los Angeles, Abrasion (%) | 13.11 | 13.11 | - | ≥ 30.0 |
Table 2 presents the physical properties of the coarse, medium, and fine aggregates used in the asphalt mixtures. All aggregate types exhibit relatively high specific gravity, indicating dense and durable materials. The absorption values increase with decreasing particle size, suggesting finer aggregates retain more moisture. Apparent specific gravity values are consistently higher than bulk and SSD values, as expected. Notably, coarse and medium aggregates share the same Los Angeles Abrasion value of 13.11%, indicating good resistance to fragmentation under mechanical stress. Overall, the data confirms the aggregates’ suitability for high-performance asphalt mix design in terms of strength and durability.
Table 3 presents the six aggregate gradations and five new trial gradations (A–E) were developed, and one control gradation based on national specifications (Datum). The trial gradations were designed to explore the influence of varying particle size distribution on the performance of rubberised asphalt mixtures. Sieve analysis was conducted to determine the percentage passing of each sieve size, and the gradations were plotted against specification limits to ensure a wide range of structural configurations, as shown in Fig. 2.
Five trial aggregate gradation.
| Sieve No. | Gradation (Datum) | Grad. A | Grad. B | Grad. C | Grad. D | Grad. E | Specification | ||
|---|---|---|---|---|---|---|---|---|---|
| mm | inch | Lower limit | Upper limit | ||||||
| % passing | |||||||||
| 25.40 | 1″ | 100.00 | 100.00 | 100.00 | 100.00 | 100.00 | 100.00 | 100.00 | 100.00 |
| 19.00 | 3/4″ | 100.00 | 100.00 | 100.00 | 100.00 | 100.00 | 100.00 | 100.00 | 100.00 |
| 12.50 | 1/2″ | 92.32 | 90.69 | 89.64 | 88.59 | 87.54 | 86.49 | 90.00 | 100.00 |
| 9.50 | 3/8″ | 86.20 | 83.44 | 81.98 | 80.52 | 79.06 | 77.60 | 77.00 | 90.00 |
| 4.75 | #4 | 62.30 | 57.71 | 56.02 | 54.32 | 52.62 | 50.92 | 53.00 | 69.00 |
| 2.36 | #8 | 35.45 | 32.92 | 31.90 | 30.88 | 29.86 | 28.84 | 33.00 | 53.00 |
| 1.18 | #16 | 22.55 | 21.35 | 20.71 | 20.07 | 19.43 | 18.79 | 21.00 | 40.00 |
| 0.60 | #30 | 16.35 | 15.82 | 15.37 | 14.91 | 14.46 | 14.01 | 14.00 | 30.00 |
| 0.30 | #50 | 12.32 | 12.23 | 11.90 | 11.57 | 11.24 | 10.91 | 9.00 | 22.00 |
| 0.15 | #100 | 9.48 | 9.68 | 9.43 | 9.19 | 8.94 | 8.70 | 6.00 | 15.00 |
| 0.08 | #200 | 7.01 | 7.46 | 7.30 | 7.14 | 6.97 | 6.81 | 4.00 | 9.00 |
All asphalt mixtures were prepared using the Marshall method, following ASTM D6927 procedures. A total of 300 specimens were fabricated with five different asphalt contents (5.0%, 5.5%, 6.0%, 6.5%, and 7%) for each gradation [4]. To assess the performance of rubber-modified asphalt mixtures across varying aggregate gradations and asphalt contents, a series of laboratory tests was systematically conducted.
For the Marshall stability and Flow Test, following ASTM D6927, this test evaluated each specimen's load-bearing capacity (stability) and plastic deformation potential (flow). Stability reflects the mixture's resistance to traffic-induced deformation, while flow indicates its ability to deform without cracking. These parameters are crucial for understanding how rubber modification influences viscoelastic behaviour.
Meanwhile, the volumetric properties for three volumetric parameters were assessed per AASHTO R35 [6]. The Voids in Mineral Aggregate (VMA) is the space within the aggregate structure available to accommodate the binder. Then, the Voids in Mix (VIM) are the air voids within the compacted mix, which are important for durability and moisture resistance. Furthermore, the Voids Filled with Bitumen (VFB): the percentage of VMA filled with binder, influencing flexibility and cracking resistance [7], [8].
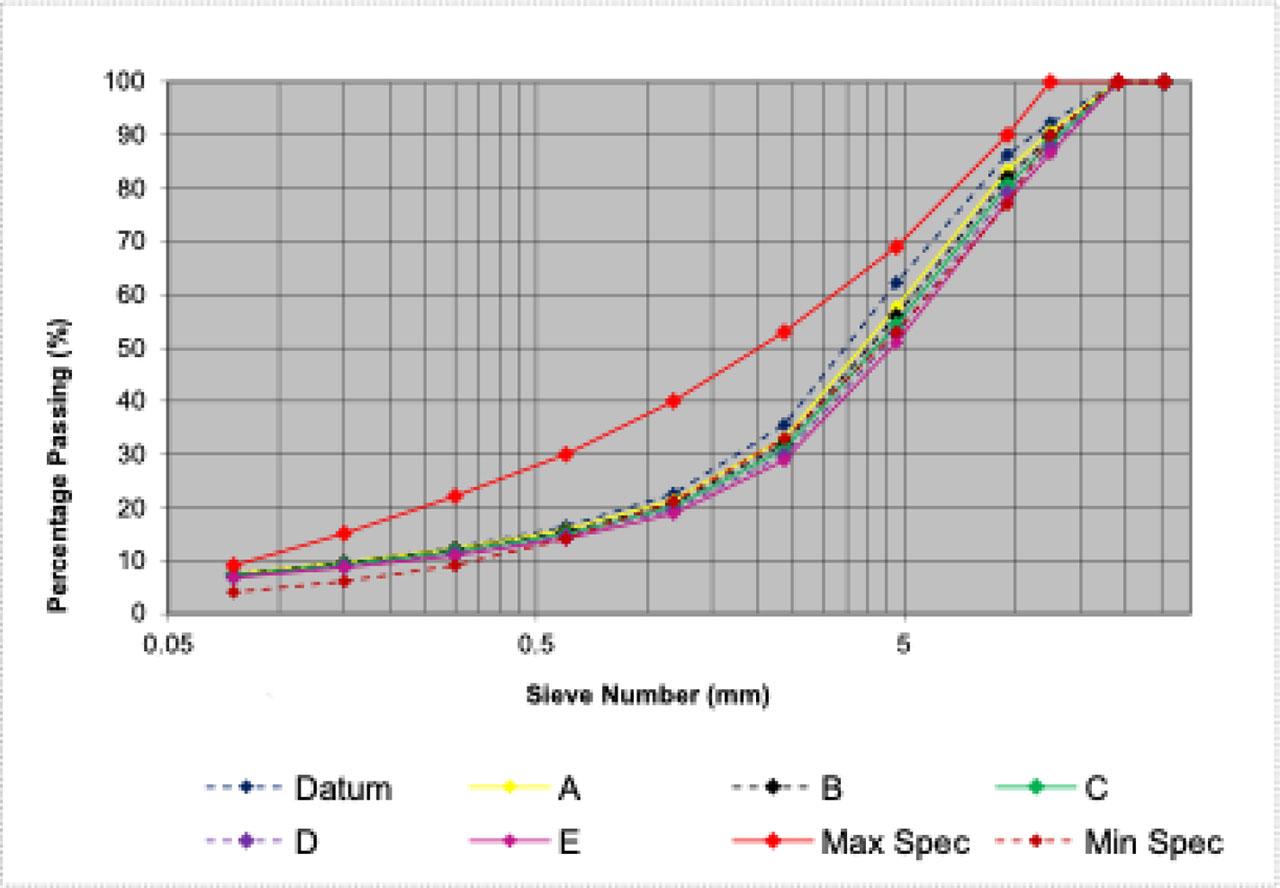
Gradation of AC-WC for all various gradations.
Meanwhile, the Marshall Quotient (MQ) was derived by dividing stability by flow. It represents the stiffness-to-flexibility ratio. A higher MQ indicates a stiffer mix, suitable for resisting rutting, while a lower MQ suggests better flexibility but potentially reduced load support.
Then, the Wheel Tracking Test (WTT), which followed the AASHTO T324 standard, simulated repeated traffic loading under elevated temperatures (45–60 °C) to assess rutting susceptibility. Parameters such as rut depth (Do), deformation slope (DS), and rutting rate (RD) were measured to evaluate long-term deformation resistance, especially under tropical climate conditions [9].
The Resilient Modulus Test (Mr) was determined via indirect tensile testing as per ASTM D4123. It reflects the asphalt's elastic response under load. Rubber inclusion is expected to enhance Mr by improving the binder's elastic recovery properties, thereby boosting the mix's structural performance under traffic stress [10].
All laboratory tests were conducted in certified national highway laboratories under consistent environmental conditions and using calibrated, standardised equipment. This ensured reliability, accuracy, and reproducibility of the data, which are essential for deriving robust engineering conclusions and supporting future field applications. The findings from these laboratory tests are intended to provide a comprehensive understanding of how rubber modification interacts with different aggregate structures and binder contents under simulated service conditions. This data-driven approach helps identify the optimal mix design parameters that balance stiffness, flexibility, and long-term durability. Moreover, the results are expected to support the development of performance-based specifications for rubber-modified asphalt mixtures, particularly in regions with high temperatures and heavy traffic loads. Ultimately, this research contributes to advancing sustainable pavement technologies by integrating recycled materials without compromising structural integrity or performance [11], [12].
Marshall stability testing on pen 60/70 asphalt mixtures was conducted on 125 specimens for gradations A through E, and another 125 specimens for rubberised asphalt. For the datum specimens, 25 specimens were tested for pen 60/70 asphalt and 25 specimens for rubberised asphalt, corresponding to the datum gradation or the gradation according to the 2018 revision 2 specifications.
In total, Marshall stability testing was performed on 300 specimens, varying across five different asphalt content percentages and six different material gradations. The complete results are presented in Table 4 below.
Marshall stability recapitulation for all samples.
| NO. | Asphalt Content [%] | Sample NO. | Datum | Grad. A | Grad. B | Grad. C | Grad. D | Grad. E | ||||||
|---|---|---|---|---|---|---|---|---|---|---|---|---|---|---|
| ASPHALT PEN 60/70 | RUBBER ASPHALT | ASPHALT PEN 60/70 | RUBBER ASPHALT | ASPHALT PEN 60/70 | RUBBER ASPHALT | ASPHALT PEN 60/70 | RUBBER ASPHALT | ASPHALT PEN 60/70 | RUBBER ASPHALT | ASPHALT PEN 60/70 | RUBBER ASPHALT | |||
| 1 | 5 | SP 1 | 1,067.52 | 1,663.30 | 960,77 | 1,168.80 | 1,369.98 | 1,438.53 | 1,565.70 | 1,281.19 | 1,303,67 | 921.56 | 966,51 | 1,101.37 |
| SP 2 | 1,156.48 | 1,550.91 | 1,049.73 | 1,123.85 | 1,405.57 | 1,303.67 | 1,387.78 | 1,011.47 | 1,371.1 | 1,011.47 | 1,101.37 | 1,505.96 | ||
| SP 3 | 1,103.10 | 1,753.21 | 1,120.90 | 1,191.28 | 1,298.82 | 1,168.80 | 1,530.11 | 1,101.37 | 1,258.71 | 1,168.8 | 1,213.76 | 1,078.9 | ||
| SP 4 | 1,123.85 | 1,685.78 | 1,393.57 | 1,146.33 | 1,461.01 | 1,258.71 | 966.51 | 1,078.90 | 1,146.33 | 1,101.37 | 1,258.71 | 1,303.67 | ||
| SP 5 | 1,101.37 | 1,528.44 | 1,438.53 | 1,168.80 | 1,483.48 | 1,213.76 | 1,236.24 | 1,056.42 | 1,146.33 | 1,236.24 | 1,258.71 | 1,146.33 | ||
| Avg | 1,110.46 | 1,636.33 | 1,192.70 | 1,159.81 | 1,403.77 | 1,276.69 | 1,337.27 | 1,105.87 | 1,245.23 | 1,087.89 | 1,159.81 | 1,227.24 | ||
| 2 | 5.5 | SP 1 | 1,174.27 | 1,618.34 | 1,192.06 | 966.51 | 1,209.86 | 1,056.42 | 1,512.32 | 1,056.42 | 1,483.48 | 1,213.76 | 1,168.8 | 1,146.33 |
| SP 2 | 1,281.02 | 1,640.82 | 1,281.02 | 1,146.33 | 1,281.02 | 1,056.42 | 1,405.57 | 1,101.37 | 1,438.53 | 1,146.33 | 1,101.37 | 1,258.71 | ||
| SP 3 | 1,209.86 | 1,573.39 | 1,263.23 | 1,101.37 | 1,263.23 | 1,078.90 | 1,227.65 | 1,056.42 | 1,146.33 | 1,191.28 | 1,056.42 | 1,101.37 | ||
| SP 4 | 1,213.76 | 1,685.78 | 1,348.62 | 1,101.37 | 1,258.71 | 1,146.33 | 1,303.67 | 1,123.85 | 1,371.1 | 1,213.76 | 1,056.42 | 1,258.71 | ||
| SP 5 | 1,258.71 | 1,573.39 | 1,348.62 | 1,258.71 | 1,281.19 | 1,123.85 | 1,213.76 | 1,191.28 | 1,326.14 | 1,326.14 | 1,146.33 | 1,213.76 | ||
| Avg | 1,227.52 | 1,618.34 | 1,286.71 | 1,114.86 | 1,258.80 | 1,092.38 | 1,332.59 | 1,105.87 | 1,353.12 | 1,218.25 | 1,105.87 | 1,195.78 | ||
| 3 | 6 | SP 1 | 1,156.48 | 1,528.44 | 1,209.86 | 1,281.19 | 1,405.57 | 1,483.48 | 1,334.40 | 1,056.42 | 1,281.19 | 1,056.42 | 1,168.8 | 1,123.85 |
| SP 2 | 1,192.06 | 1,483.48 | 1,369.98 | 1,213.76 | 1,192.06 | 1,213.76 | 1,369.98 | 1,056.42 | 1,168.8 | 1,101.37 | 1,191.28 | 1,168.8 | ||
| SP 3 | 1,245.44 | 1,685.78 | 1,316.61 | 1,191.28 | 1,281.02 | 944.03 | 1,334.40 | 1,123.85 | 1,078.9 | 1,056.42 | 1,101.37 | 1,123.85 | ||
| SP 4 | 1,213.76 | 1,640.82 | 1,438.53 | 1,213.76 | 1,303.67 | 1,168.80 | 1,078.90 | 1,101.37 | 1,168.8 | 1,146.33 | 1,281.19 | 1,078.9 | ||
| SP 5 | 1,236.25 | 1,528.44 | 1,393.57 | 1,191.28 | 1,236.24 | 1,078.90 | 1,191.28 | 1,168.80 | 1,326.14 | 1,123.85 | 1,236.24 | 966.51 | ||
| Avg | 1,208.80 | 1,573.39 | 1,345.71 | 1,218.25 | 1,283.71 | 1,177.79 | 1,261.79 | 1,101.37 | 1,204.77 | 1,096.88 | 1,195.78 | 1,092.38 | ||
| 4 | 6.5 | SP 1 | 1,245.44 | 1,640.82 | 1,405.57 | 1,168.80 | 1,103.10 | 1,101.37 | 1,352.19 | 1,056.42 | 1,033.94 | 1,078.9 | 1,258.71 | 1,011.47 |
| SP 2 | 1,192.06 | 1,663.30 | 1,298.82 | 1,258.71 | 1,263.23 | 1,078.90 | 1,227.65 | 1,191.28 | 1,123.85 | 1,101.37 | 1,123.85 | 1,168.8 | ||
| SP 3 | 1,227.65 | 1,595.87 | 1,369.98 | 1,191.28 | 1,174.27 | 1,213.76 | 1,334.40 | 944.03 | 1,146.33 | 1,191.28 | 1,191.28 | 966.51 | ||
| SP 4 | 1,191.28 | 1,685.78 | 1,393.57 | 1,168.80 | 1,258.71 | 1,146.33 | 1,123.85 | 1,146.33 | 1,281.19 | 1,123.85 | 1,303.67 | 921.56 | ||
| SP 5 | 1,236.24 | 1,753.21 | 1,168.80 | 1,213.76 | 1,303.67 | 1,236.24 | 1,213.76 | 1,123.85 | 1,416.05 | 1,213.76 | 1,236.24 | 1,078.9 | ||
| Avg | 1,218.53 | 1,667.79 | 1,327.35 | 1,200.27 | 1,220.60 | 1,155.32 | 1,250.37 | 1,092.38 | 1,200.27 | 1,141.83 | 1,222.75 | 1,029.45 | ||
| 5 | 7 | SP 1 | 1,281.02 | 1,461.01 | 1,352.19 | 1,281.19 | 1,334.40 | 1,123.85 | 1,174.27 | 1,056.42 | 1,393.57 | 1,123.85 | 1,191.28 | 966.51 |
| SP 2 | 1,209.86 | 1,528.44 | 1,227.65 | 1,146.33 | 1,209.86 | 1,191.28 | 1,263.23 | 1,123.85 | 1,326.14 | 1,168.8 | 1,123.85 | 1,033.94 | ||
| SP 3 | 1,263.23 | 1,685.78 | 1,298.82 | 1,213.76 | 1,405.57 | 1,078.90 | 1,334.40 | 1,348.62 | 1,191.28 | 1,146.33 | 1,191.28 | 1,056.42 | ||
| SP 4 | 1,258.71 | 1,550.91 | 1,573.39 | 1,281.19 | 1,416.05 | 1,213.76 | 1,056.42 | 1,213.76 | 1,078.9 | 1,123.85 | 1,056.42 | 1,416.05 | ||
| SP 5 | 1,236.24 | 1,595.87 | 1.550.91 | 1,303.67 | 1,146.33 | 1,191.28 | 1,303.67 | 1,146.33 | 1,281.19 | 1,078.9 | 1,078.9 | 1,123.85 | ||
| Avg | 1,249.81 | 1,564.40 | 1.400.59 | 1,245.23 | 1,302.44 | 1,159.81 | 1,226.40 | 1,177.79 | 1,254.22 | 1,128.35 | 1,128.35 | 1,119.35 | ||
Testing both PEN 60/70 and rubberised asphalt enables comparison between traditional binders and modified binders, highlighting the benefits of rubber modification in improving mixture stability and durability. The datum gradation, based on established specifications, serves as a benchmark to assess the performance improvements achieved by alternative gradations [13], [14].
Based on the results of testing Voids in Mineral Aggregate (VMA), Voids in Mix (VIM), Voids Filled by Bitumen (VFB), and Flow on data from 300 test specimens, in accordance with the asphalt content used for each type of material, the summary of the test data is presented in Table 5.
Volumetric Marshall result (VMA, VIM, VFB, Flow).
| No | Asphalt Content [%] | VMA [%] | VIM [%] | VFB [%] | Flow [mm] | Type of Aggregate Gradation | ||||
|---|---|---|---|---|---|---|---|---|---|---|
| ASPHALT PEN 60/70 | RUBBER ASPHALT | ASPHALT PEN 60/70 | RUBBER ASPHALT | ASPHALT PEN 60/70 | RUBBER ASPHALT | ASPHALT PEN 60/70 | RUBBER ASPHALT | |||
| Specification requirement | ||||||||||
| >15 % | 3 % – 5 % | >65% | 2 mm – 4 mm | |||||||
| 1 | 5% | 16.731 | 16.757 | 6.345 | 7.250 | 62.081 | 56.895 | 3.214 | 4.180 | Datum |
| 17.204 | 16.281 | 6.555 | 6.715 | 61.919 | 58.817 | 2.860 | 3.360 | A | ||
| 15.476 | 16.125 | 4.658 | 6.586 | 69.922 | 59.309 | 3.700 | 3.420 | B | ||
| 15.590 | 16.834 | 3.734 | 7.176 | 76.111 | 57.381 | 3.560 | 4.460 | C | ||
| 15.981 | 16.964 | 4.976 | 7.408 | 68.898 | 56.614 | 3.120 | 3.860 | D | ||
| 15.979 | 17.250 | 4.887 | 7.439 | 69.498 | 57.039 | 3.160 | 4.020 | E | ||
| 2 | 5.5% | 16.272 | 16.519 | 5.330 | 6.493 | 67.252 | 60.706 | 2.730 | 4.480 | Datum |
| 15.991 | 16.365 | 4.685 | 6.316 | 70.710 | 61.766 | 3.160 | 3.120 | A | ||
| 15.446 | 16.726 | 4.118 | 6.765 | 73.337 | 59.623 | 3.660 | 2.680 | B | ||
| 15.369 | 16.651 | 2.972 | 6.479 | 80.834 | 61.190 | 3.540 | 3.340 | C | ||
| 15.141 | 16.093 | 3.517 | 5.942 | 77.484 | 63.162 | 3.240 | 3.600 | D | ||
| 15.904 | 16.115 | 4.299 | 5.673 | 73.017 | 64.859 | 3.200 | 4.000 | E | ||
| 3 | 6.% | 15.963 | 16.662 | 4.474 | 6.157 | 71.973 | 63.096 | 2.930 | 3.700 | Datum |
| 16.253 | 16.274 | 4.477 | 5.714 | 72.482 | 65.112 | 3.520 | 3.940 | A | ||
| 15.628 | 16.875 | 3.817 | 6.436 | 75.607 | 61.917 | 3.600 | 3.580 | B | ||
| 15.894 | 16.944 | 3.060 | 6.312 | 80.778 | 62.807 | 3.500 | 3.660 | C | ||
| 15.800 | 16.335 | 3.758 | 5.715 | 76.482 | 65.073 | 3.640 | 3.300 | D | ||
| 16.336 | 16.704 | 4.284 | 5.836 | 73.884 | 65.556 | 3.800 | 4.320 | E | ||
| 4 | 6.5% | 16.309 | 15.585 | 3.551 | 4.436 | 78.230 | 71.558 | 3.370 | 4.700 | Datum |
| 15.837 | 15.802 | 3.489 | 4.677 | 77.976 | 70.450 | 3.740 | 4.000 | A | ||
| 15.671 | 16.067 | 3.351 | 5.021 | 78.638 | 68.889 | 3.400 | 3.380 | B | ||
| 15.939 | 16.479 | 2.595 | 5.283 | 83.744 | 67.967 | 3.640 | 3.820 | C | ||
| 15.874 | 16.300 | 3.328 | 5.170 | 79.221 | 68.402 | 3.480 | 3.800 | D | ||
| 16.263 | 18.370 | 3.688 | 7.227 | 77.401 | 60.696 | 4.020 | 3.820 | E | ||
| 5 | 7% | 16.495 | 17.176 | 4.059 | 5.732 | 75.396 | 66.624 | 3.726 | 4.220 | Datum |
| 16.141 | 16.622 | 3.320 | 5.097 | 79.437 | 69.377 | 3.900 | 4.400 | A | ||
| 15.953 | 16.141 | 3.157 | 4.594 | 80.226 | 72.136 | 4.440 | 3.200 | B | ||
| 16.223 | 16.829 | 2.402 | 5.174 | 85.201 | 69.440 | 4.560 | 4.420 | C | ||
| 16.239 | 16.346 | 3.230 | 4.713 | 80.142 | 71.220 | 3.800 | 3.860 | D | ||
| 16.809 | 17.883 | 3.801 | 6.172 | 77.454 | 65.983 | 4.140 | 4.020 | E | ||
Gradation B of the rubberised asphalt mixture was selected because its volumetric parameters closely aligned with specification requirements, with only a slight deviation observed in the VIM value (5.021%). This minimal exceedance is within acceptable tolerance and does not undermine the overall performance. Consequently, Gradation B with an asphalt content of 6.5% was chosen for further evaluation. Consequently, Gradation B with an asphalt content of 6.5% was chosen for further evaluation. As shown in Table 4, the stability values for Gradation B, particularly at 6.5% asphalt content, exceeded the minimum standard requirements. Therefore, Gradation B with 6.5% asphalt content was selected for the 7% natural rubber-modified asphalt binder. In other words, this asphalt mixture demonstrated superior load-bearing capacity without exhibiting permanent deformation, indicating its suitability for high-traffic or heavy-load pavement applications.
Meanwhile, the Marshall Flow represents the mixture’s flexibility or ductility—specifically, its capacity for plastic deformation prior to failure. The rubberised asphalt with Gradation B exhibited a flow value of 3.38 mm, which falls within the optimal range of 2–4 mm and is lower than that of the conventional 60/70 penetration asphalt. This indicates a well-balanced combination of stiffness and flexibility, enabling the pavement to accommodate traffic-induced stresses and thermal variations without cracking or undergoing excessive deformation. Furthermore, the favourable volumetric parameters further reinforce the structural stability of the mixture.
Voids in Mineral Aggregate (VMA): Gradation B has an adequate VMA (~16.067%), indicating sufficient space for asphalt binder to coat aggregates and provide durability without compromising strength.
Voids in Mix (VIM) around 5.021%, suggesting good compaction and fewer air voids, which reduces permeability and enhances durability. Voids Filled by Bitumen (VFB): With a VFB of approximately 68.89%, Gradation B has an optimal binder content filling the voids, ensuring cohesion and flexibility.
Hence, many of Gradation B’s rubber asphalt Marshall parameters meet or exceed the requirements set by relevant specifications (such as Bina Marga 2018 rev 2), confirming that this mix design is not only strong but also compliant with engineering standards.
It can be concluded that Gradation B has:
Highest stability: Gradation B’s high Marshall stability indicates superior load-carrying capacity and resistance to permanent deformation.
Optimal Flow: Its flow values show the mix is neither too brittle nor too soft, balancing durability and flexibility.
Volumetric Balance: The combination of VMA, VIM, and VFB values supports the mechanical performance, ensuring the binder effectively coats aggregates and the mix is well compacted.
Specification Compliance: Many parameters fall within specification limits, validating Gradation B as an optimal mix design.
This comprehensive evaluation explains why Gradation B is considered the best-performing mixture in the study, combining mechanical strength, durability, and compliance with standards to ensure long-lasting pavement performance.
While Gradation B at 6.5% asphalt content demonstrated the most balanced mechanical performance, it is important to compare it with the other gradations evaluated in this study. Gradation A showed relatively high Marshall stability; however, it exhibited lower VFB values and marginally excessive flow, indicating reduced cohesion and flexibility control. Gradation C had good stiffness but showed elevated VIM and flow values, which could compromise durability due to insufficient compaction. Gradations D and E were less consistent, with several samples demonstrating lower Marshall stability and higher deformation in wheel tracking tests. The control gradation (Datum), although compliant with national specifications, showed inferior rutting resistance and lower Marshall Quotient values, reflecting limited stiffness–flexibility balance.
In addition, Table 4 reveals that, under Gradation B at 5.0% asphalt content, several PEN 60/70 specimens (SP-2 to SP-5) demonstrated higher Marshall stability than the corresponding rubber-modified asphalt specimens. This observation is not a data entry error but rather reflects the binder's sensitivity to asphalt content. At lower asphalt content (5.0%), the rubber-modified binder may not have been sufficient to ensure full aggregate coating or proper dispersion, leading to underperformance. However, as asphalt content increases (notably at 6.5%), the rubberised mixture outperforms PEN 60/70 in stability, flow, and deformation resistance, reaffirming the importance of optimal binder content in rubber asphalt design.
Subsequently, for Gradation B, further evaluations were conducted to determine its resilient modulus and deformation resistance through the Wheel Tracking Test and Indirect Tensile Strength (ITS) test.
Table 6 presents the rutting performance average from three sample tests of rubber-modified asphalt mixtures as well as the datum gradation. Wheel tracking performance is based on three key parameters: rut depth (Do), deformation speed (DS), and rutting rate (RD). Rut depth (Do) quantifies the permanent deformation under repeated loading, while DS represents the number of passes per millimetre of deformation, where higher values indicate greater resistance. RD, the rutting rate, reflects the rate of deformation over time, with lower values signifying improved rutting resistance.
Wheel tracking test results of rubberised asphalt mixtures.
| Gradation | Asphalt content [%] | Do [mm] | DS [passes/mm] | RD [mm/min] |
|---|---|---|---|---|
| Datum | 6.5 | 2.71 | 2,803 | 0.0151 |
| Gradation B | 6.5 | 1.94 | 2,975 | 0.0141 |
Resilient Modulus (MR) values for two types of aggregate gradations.
| No. | Aggregate proportion type | Sample (SP) No | Resilient modulus [MPa] | |||||
|---|---|---|---|---|---|---|---|---|
| Pulse-1 | Pulse-2 | Pulse-3 | Pulse-4 | Pulse-5 | Average | |||
| 1. | Gradation specification (Datum), content 6.5% | SP-1 | 4,217 | 3,893 | 3,814 | 3,829 | 3,702 | 3,891 |
| SP-2 | 3,755 | 3,720 | 3,669 | 3,676 | 3,541 | 3,672 | ||
| SP-3 | 2,974 | 2,736 | 2,728 | 2,746 | 2,653 | 2,767 | ||
| SP-4 | 3,167 | 3,130 | 3,025 | 3,095 | 2,991 | 3,082 | ||
| SP-5 | 3,617 | 3,444 | 3,362 | 3,281 | 3,381 | 3,417 | ||
| 2. | Gradation B, asphalt content 6.5% | SP-1 | 2,708 | 2,683 | 2,596 | 2,547 | 2,540 | 2,615 |
| SP-2 | 2,283 | 2,197 | 2,154 | 2,138 | 2,120 | 2,178 | ||
| SP-3 | 2,798 | 2,749 | 2,623 | 2,613 | 2,591 | 2,675 | ||
| SP-4 | 2,332 | 2,252 | 2,191 | 2,157 | 2,143 | 2,215 | ||
| SP-5 | 2,627 | 2,483 | 2,420 | 2,410 | 2,408 | 2,470 | ||
| 3. | 2017 MDP requirement | 1,100 | ||||||
The wheel Tracking Test revealed that Gradation B achieved the lowest deformation (Do = 1.94 mm) and highest tracking resistance (DS = 2,975 passes/mm). These results suggest that this gradation can effectively withstand heavy repeated loads in hot climates.
Table 8 presents the resilient modulus (MR) values for two types of aggregate gradations—Gradation Specification and Gradation B—each with an asphalt content of 6.5%. Five specimens were tested for each gradation, with five repeated load applications (Pulse-1 to Pulse-5) per specimen. The results are benchmarked against the 2017 MDP minimum requirement of 1.100 MPa.
Summary of key performance metrics for optimal mix (Gradation B, 6.5% rubber asphalt).
| Parameter | Value | Standard Criteria | Performance Interpretation |
|---|---|---|---|
| Marshall stability (kg) | 1,155 | >800 | High strength |
| Flow (mm) | 3.38 | 2.0 – 4.0 | Flexible, within limits |
| Marshall quotient (kg/mm) | 341.81 | >250 | Excellent stiffness–flexibility ratio |
| Wheel tracking – Do (mm) | 1.94 | <4.0 | Outstanding rutting resistance |
| Wheel tracking – DS (passes/mm) | 2,975 | >2,000 | High deformation strength |
| Resilient Modulus (Mr, MPa) | >2,600 | >1,100 (MDP 2017) | Sufficient structural stiffness |
The average resilient modulus for the Gradation Specification group is 3,366 MPa, with individual specimen averages ranging from 2,767 MPa to 3,891 MPa. The Gradation B group exhibits a lower average resilient modulus of 2,447 MPa, with specimen averages between 2,178 MPa and 2,615 MPa. All specimens from both gradation types substantially exceed the 2017 MDP minimum requirement of 1,100 MPa, indicating satisfactory elastic recovery characteristics under repeated loading conditions.
Table 7 compares the resilient modulus values of two aggregate gradations (with 6.5% asphalt content) against the minimum requirement. All tested values exceed the minimum standard.
Based on comprehensive laboratory testing, including Marshall stability, flow, volumetric analysis, rutting resistance, and resilient modulus. Gradation B at 6.5% rubber asphalt content emerged as the optimal mix configuration for rubberised asphalt mixtures using 7% natural rubber (SIR-20).
This combination demonstrates an excellent balance across all performance criteria:
Marshall Stability reached 1,155 kg, indicating high resistance to deformation under load and satisfying the minimum standard of 800 kg.
Flow was maintained at approximately 3.38 mm, within the specification limits of 2–4 mm, ensuring sufficient flexibility.
Marshall Quotient (MQ) surpassed 341.81 kg/mm (Stability/flow), signifying an ideal ratio of strength to deformation, which is crucial for mixtures expected to perform under repeated traffic loads.
Wheel tracking test results showed exceptional rutting resistance, with a deformation depth (Do) of only 1.94 mm and a high deformation strength (DS) of 2,975 passes/mm, surpassing conventional thresholds for heavy-duty pavements.
Resilient Modulus (Mr) values reached up to 2,675 MPa, with two specimens exceeding 2,600 MPa and all values surpassing the minimum standard of 1,100 MPa, confirming the mix's ability to recover from dynamic loading and retain structural integrity over time.
Table 8 is the summary of key performance metrics for optimal mix (Gradation B, 6.5% rubber Asphalt). This performance profile positions Gradation B (6.5% AC) as highly suitable for flexible pavement systems exposed to heavy axle loads and high ambient temperatures—conditions common in tropical and sub-tropical regions. Furthermore, this mix aligns well with performance-based mix design principles, where durability, load-bearing capacity, and deformation resistance are prioritised in harmony.
This optimal gradation is a result of not only binder modification but also precise aggregate structure design. Its capacity to mitigate both rutting and cracking risks underscores the importance of holistic mix optimisation, particularly when incorporating sustainable modifiers like natural rubber. The findings from this study support broader implementation of rubberised asphalt technologies in national pavement specifications.
This study evaluated the performance of hot mix asphalt modified with 7% natural rubber (SIR-20), using five alternative aggregate gradations (A–E) and a control (Datum). The objective was to determine an optimal gradation that provides superior mechanical and volumetric performance suitable for heavy traffic and tropical climate conditions.
Among the evaluated mixtures, Gradation B at 6.5% rubber asphalt content (with SIR-20 binder) delivered the most balanced and consistent results:
Marshall Stability reached 1,155 kg, indicating strong load-bearing capacity and exceeding the minimum requirement of 800 kg.
Flow value was 3.38 mm, within the optimal range of 2–4 mm, ensuring adequate flexibility.
Marshall Quotient (MQ) was 341.81 kg/mm, reflecting a desirable stiffness–flexibility balance.
Voids in Mineral Aggregate (VMA) measured 16.07%, exceeding the 15% threshold and ensuring sufficient binder accommodation.
Voids in Mix (VIM) was slightly above the upper limit (5.021%), but within acceptable tolerance and compensated by other parameters.
Voids Filled with Bitumen (VFB) reached 68.89%, indicating effective binder distribution and mix cohesion.
Rutting resistance was excellent, with a deformation depth (Do) of 1.94 mm and deformation strength (DS) of 2,975 passes/mm.
Resilient Modulus (Mr) reached values up to 2,675 MPa; although only two specimens exceeded 2,600 MPa, all values surpassed the required minimum of 1,100 MPa.
These results validate that both binder modification and aggregate gradation plays a vital role in determining the performance of asphalt mixtures. Previous research has shown that finer sand gradation leads to higher compressive strength in foam mortar, highlighting the importance of particle size distribution in achieving improved mechanical properties [15]. Gradation B at 6.5% rubber asphalt content is recommended as the optimal mix, offering a reliable balance of strength, durability, and compliance with national specifications.
In terms of practical application, the asphalt mixture incorporating 7% natural rubber-modified binder (SIR-20) is especially well suited for flexible pavement systems in urban roads, interurban corridors, and toll highways exposed to high traffic volumes and elevated temperatures. It is also applicable for pavement rehabilitation projects that require improved fatigue performance and resistance to rutting. Moreover, this mixture aligns with sustainable infrastructure initiatives by promoting the use of locally sourced natural rubber, offering both environmental and economic value in tropical regions.
Moreover, this study did not include fatigue testing or cost analysis. Future research is recommended to incorporate these aspects and conduct large-scale field trials to further assess the long-term performance and economic viability of rubber-modified asphalt mixtures in tropical environments.