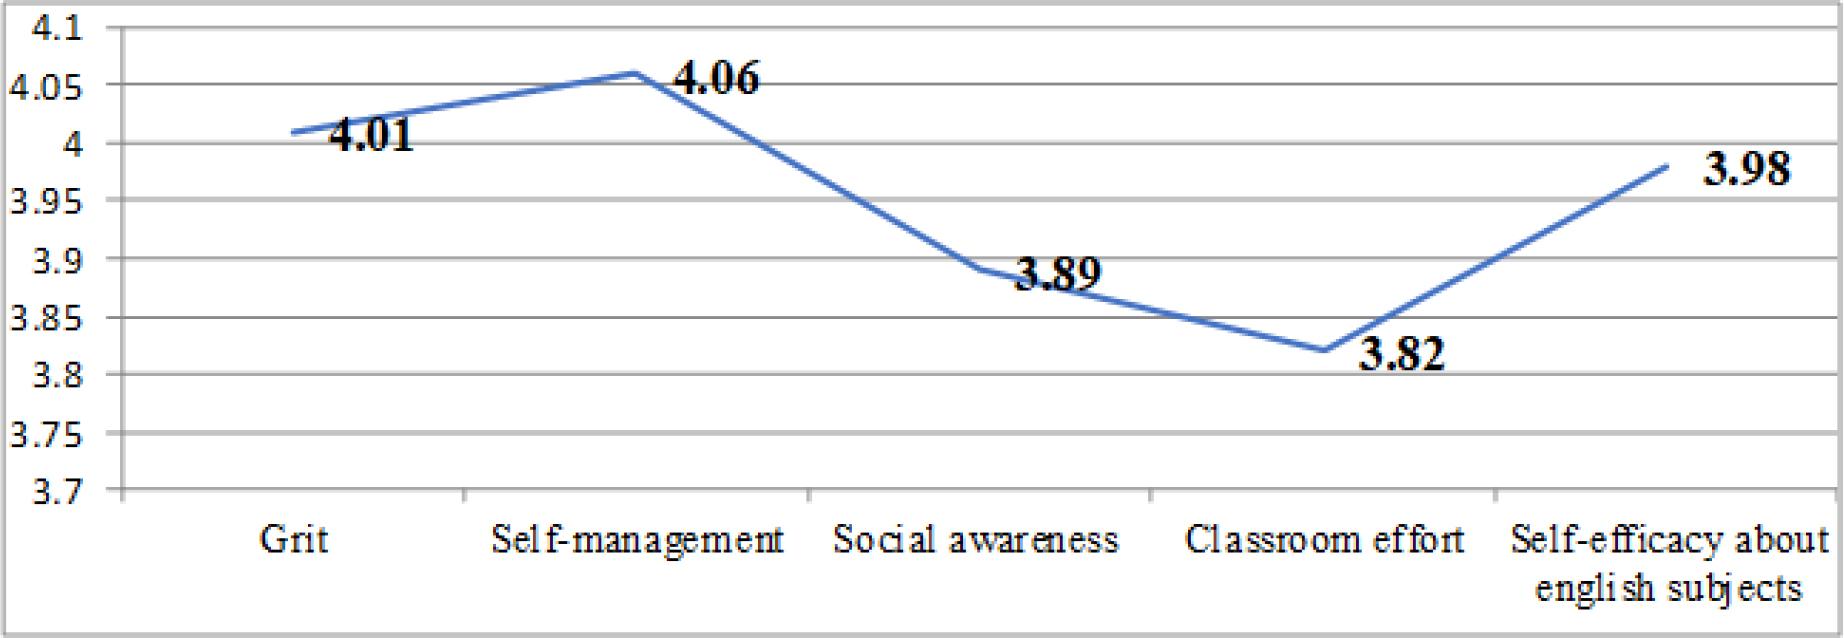
Figure no. 1:

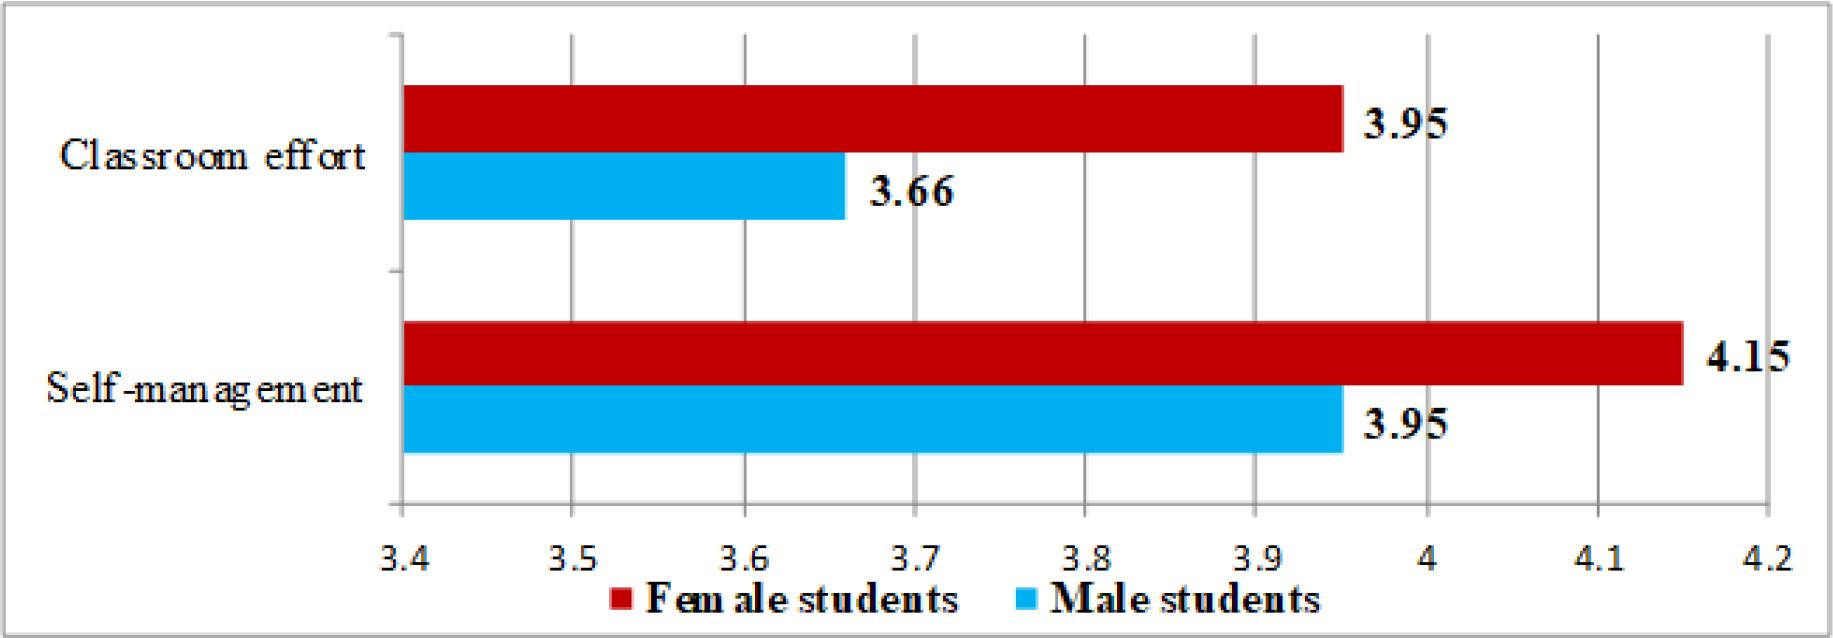
Figure no. 2:

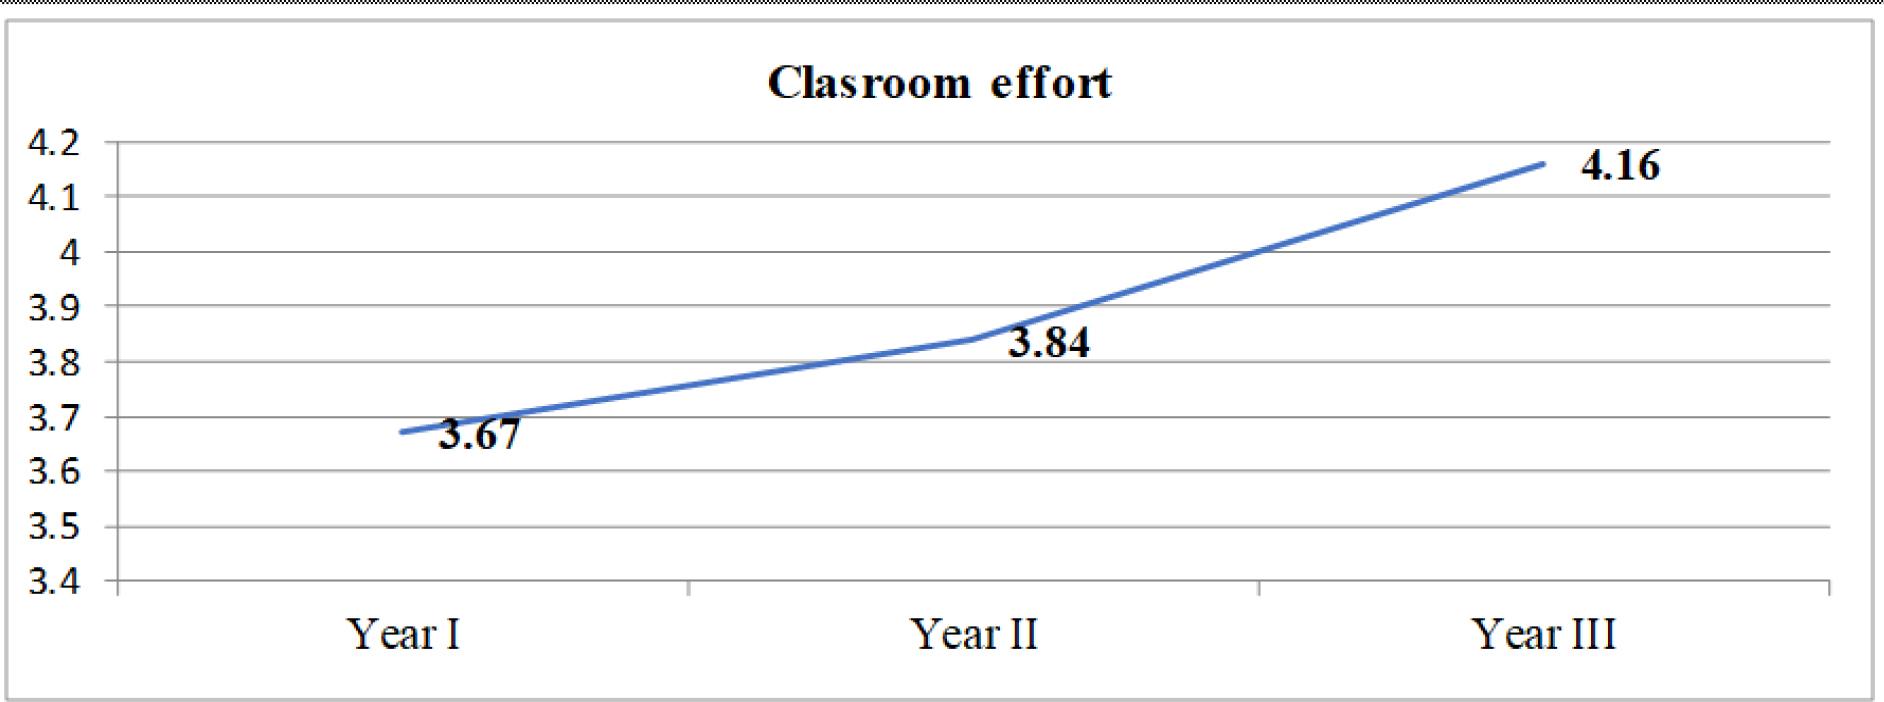
Figure no. 3:

Correlation matrix between self-efficacy about specific subjects, social awareness and grit
| Social awareness | Grit | ||
|---|---|---|---|
| Self-efficacy about English subjects | Pearson Correlation | .406** | .467** |
| Sig. (2-tailed) | .000 | .000 | |
| N | 113 | 113 | |
Correlation matrix between classroom effort, gender, year of study, self-management and grit
| Gender | Year of study | Self - management | Social awareness | Grit | ||
|---|---|---|---|---|---|---|
| Classroom effort | Pearson Correlation | .205* | .246** | .474** | .507** | .421** |
| Sig. (2-tailed) | .029 | .009 | .000 | .000 | .000 | |
| N | 113 | 113 | 113 | 113 | 113 | |
Hierarchical regression analysis predicting the classroom effort of the sampled students
| Variables | Classroom effort | |||
|---|---|---|---|---|
| R2 | Δ R2 | B | p | |
| .406** | .406** | |||
| Gender | 0.161 | p = 0.033 | ||
| Year of study | 0.237 | p = 0.002 | ||
| Social awareness | 0.404 | p < 0.001 | ||
| Grit | 0.259 | p = 0.002 | ||
Hierarchical regression analysis predicting the level of self-efficacy about specific subjects of the sampled students
| Variables | Self-efficacy about English subjects | |||
|---|---|---|---|---|
| R2 | Δ R2 | B | p | |
| .280** | .280** | |||
| Social awareness | 0.269 | p = 0.003 | ||
| Grit | 0.366 | p < 0.001 | ||
