
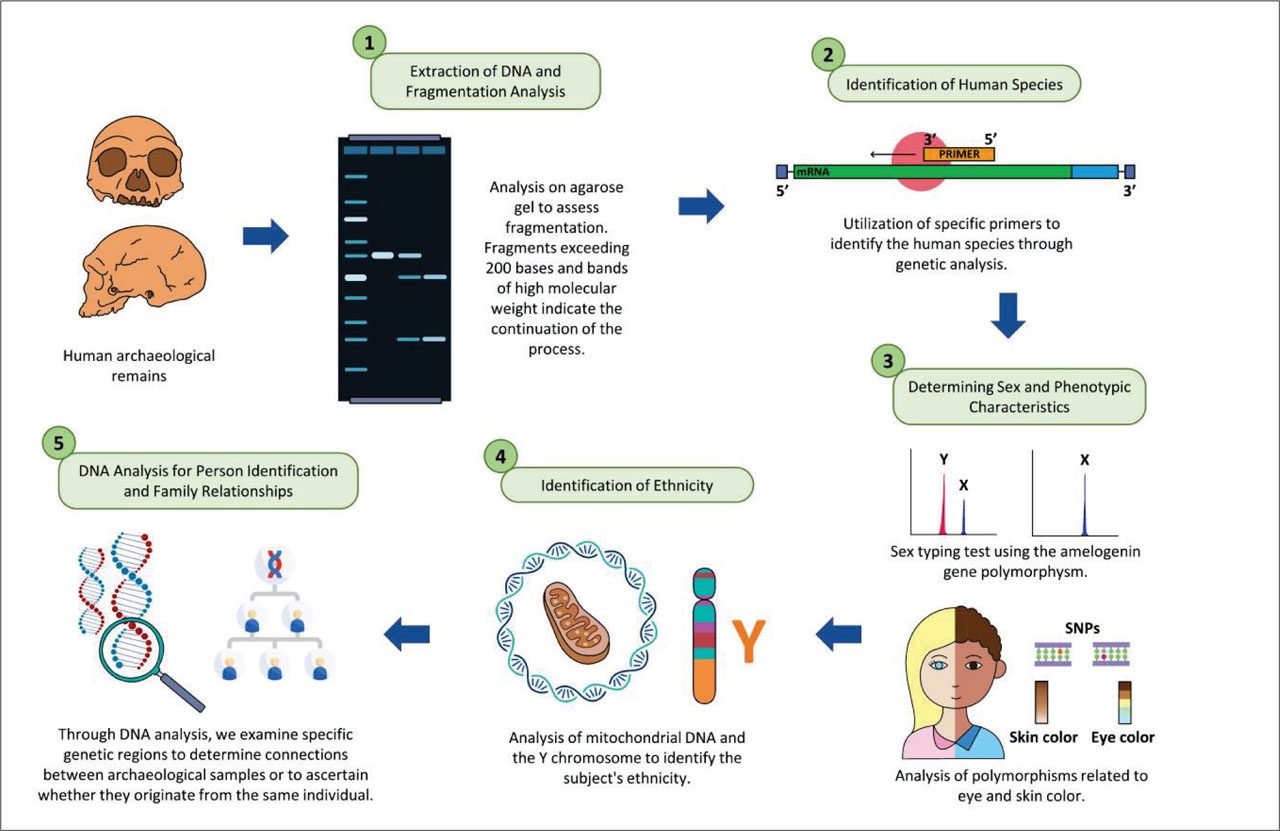
Figure 1.
Overview of the protocol workflow.
Table 1.
Setup of the protocol analysis summarized in various steps.
| Analysis Step | Target | Primer Name | Primer Sequence (5′-3′) | Information Provided | References |
|---|---|---|---|---|---|
| DNA Extraction Sample Preparation | |||||
| Bone surface cleaning | N/A | N/A | N/A | UV irradiation; physical removal of outer layers to reduce contamination | 12,27, 28, 29 |
| Bone powder preparation | N/A | N/A | N/A | Grinding of cleaned bone samples | 12,27,30 |
| Demineralization | N/A | N/A | EDTA 0.5M pH 8.0 | Decalcification of bone matrix; releases DNA from hydroxyapatite | 12,30,31 |
| Protein digestion | N/A | N/A | Proteinase K (20 mg/mL) + 10% SDS | Cell lysis; protein degradation | 12,27,31 |
| DNA purification | N/A | N/A | QIAquick PCR Purification Kit (silica-based) | Removes PCR inhibitors; concentrates DNA | 12,27,30 |
| Data Integration/Interpretation | |||||
| PCR product purification | N/A | N/A | Gene Matrix PCR/DNA Clean-Up Kit | Removes primers and dNTPs before sequencing | 21 |
| Sequencing | N/A | N/A | Sanger sequencing (≥144 bp); Cloning + sequencing (144 bp) | Determines nucleotide sequence for genotyping | 21,32 |
| Authentication | N/A | N/A | N/A | Reproducibility testing; inverse fragment size/success relationship; phylogenetic coherence; negative controls | 33,34 |
| Haplogroup assignment | mtDNA | N/A | PhyloTree Build 17 | Assigns maternal haplogroups based on HVR sequences | 35 |
| Haplogroup assignment | Y-chromosome | N/A | YFull tree | Assigns paternal haplogroups based on Y-SNPs | 1,36,37 |
| Phenotype prediction | Pigmentation SNPs | N/A | HIrisPlex/HIrisPlex-S systems | Predicts eye, hair, and skin color from genotype data | 30 |
| Population analysis | Combined data | N/A | N/A | Integrates all genetic data to reconstruct individual profiles and population history across 2500 years of Italian demographic changes | 6,36,38 |
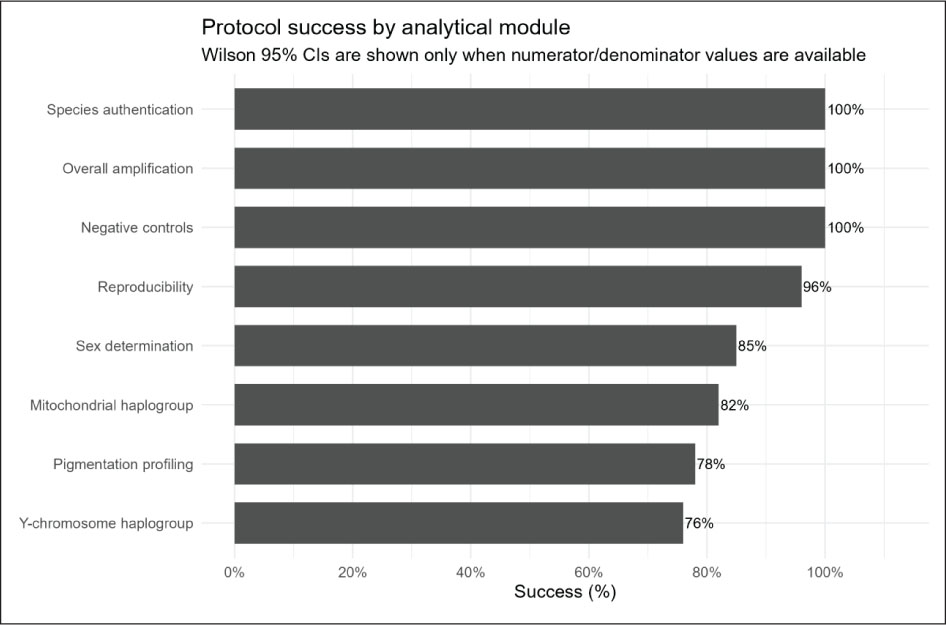
Figure 2.
Amplification success and analytical output rates presented by amplicon module.
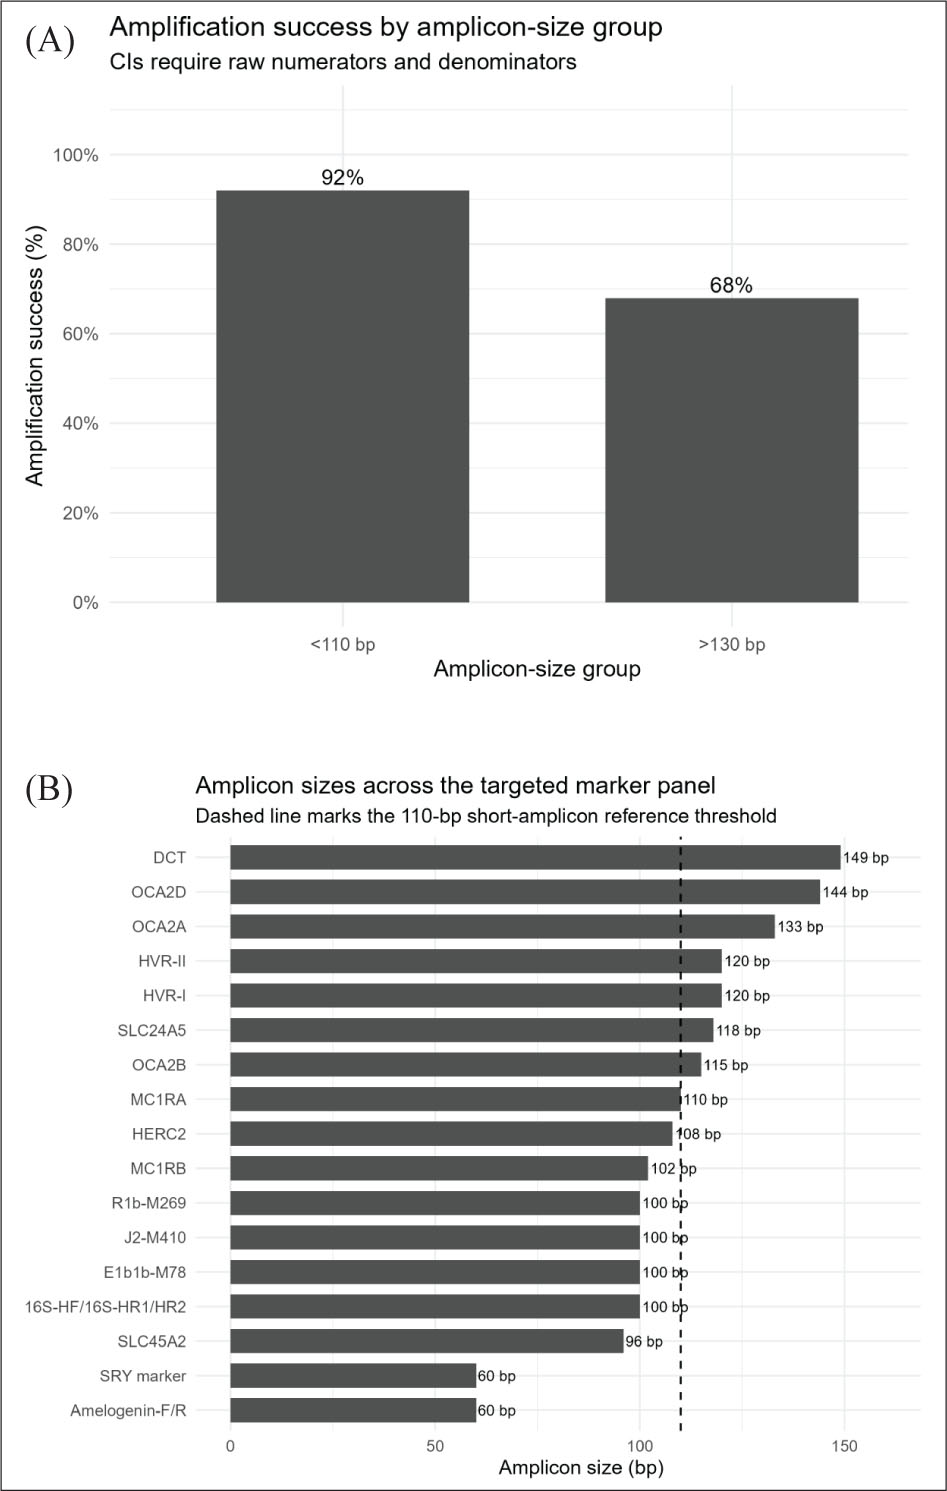
Figure 3.
Marker or amplicon size panels representing (A) amplicon success percentage by amplicon-size groups and (B) amplicon sizes across the targeted marker panels.
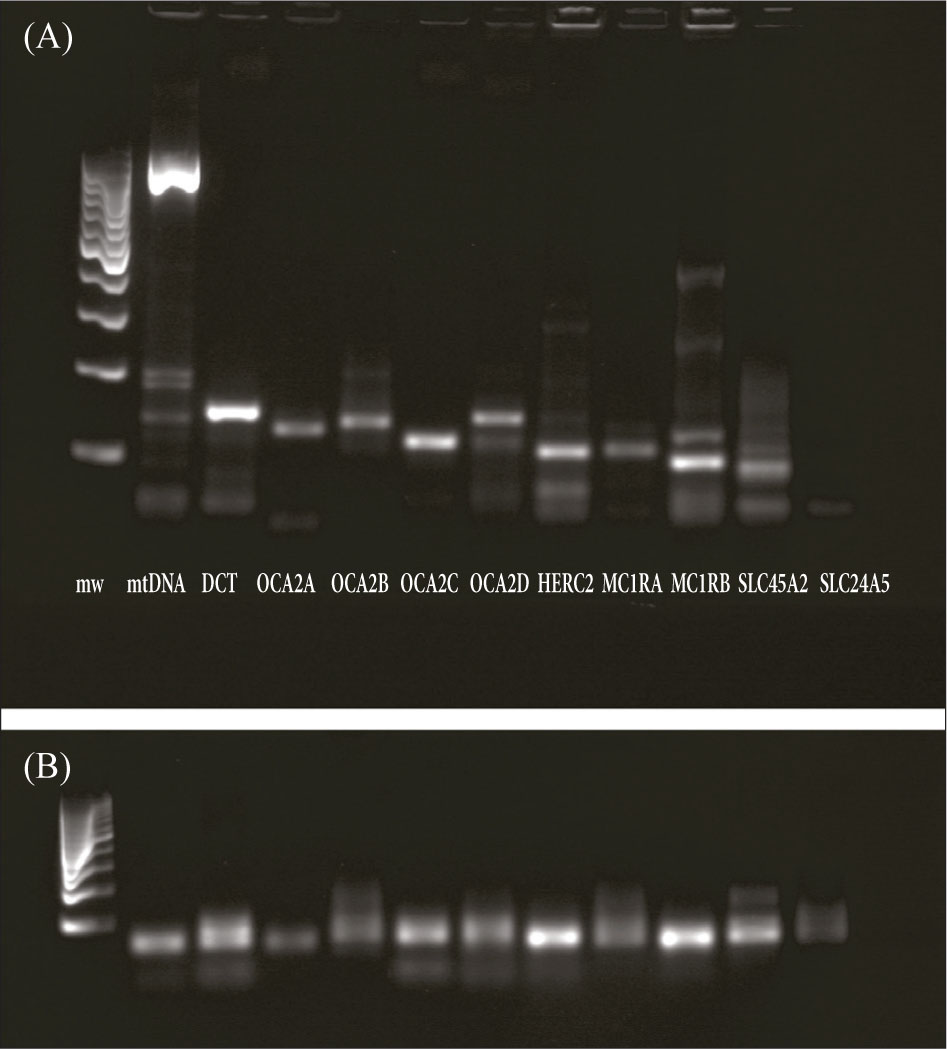
Figure 4.
Representative PCR gel electrophoresis showing amplification of (A) short pigmentation /marker targets and (B) Corresponding no-template negative-control reactions assessed for non-specific amplification or contamination.