
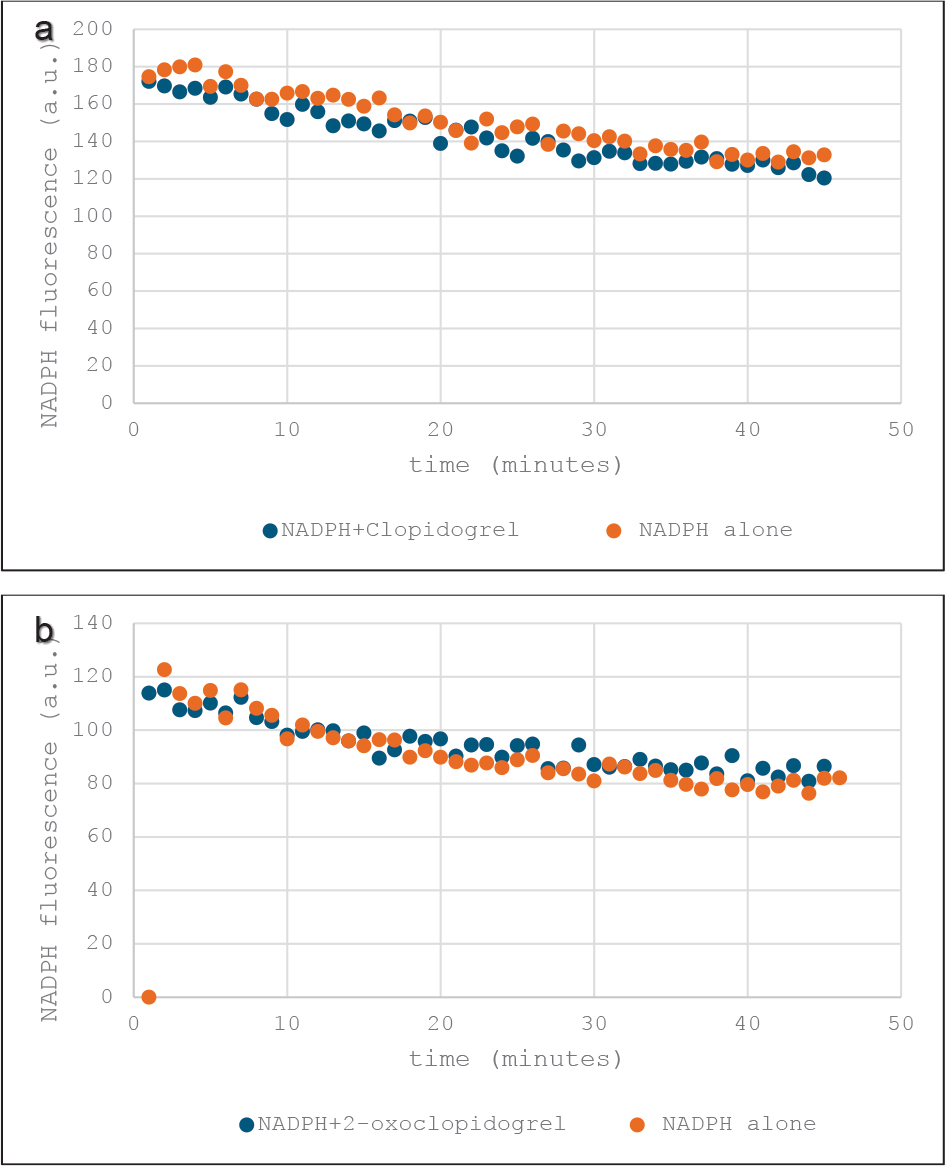
Figure 1.
Evaluation of AKR1D1 substrate specificity using NADPH fluorescence assays for (a) clopidogrel (50 μM) and (b)2-oxoclopidogrel (50 μM). Changes in NADPH fluorescence over time were measured in the presence (blue) and absence (orange) of the substrate candidates.
No significant differences were observed (p > 0.05).
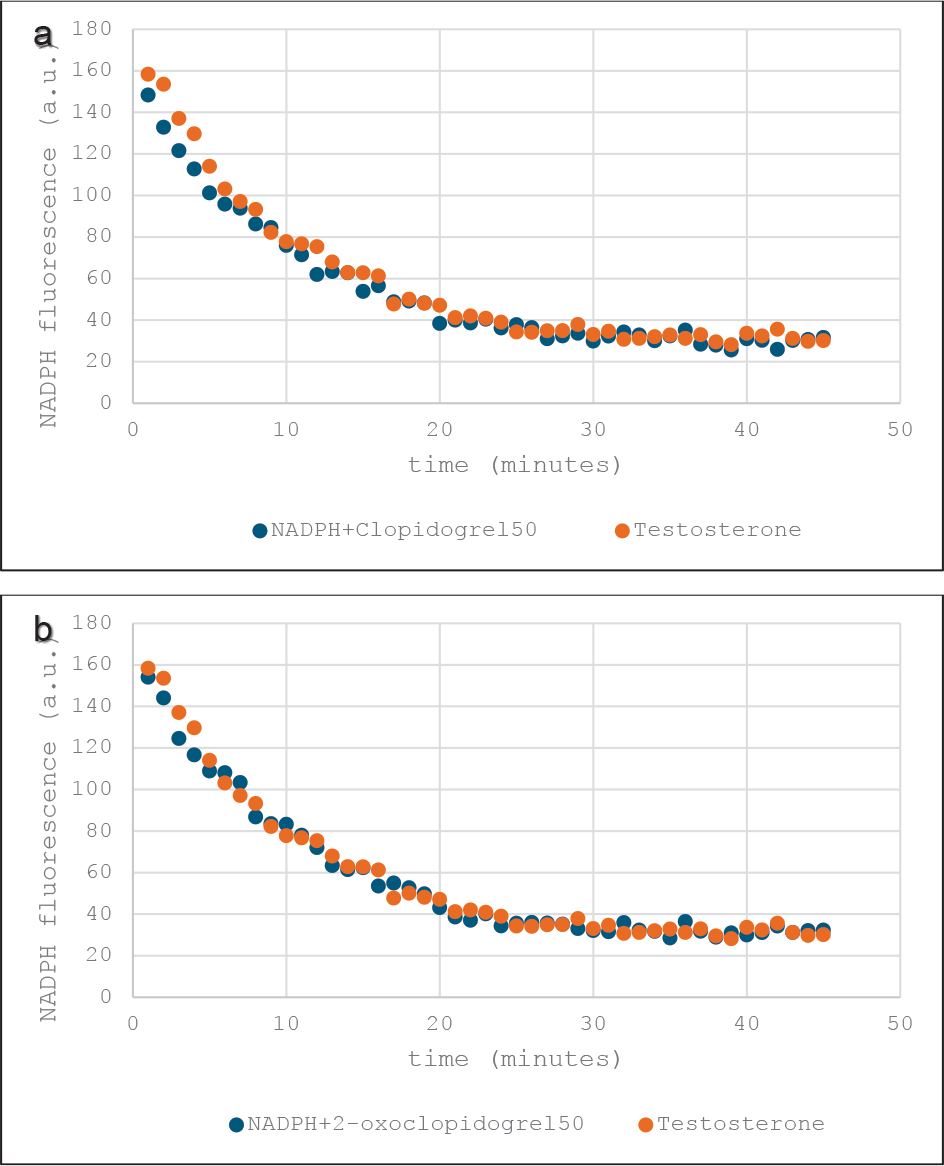
Figure 2.
Evaluation of the inhibitory activity of (a) clopidogrel (50 μM) and (b) 2-oxoclopidogrel (50 μM) on AKR1D1. NADPH fluorescence was measured in the presence of the candidate inhibitor and testosterone (blue) and compared to the response to testosterone alone (orange). No significant differences were observed (p > 0.05).
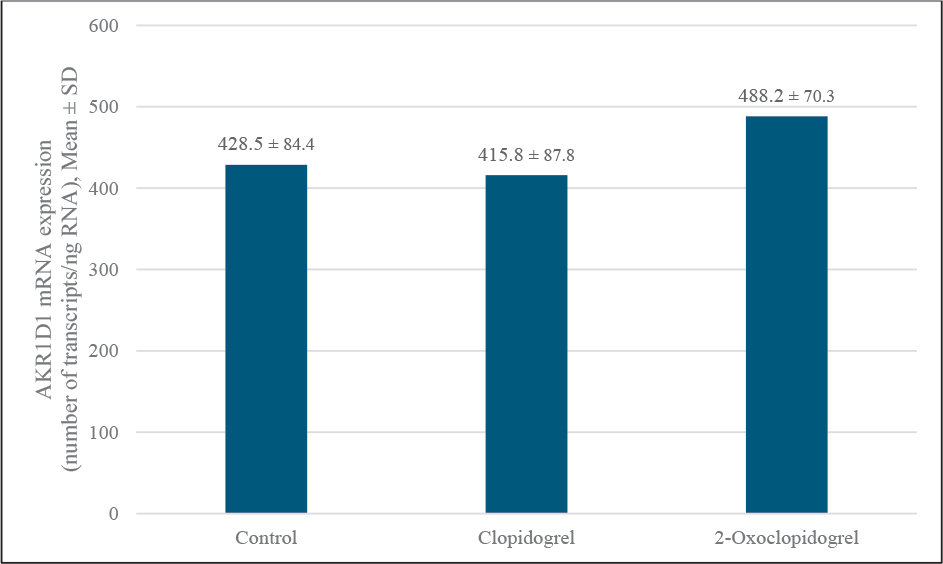
Figure 3.
AKR1D1 mRNA expression levels (mean ± SD) in HepG2 cells following treatment with clopidogrel and 2-oxoclopidogrel (5 μM each). No significant changes were observed compared to the control group (p > 0.05).