
Table 1.
Key laboratory findings in serum/plasma over the course of the disease in a patient with COXPD21
| Laboratory findings in blood | 6 months of age | 2 years of age | 4.5 years of age | Reference range |
|---|---|---|---|---|
| Blood gases | ||||
| pH | 7.4 | 7.39 | 7.42 | 7.35–7.45 |
| HCO3m mmol/L | 20.0 | 16.4 | 24.2 | 21–28 |
| Base excess, mmol/L | −4.5 | −8.5 | −0.2 | −2−+3 |
| Biochemistry | ||||
| Serum creatinine, mcmol/L | 24 | 111 | 274 | 23–37 |
| GFR*, ml/min | 116.4 | 32 | 17 | ≥90 |
| Cystatin C, mg/L | 1.16 | 2.22 | 4.5 | 0.62–1.2 |
| Urea, mmol/L | 4.9 | 15.0 | 35.0 | 3.3–7.5 |
| Uric acid, mcmol/L | 272 | 238 | 148 | 120–320 |
| Potassium, mmol/L | 2.8 | 6.8 | 5.8 | 3.4–4.7 |
| Sodium, mmol/L | 136 | 121 | 146 | 136–148 |
| Calcium, mmol/L | 2.71 | 2.27 | 2.38 | 2.05–2.74 |
| Magnesium, mmol/L | 0.88 | 0.67 | 0.90 | 0.7–1.05 |
| Phosphorus, mmol/L | 2.2 | 0.96 | 2.88 | 1.05–1.80 |
| Lactate, mmol/L | 2.53 | 2.15 | 2.0 | 0.2–2.0 |
| Hormonal status | ||||
| Parathyroid hormone, pg/mL | 26.3 | 3.3 | 17.5 | 15.8–68.3 |
| 25-hydroxyitamin D, nmol/L | 47.8 | 58.9 | 18.0 | 75.0–250.0 |
| Thyroid stimulating hormone, mIU/L | 1.06 | 3.58 | 9.17 | 0.35–4.94 |
| Free T4, pmol/L | 16.63 | 12.7 | 8.98 | 9.0–19.0 |
Table 2.
Results of urinary analyses over the course of the disease in a patient with COXPD21
| Urinalysis | 6 months of age | 2 years of age | 4.5 years of age | Reference Range |
|---|---|---|---|---|
| pH | 6.0 | 6.5 | 6.5 | 5–8 |
| Urine- Specific gravity | 1010 | 1010 | 1005 | 1010–1030 |
| Urine protein, g/L | <0.1 | <0.1 | <0.1 | <0.1 |
| Urine glucose, mmol/L | Negative | Negative | 5.5 | Negative |
| Urine blood, RBC/uL | Negative | Negative | Negative | Negative |
| Urine white blood cells | Negative | Negative | Negative | Negative |
| Protein/Cr, mg/mmoL | 20 | 30 | 52 | <50 |
| Aminoaciduria | Negative | Negative | Generalized | Negative |
| Beta-2 microglobulin/Cr, mg/mmoL | 0.14 | 0.34 | 26.0 | <0.35 |
| Calcium/Cr, mmol/mmol | 0.26 | 0.21 | 1.64 | * |
| Uric acid/Cr, mmol/mmol | 1.4 | 0.35 | 0.08 | * |
| FeNa, % | 0.8 | 3.1 | 32 | <1 |
| FeMg, % | 6.65 | 4.98 | 38.4 | <4 |
| TTKG | 9 | 3 | 2 | 4–6* |
| TRP, % | 93.8 | 81.2 | 45 | 85–95 |
| TmP/GFR, mmol/L | 1.41 | 1.64 | 0.78 | 1.13–1.88 |
[i] Cr – creatinine
[ii] FeNa – Fractional excretion of sodium
[iii] FeMg – Fractional excretion of magnesium
[iv] *TTKG – trans-tubular gradient of potassium (>4% suggests kidney losses in hypokalaemic patient; <7% indicate hypoaldosteronism in hyperkalaemia)
[v] TRP – tubular reabsorption of phosphate
[vi] TmP/GFR - tubular maximum phosphate reabsorption per glomerular filtration rate
[vii] *Ca/Cr, mmol/mmol - (< 2.2 for <12 months; <1.5 for 1 to 3 years; <1.1 for 3 to 5 years)
[viii] *Uric acid/Cr, mmol/mmol - (1.5 for < 1 years; 1.3 for 1 to 3 years; 1.0 for 3 to 5 years)
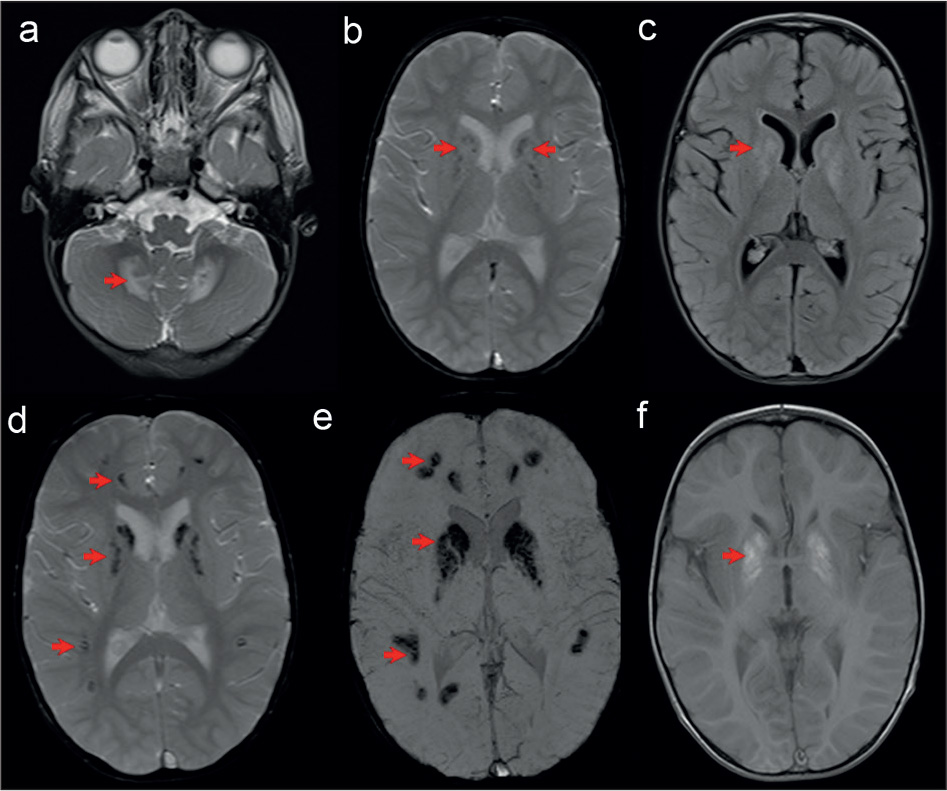
Figure 1.
1.5T Brain MRI of the patient: a–c were performed at the age of 2.5 years; a- pathologically increased signal of the brain parenchyma on T2/DVI/FLAIR sequences, in the projection of the white matter of the cerebellum; b- in the projection of nucleus caudate, globus pallidus, putamen and dentate nuclei there are punctiform and slightly linear zones of reduced signal intensity on the chemo-sensitive sequence, which are hyperintense on T1WI (c); d–f Brain MRI were performed at the age of 4 years; d- in the same regions, there are significantly larger hypointense signal lesions on T2WI/FLAIR sequences and SWI sequences (e), hyperintense on T1WI (f), corresponding to punctiform and serpiginous calcification zones. Mild ventriculomegaly is shown on these sequences.