
Table 1.
The primers sequence for qPCR
| Gene name | Primer (5′-3′) | |
|---|---|---|
| ENST00000470527.1 | Forward | TGGAATTCGATGGGAACTTT |
| Reverse | GTCTCGTCCTGGATTGAAGG | |
| ENST00000504497.1 | Forward | TCGATTCTCCTGTCAGTGAAC |
| Reverse | AATGTTTCCAGAGCACCACT | |
| ENST00000417781.5 | Forward | GTTGATCGATCCAAGGTCGT |
| Reverse | GCCTGGAATCCCAGCATTT | |
| ENST00000440408.5 | Forward | TGCTTGGACAACAGACATGA |
| Reverse | GAAGCAATGTAATCCCAGCA | |
| GAPDH | Forward | AACTTTGGCATTGTGGAAGG |
| Reverse | GGATGCAGGGATGATGTTCT | |
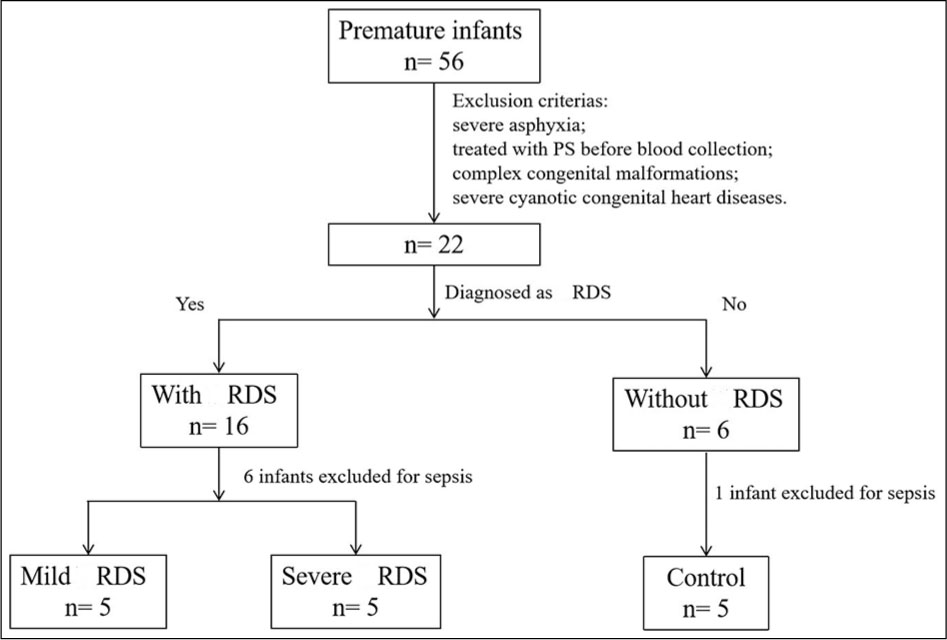
Figure 1.
The recruitment procedures of the patients.
Table 2.
Clinical characteristics of the three groups
| Group | G1 (N=5) | G2 (N=5) | G3 (N=5) | P valve |
|---|---|---|---|---|
| Gestational age (week) | 32.54±2.35 | 32.14±3.47 | 31.11±1.15 | 0.66 |
| Birth weight (g) | 1654.00±540.81 | 1622.00±503.16 | 1473.00±274.94 | 0.81 |
| Apgar score at 5 min | 9.20±0.84 | 8.40±1.14 | 8.40±1.14 | 0.41 |
| Male (%) | 40.00 | 40.00 | 20.00 | 0.78 |
| Cesarean section (%) | 40.00 | 40.00 | 60.00 | 0.80 |
| Twins (%) | 20.00 | 0 | 20.00 | 0.62 |
| Gestational diabetes (%) | 60.00 | 40.00 | 40.00 | 0.80 |
| Without glucocorticoid usage before delivery (%) | 40.00 | 20.00 | 40.00 | 0.78 |
[i] Quantitative data are represented as mean ± SEM. G1 was infants without RDS, G2 was infants with mild RDS and G3 was infants with severe RDS.
Table 3.
The differentially expressed lncRNAs (Fold change> 2)
| LncRNA | Gene | Trend | CHR | Strand |
|---|---|---|---|---|
| ENST00000417781.5 | CSE1L-AS1 | Up | chr20 | − |
| ENST00000418924.6 | RIN3 | Up | chr14 | + |
| ENST00000440408.5 | TTTY15 | Up | chrY | + |
| ENST00000467315.5 | PFKL | Up | chr21 | + |
| ENST00000470527.1 | CACHD1 | Up | chr1 | + |
| ENST00000481985.5 | RPL3 | Up | chr22 | − |
| ENST00000488606.5 | MRPS15 | Up | chr1 | − |
| ENST00000497617.1 | TSFM | Up | chr12 | + |
| ENST00000504497.1 | DMXL1 | Up | chr5 | + |
| ENST00000530931.1 | CD82 | Up | chr11 | + |
| ENST00000460278.5 | ANKRD28 | Down | chr3 | − |
| ENST00000544168.5 | AKT1 | Down | chr14 | − |
| ENST00000611549.4 | RAP1GAP | Down | chr1 | − |
| ENST00000491117.5 | GNA12 | Down | chr7 | − |
| ENST00000610076.1 | KCNT2 | Down | chr1 | − |
| ENST00000601034.2 | INTS6-AS1 | Down | chr13 | + |
| ENST00000570265.5 | C15orf41 | Down | chr15 | + |
| ENST00000592944.1 | ITGA2B | Down | chr17 | − |
| ENST00000494731.5 | ZDHHC20 | Down | chr13 | − |
| ENST00000628791.1 | AC093495.1 | Down | chr3 | + |
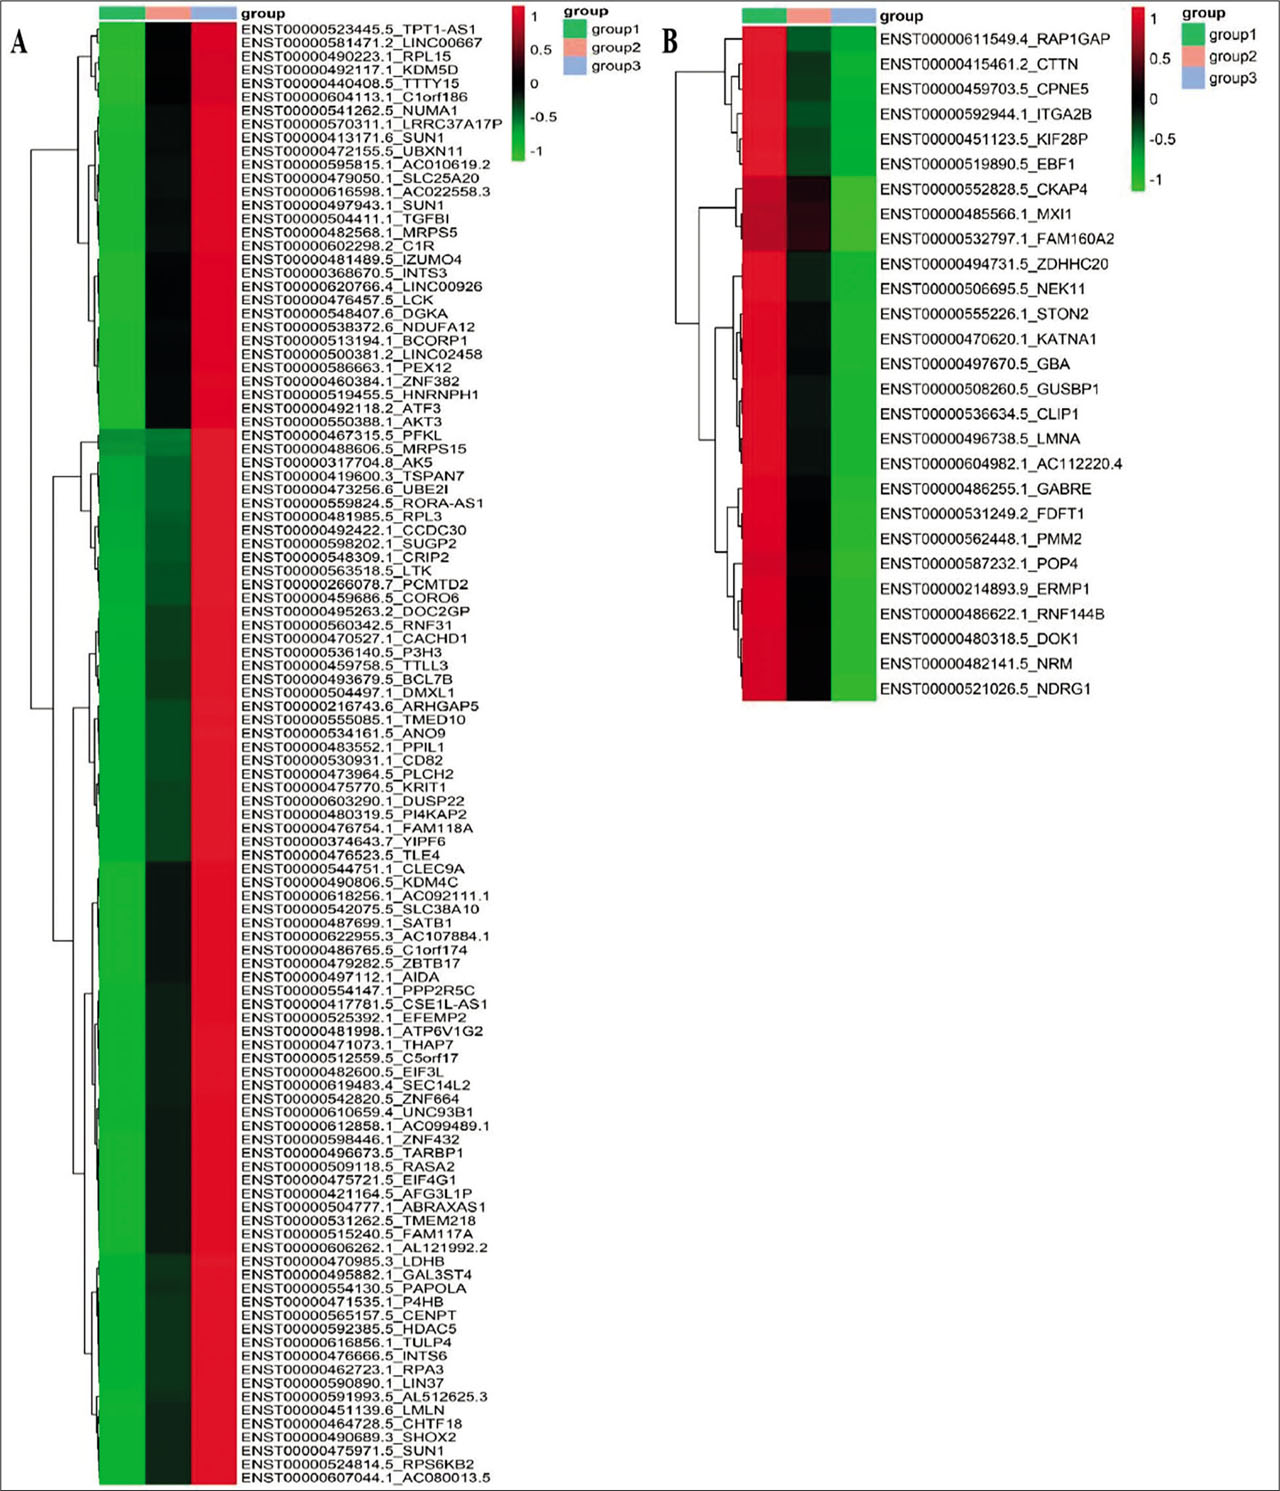
Figure 2.
Hierarchical clustering of lncRNA expression among the three groups. (A) 108 upregulated lncRNAs, (B) 27 downregulated lncRNAs. Red indicates significantly increased expression. Green indicates significantly reduced expression, and black indicates no difference in expression levels.
Table 4.
The differentially expressed mRNAs (Fold change> 2)
| mRNA | lncRNA | Trend | CHR | Strand |
|---|---|---|---|---|
| AC027796.3 | ENSG00000262304.2 | Up | chr17 | − |
| AQP7 | ENSG00000165269.12 | Up | chr9 | − |
| ARNT2 | ENSG00000172379.20 | Up | chr15 | + |
| DGCR6 | ENSG00000183628.12 | Up | chr22 | + |
| GRID2IP | ENSG00000215045.8 | Up | chr7 | − |
| MICU3 | ENSG00000155970.11 | Up | chr8 | + |
| MROH7-TTC4 | ENSG00000271723.5 | Up | chr1 | + |
| RHOXF1 | ENSG00000101883.4 | Up | chrX | − |
| ZNF683 | ENSG00000176083.17 | Up | chr1 | − |
| AC046185.1 | ENSG00000125695.12 | Down | chr17 | − |
| AC137834.1 | ENSG00000258830.1 | Down | chr12 | − |
| AL136295.1 | ENSG00000254692.1 | Down | chr14 | − |
| BLOC1S5-TXNDC5 | ENSG00000259040.5 | Down | chr6 | − |
| CTSV | ENSG00000136943.10 | Down | chr9 | − |
| CYP3A5 | ENSG00000106258.13 | Down | chr7 | − |
| GABRE | ENSG00000102287.18 | Down | chrX | − |
| GSTM5 | ENSG00000134201.10 | Down | chr1 | + |
| KCNT2 | ENSG00000162687.16 | Down | chr1 | − |
| MRAP2 | ENSG00000135324.5 | Down | chr6 | + |
| MYZAP | ENSG00000263155.5 | Down | chr15 | + |
| PKDCC | ENSG00000162878.12 | Down | chr2 | + |
| PPP1R14C | ENSG00000198729.4 | Down | chr6 | + |
| SH3D19 | ENSG00000109686.17 | Down | chr4 | − |
| SLC2A14 | ENSG00000173262.11 | Down | chr12 | − |
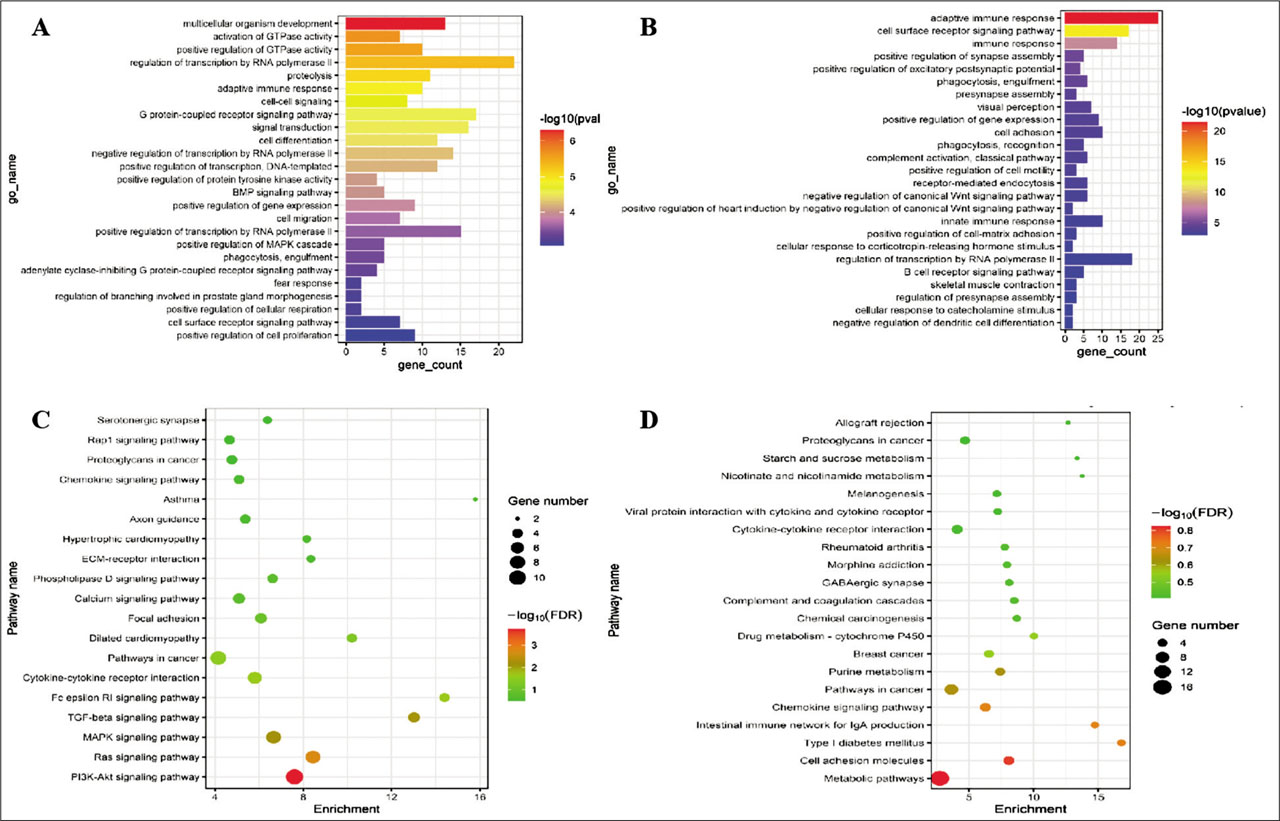
Figure 3.
GO and KEGG analysis of lncRNA function-related mRNAs. (A) GO terms associated with mRNAs related to upregulated lncRNAs on biological process. (B) GO terms associated with mRNAs related to downregulated lncRNAs on biological process. (C) Bubble Diagram of the KEGG pathways of mRNAs associated with upregulated lncRNAs. (D) Bubble Diagram of the KEGG pathways of mRNAs associated with downregulated lncRNAs.
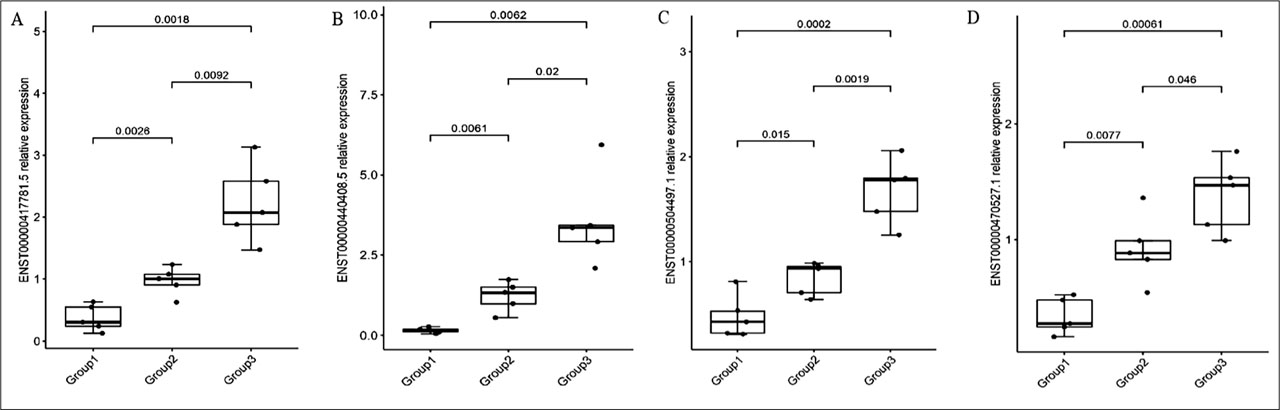
Figure 4.
qRT-PCR of the differentially expressed lncRNAs. The expression level of differentially expressed four lncRNAs were further determined using qRT-PCR. Group1 was infants without RDS, Group2 was infants with mild RDS, and Group3 was infants with severe RDS. (A) relative expression of ENST00000417781.5, (B) relative expression of ENST00000440408.5, (C) relative expression of ENST00000504497.1, (D) relative expression of ENST00000470527.1
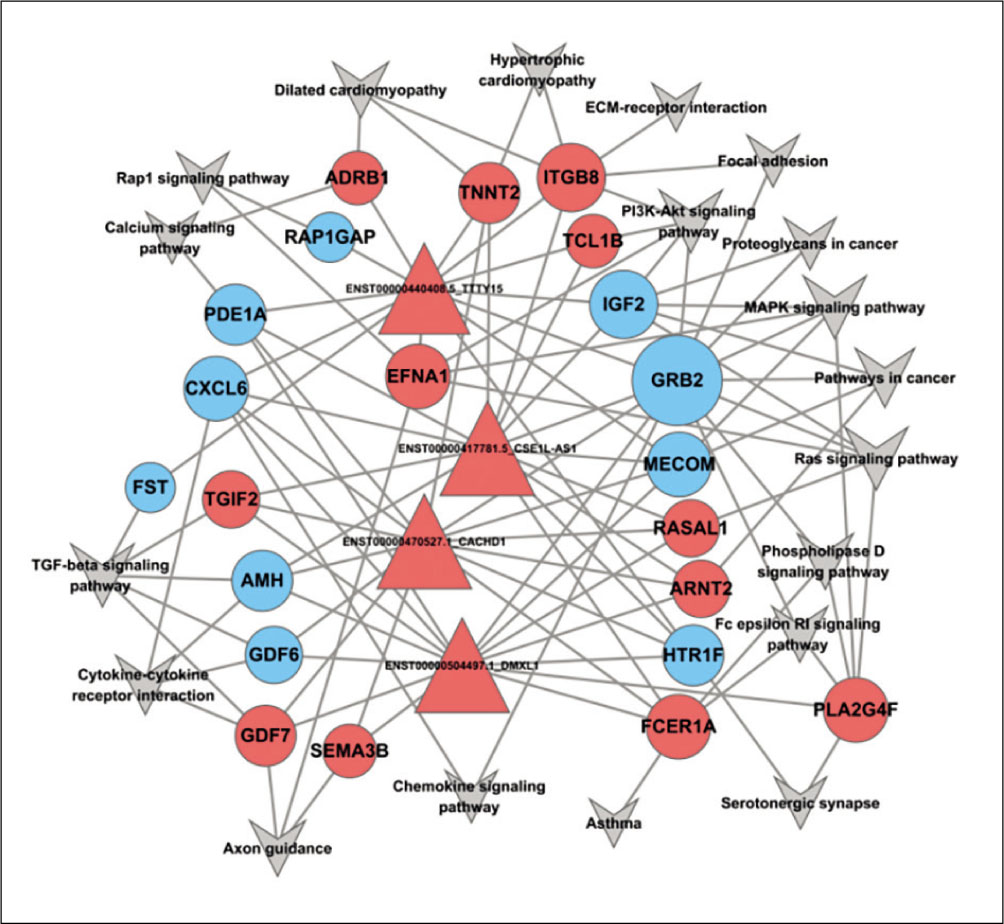
Figure 5.
Pathway regulatory network of four validated lncRNAs. Red triangles indicate the four selected lncRNAs. Blue circles indicate mRNAs down-regulated by lncRNAs, while red circles indicate mRNAs up-regulated by lncRNAs, respectively. Arrows indicat1e signaling pathways associated with protein-coding genes co-expressed with the four selected lncRNAs.