
Figure 1
Upper and lower ranges and mean values of different variables in cases and controls_
| Category | Age in Years (mean/range) | BMI (kg/m2) (mean/range) | RBS/FBS (mg/dL) (mean/range) | Hb A1c (%) (age mean) |
|---|---|---|---|---|
| T1DM (males) | 40.0 (5-67) | 22.3 (12.7-32.2) | 196.7 (122.0-384.0) | 9.4 (6.8-15.5) |
| T1DM (females) | 43.1 (15-62) | 24.6 (16.0-37.2) | 219.1 (8161.0-402.0) | 9.6 (7.3-12.1) |
| T2DM (males) | 57.4 (32.0-100.0) | 23.4 (13.5-39.8) | 245.0 (135-510.0) | 9.6 (6.7-13.7) |
| T2DM (females) | 5.5 (29.0-91.0) | 22.1 (12.3-37.3) | ?269.7 (144.0-510.0) | 9.8 (6.9-12.7) |
| Controls | 44.0 (10.0-100.0) | 21.2 (14.5-33.7) | 112.3 (70.0-168.0) | – |
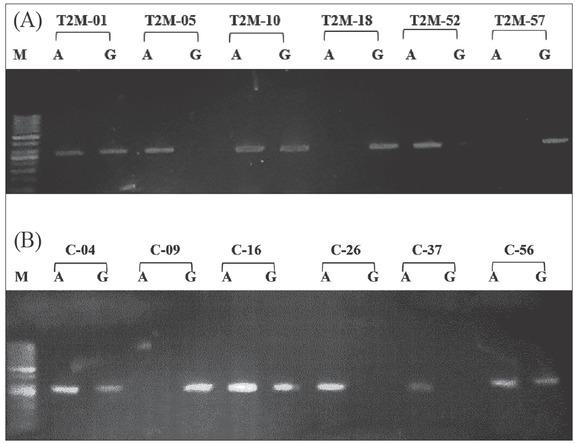
Genotype and allele frequencies VDR gene SNP (rs1544410) using codominant, additive, homozygous dominant, homozygous recessive models_
| Statistical Model | Genotype | Cases (n=250) (%) | Controls (n=250) (%) | χ2 (df=2) | OR (95% CI) | RR (95% CI) | p Value |
|---|---|---|---|---|---|---|---|
| Genotype Frequency/ Codominant Model | AA | 65 (26.0) | 32 (12.8) | 41.81 | – | – | 0.0001 |
| AG | 69 (27.6) | 139 (55.6) | |||||
| GG | 116 (46.4) | 79 (31.56) | |||||
| Homozygous Dominant Model | GG | 116 (46.4) | 79 (31.6) | – | 2.970 | 1.798 | <0.0001 |
| AG+AA | 134 (28.6) | 271 (68.3) | (2.086-4.227) | (1.501-2.154) | |||
| Homozygous Recessive Model | AA | 65 (26.0) | 32 (12.8) | – | 2.394 | 1.460 | 0.003 |
| AG+GG | 185 (74.0% | 218 (87.2) | (1501-3.816) | (1.225-1.740) |