
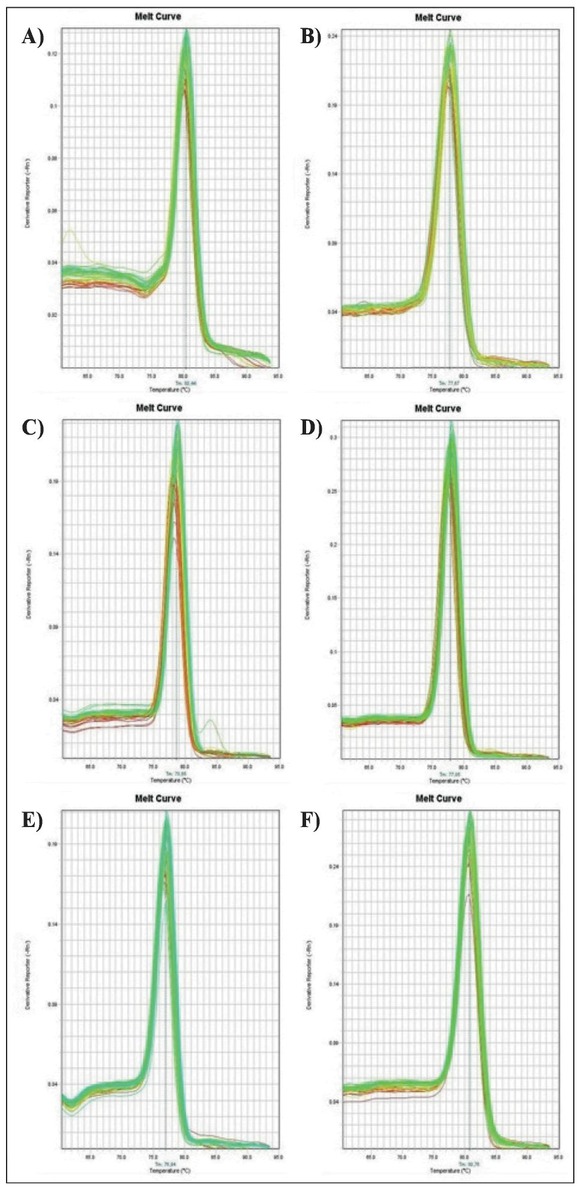
Figure 1
Melting (dissociation) curve analysis of the five HERV-encoded genes and the endogenous control used for normalization. A specific single peak was detected in the dissociation curves for all amplicons in every SLI and control sample. Panel A: HERV-K (HML-2) gag amplicons with a melting temperature 80.4 °C ± 1 °C. Panel B: HERV-K em with a melting temperature 77.7 °C ± 1 °C. Panel C: HERV-P em amplicons with a melting temperature 78.7 °C ± 1 °C. Panel D: HERV-R em with a melting temperature 77.9 °C ± 1 °C. Panel E: HERV-Wpo/ amplicons with a melting temperature 76.9 °C ± 1 °C. Panel F: GAPDH with a melting temperature 80.8 °C ± 1 °C.
Table 1
The HERV-specific qRT-PCR primer pairs.
| HERV Gene | Forward Primer (5'>3') | Reverse Primer (5'>3') |
|---|---|---|
| HERV (HML-2) gag | GGC CAT CAG AGT CTA AAC CAC G | CTG ACT TTC TGG GGG TGG CCG |
| HERV-K env | GGG TAC CTG GCC CCA TAG AT | CAT CAT CCC TTC TTC CTC AGG TT |
| HERV-W pol | TGA GTC AAT TCT CAT ACC TG | AGT TAA GAG TTC TTG GGT GG |
| HERV-P env | CAA GAT TGG GTC CCC TCA C | CCT ATG GGG TCT TTC CCT G |
| HERV-R em | CAT GGG AAG CAA GGG AAC Τ | CTT TCC CCA GCG AGC AAT AC |
[i] HERV: human endogenous retrovirus elements; qRT-PCR: quantitative reverse-transcription polymerase chain reaction.
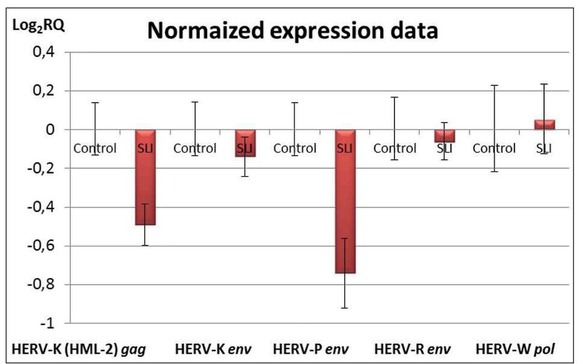
Figure 2
Differential expression of HERV in children with SLI (data presented in logarithmic scale). The qRT-PCR analysis of gene expression revealed that levels of HERV-K (HML-2) gag and HERV-P env were at least 1.4-times lower in the children with SLI compared to those in the control group (1.41- and 1.67-fold change for HERV-K (HML-2) gag and HERV-P env, respectively). Quantitative evaluation of the other three genes: HERV-K env, HERV-R env and HERV-W pol, found no significant changes in expression between the two groups.
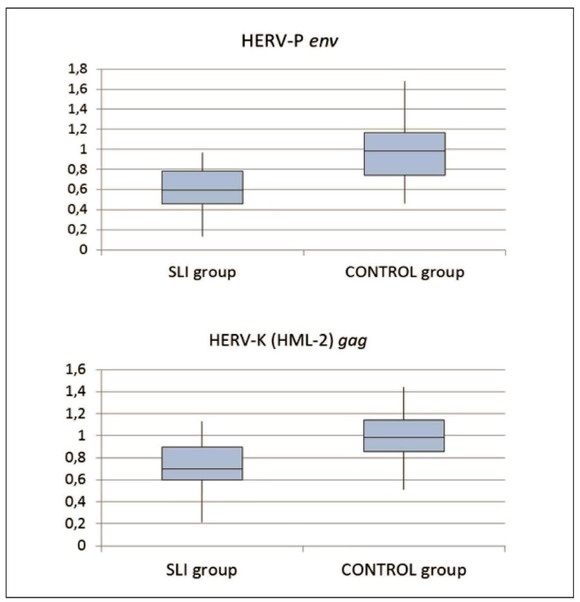
Figure 3
Relative quantitation of differentially expressed HERV genes in SLI children and healthy controls. Data is presented in box plot diagrams with linear scale. The HERV levels in the control are normalized to 1.
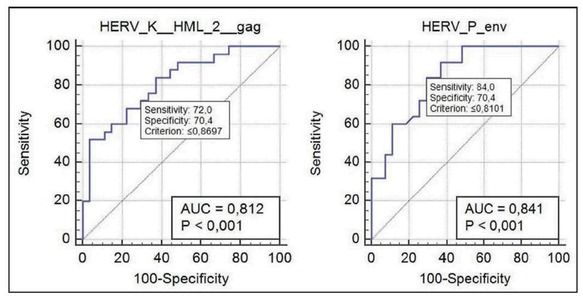
Figure 4
Receiver operating characteristic curve analysis on differential expression data for HERV-K (HML-2) gag and HERV-P env The ROC curves were calculated using MedCalc (https://www.mecalc.org) commercial statistical software. Random predictive accuracy (AUC value of 0.5 that corresponds to a 50.0% chance of discrimination by pure guessing) is denoted by a diagonal line. The ROC curves were plotted for HERV-K (HML-2) gag and HERV-P em that yielded 0.828 and 0.858 AUC values, respectively.