
Table 1
Primer sequences and probes.
| Gene | Primer Sequences (5'>3') | UPL Probe | Amplicon size |
|---|---|---|---|
| PTX3 | F: GCTG GTG CTA GAG GAG CTG R: GGA ATA AAA TAG CTG TTT CAC AAC CT | Probeno: #23 (04686977001) | 106 bp |
| β-actin | F: CGA CAG GAT GCA GAA GGA G R: AGG AGG AGC AAT GAT CTT GAT CT | Probeno: #37 (04687957001) | 74 bp |
[i] UPL: Universal ProbeLibrary; F: forward; PTX3: pentraxin 3; R: reverse; bp: base pair.
Table 2
Unexplained recurrent pregnancy loss and control group characteristics.
| Parameters | Mean ± SD | Mean Values (min-max) | Mean ± SD | Mean Values (min-max) | ρ Value |
|---|---|---|---|---|---|
| Age (years) | 29.76 ±5.04 | 29 (22-40) | 29.34 ±4.51 | 29 (19-41) | 0.819 |
| Number of previous miscarriages | 2.34 + 0.77 | 2(2-5) | – | – | – |
| Gestational week of current miscarriage | 10.16 ±3.58 | 9 (5-20) | – | – | – |
| Number of previous live births | 0.46 ± 0.61 | 0(0-2) | 1.68 ±0.74 | 2(1-4) | 0.0001 |
| PTX3 mRNA expression levels | 0.0014 ±0.0059 | 0.0001 (0.000-0.418) | 0.000012 ±0.000038 | 0.000002 (0.000-0.000264) | 0.0001 |
[i] UPRL: Unexplained recurrent pregnancy loss; SD: standard deviation; min-max, minimum-maximum.
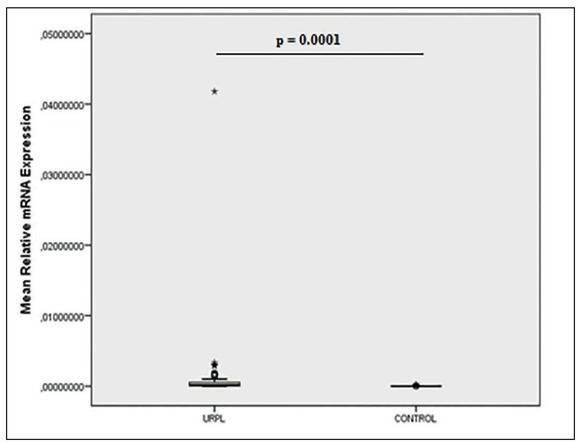
Figure 1
Mean PTX3 mRNA expression normalized for β-actin mRNA expression in the placentai tissues from URPL patients and control subjects. The small circles mean the outlier values and the asterisks (*) indicate extreme values.
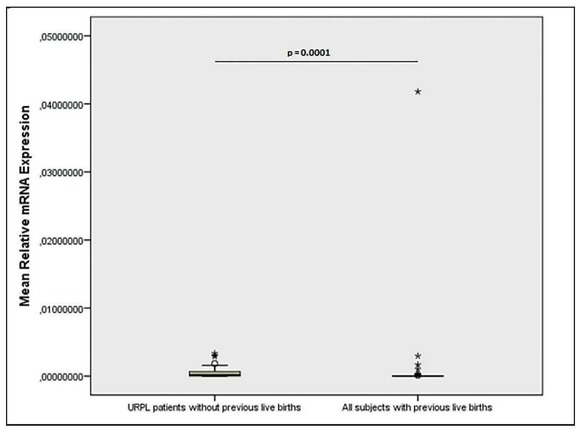
Figure 2
Mean PTX3 mRNA expression normalized for β-actin mRNA expression in the placentai tissues from URPL patients without live birth, all women (URPL patients and controls) with previous live births. The small circles mean the outlier values and the asterisks (*) indicate extreme values.
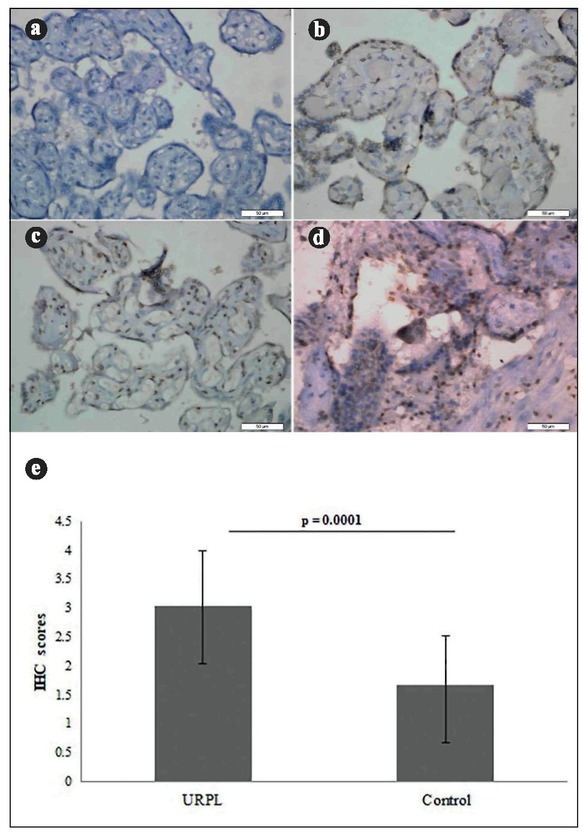
Figure 3
Representative images of PTX3 immunhistochemistry staining in the placentai tissues derived from control subjects (a and b) and URPL patients (c and d). Pentraxin 3 is exclusively expressed in the cytoplasm. Positive staining is shown in brown. Subjects were semi-quantified as score 1 (a), score 2 (b), score 3 (c), score 4 (d) (original magnification, X400). (e) Immunhistochemistry scores for PTX3 expression was significantly higher in URPL patients than the control subjects. Values are expressed as means ± SDs.