
The rule changes implemented by the Federation International Basketball Association in 2000 significantly influenced the dynamics of basketball. Notably, reducing the shot clock from 30 to 24 s and the time allowed to cross half-court from 10 to 8 s increased the total time spent on high-intensity actions during games (Abdelkrim et al., 2010). As exercise intensity rises, athletes are more prone to experience delayed onset muscle soreness (DOMS), characterized by muscle strain, stiffness, increased sensitivity to pressure (lower pain pressure threshold, PPT), decreased range of motion, and diminished maximum voluntary contraction (Glasgow et al., 2014; Gulick & Kimura, 1996). DOMS is closely associated with muscle damage, which can be quantified through biomarkers such as creatine kinase (CK) and myoglobin (Mb) concentrations, reflecting cell membrane permeability and muscle fiber disruption, and through PPT, which serves as an objective measure of muscle soreness due to mechanosensitive nociceptor activation (Fleckenstein et al., 2017). DOMS can manifest within 8 h post-exercise, peaking between 24 and 48 h before gradually resolving over 5–7 days due to physiological changes in muscle fibers (Glasgow et al., 2014).
In elite basketball, recovery may extend up to 48 h following practices and games (Vickers, 2001). This process is challenging to manage due to multiple contextual factors, such as travel conditions, individual chronotype, activity type, playing position, and variations in playing time (Doeven et al., 2018). Monitoring individual loads from games and practices alongside performance and fatigue biomarkers is essential for preparing players for subsequent loads and preventing injuries (Halson, 2014). Collecting basal biomarker levels immediately post-match, prior to recovery interventions, is essential to establish the acute effects of exercise, while measurements at 24 and 48 h post-exercise are vital for tracking recovery dynamics (Lee et al., 2017). Blood biochemical indicators, including CK and Mb, are widely used to assess muscle damage, as their elevated levels indicate increased membrane permeability and correlate with delayed onset muscle soreness (DOMS) severity, increased pain sensitivity (measured via PPT), and reduced muscle strength (Wolska et al., 2023). This decrease in strength necessitates higher-intensity efforts to achieve normal performance levels (Hughes et al., 2018). In severe cases, pain can significantly hinder training for several days (Geneen et al., 2014). While adaptation to exercise reduces DOMS over time, symptom intensity and duration can vary based on individual predispositions, even among similarly trained athletes (Cheung et al., 2003). Premature returns to training without adequate recovery can contribute to injuries (Pernigoni et al., 2022).
Effective recovery strategies are crucial for minimizing the risk of non-functional overload and injury in athletes (Kellmann et al., 2018). Athletes must balance training and competition demands with contextual life stressors while ensuring sufficient recovery periods (Halson, 2014). In team sports like basketball, where high physiological and physical needs are common, implementing effective recovery strategies is essential for maintaining performance throughout the competitive season (Mihajlovic et al., 2023). A recent survey identified active recovery (AR), cold-water immersion (CWI), contrast-water therapy (CWT), and passive rest (no intervention, CWR) as commonly utilized recovery strategies in basketball, despite limited scientific support for their comparative effectiveness (Mihajlovic et al., 2023). Although these methods are widely adopted, there is no consensus on their efficacy, with some studies reporting benefits in reducing muscle damage and perceived soreness (Xiao et al., 2023), while others show conflicting results or minimal effects on recovery biomarkers (Peake et al., 2017). Furthermore, few studies have directly compared AR, CWI, CWT, and passive rest within the same basketball-specific study, leaving a gap in understanding their relative effects on DOMS-related outcomes, such as CK, Mb, and PPT (Higgins et al., 2017).
The efficacy of water immersion at different temperatures and AR has gained attention for its potential to alleviate muscle damage and enhance recovery processes (Bonilla et al., 2020; Cunha et al., 2023; López-Torres et al., 2023). For instance, systematic reviews indicate that AR protocols lasting 6–10 min consistently benefit physical performance, though optimal intensity levels for such recovery remain inconclusive (Bonilla et al., 2020; Cunha et al., 2023; López-Torres et al., 2023). CWI aims to reduce tissue temperature and blood flow, thereby decreasing swelling, inflammation, and pain perception while potentially lowering CK and Mb levels (Ortiz et al., 2019). It has been shown to lower circulating CK activity and Mb concentration after high-intensity exercise (Ihsan et al., 2016; Machado et al., 2016). However, CWI’s effect on PPT, a direct measure of DOMS-related pain sensitivity, may be less consistent, with some evidence suggesting transient increases in pain sensitivity post-immersion (Pinto et al., 2020). CWT, which alternates CWI with hot water immersion, has demonstrated positive effects on CK activity at 48- and 72-h post-exercise, with significant reductions in Mb concentration observed 48 h after recovery (Bieuzen et al., 2013). Passive rest, as a control condition, may allow natural recovery processes to occur without additional thermal or mechanical stress; however, its comparative efficacy remains underexplored in basketball contexts (Bishop et al., 2007).
Given the increasing intensity of basketball due to rule changes and the prevalence of DOMS among athletes, it is essential to identify effective recovery strategies that minimize muscle damage and optimize performance (Mihajlovic et al., 2023). Despite the common use of AR, CWI, CWT, and CWR in basketball, the scientific evidence supporting their effectiveness on DOMS-related biomarkers and pain sensitivity remains limited in this population (Mihajlovic et al., 2023). The aim of this study is to address this gap by comparing the effects of AR, CWI, CWT, and CWR on CK activity, Mb concentration, and PPT in national-level basketball players following a competitive match. Understanding the impact of these recovery interventions on CK, Mb, and PPT is vital for developing evidence-based strategies to mitigate DOMS and enhance recovery in basketball players. We hypothesized that (1) AR, CWI, and CWT would significantly reduce CK and Mb concentrations compared to CWR at 24 and 48 h post-match, with CWI and CWT showing greater reductions due to their vasoconstrictive effects; (2) CWI would result in lower PPT values (indicating higher pain sensitivity) compared to AR, CWT, and CWR, due to potential transient nociceptor sensitization; and (3) CWR would show the least improvement in CK, Mb, and PPT, as it lacks active or thermal intervention to improve recovery processes.
The population consisted of 20 national-level basketball players and champions of the Polish Energa Basket Liga. Participants were aged between 18 and 35 years, with a mean age of 24.75 years. Their average height was 194.7 cm, body mass was 91.62 kg, and BMI was 23.96. All players participated in top-tier league competitions and were recruited for the study by the team’s physiotherapist. G*Power software (version 3.1) was used to estimate the sample size for a two-way repeated measures ANOVA in a randomized crossover study design. Using a partial effect size (η 2) of 0.2, power of 0.8, p-value of 0.05, and correlation of 0.5 between repeated measures, a minimum sample size of 12 was calculated (Bieuzen et al., 2013; Kang, 2021). To ensure sufficient power and account for potential variability, a total of 20 participants were recruited, each undergoing all 4 recovery interventions: (i) CWI; (ii) CWT; (iii) AR; and (iv) CWR, in a randomized order. All players met the following inclusion criteria: (1) training experience ≥ 8 years, (2) minimum playing time during basketball matches >20 min, and (3) being male athletes. The exclusion criteria were: (1) previous injury of lower limb within the past 6 months that required medical intervention or limited training participation, (2) game duration <20 min, and (3) inability or unwillingness to participate in exercise tests. Figure 1 illustrates the CONSORT diagram flow for randomized crossover trials (Dwan et al., 2019). The study was conducted in accordance with the ethical principles of the Declaration of Helsinki. All participants were informed about the procedures and provided written informed consent prior to participation. The consent to conduct the research was granted by the Bioethics Committee at the Medical University of Wrocław based on opinion No. KB – 19/2018.
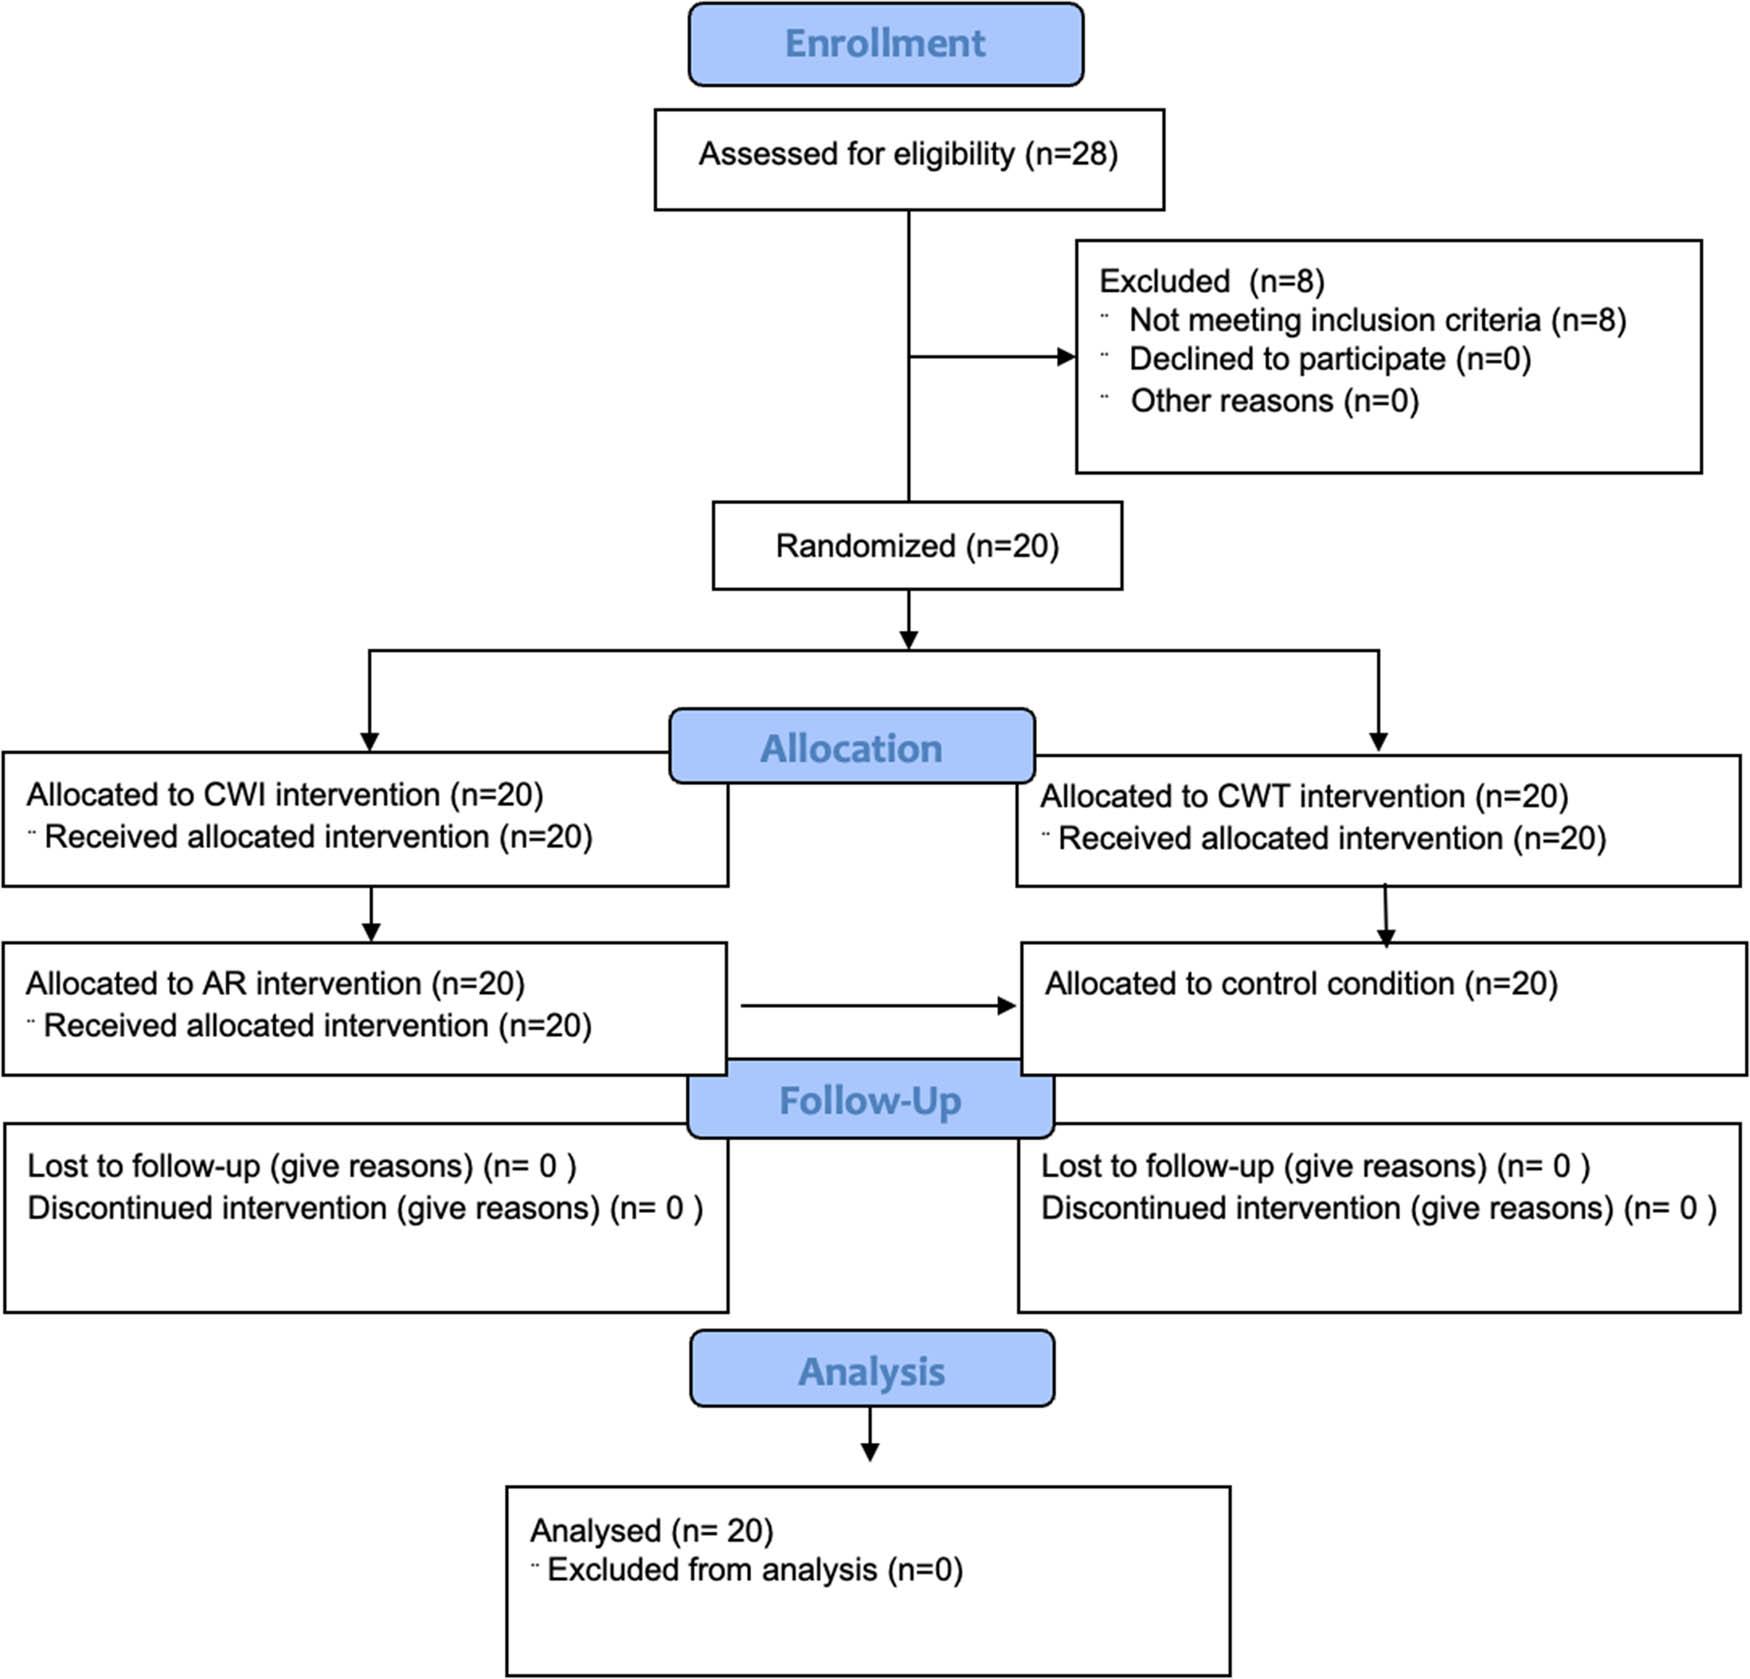
CONSORT diagram flow
This study employed a randomized cross-over trial design to investigate the effects of different recovery interventions on pain sensitivity thresholds and blood biomarkers associated with muscle damage in basketball players. The experiment was carried out over four sessions spanning 8 weeks, with each session conducted after a different home league match. Participants were randomly assigned to one of four recovery conditions for the entire duration of the study: (i) CWI, (ii) CWT, (iii) AR, or (iv) CWR. Each of the 20 participants underwent all 4 recovery interventions (CWI, CWT, AR and CWR), across the four sessions in a randomized crossover design, with counterbalancing to minimize order effects. The recovery interventions were applied only once immediately after the match, following baseline data collection. PPTs and blood biomarkers (CK, Mb) were measured immediately after the match and prior to any recovery intervention (serving as baseline). Subsequent assessments were performed at 24 and 48 h post-match, without additional recovery interventions at these later time points. A single-blinded approach was used, and the assessors responsible for measuring outcomes (PPTs and blood analysis) were blinded to the participants’ condition allocations. The individual responsible for determining subject eligibility for inclusion in the trial was blinded to condition allocation at the time of the decision. The participants were randomly assigned to either the experimental or control conditions using a simple random sampling strategy. Letters were randomly assigned to the participants to determine their condition. Four types of letters were prepared according to the number of players, and each player was requested to pick one. The participants picked the letters in alphabetical order and joined their conditions.
All interventions were administered by trained research assistants who were not involved in data collection or analysis to minimize bias. All recovery interventions were initiated within 15 min following the completion of the match and baseline data collection. The CWI condition received CWI using ice baths, with participants submerged in water at 5°C for 5 min. This temperature and duration were chosen based on evidence suggesting optimal efficacy for reducing inflammation and muscle soreness at temperatures between 5 and 15°C for durations of 5–15 min (Hohenauer et al., 2015; Versey et al., 2013). Pools were provided by ICOOLSPORT, and full immersion of the lower limbs was ensured, with the iliac crest completely submerged, to maximize cooling and recovery effects on large muscle conditions. The CWT condition received CWT, a protocol involving alternating hot and cold baths. Each cycle consisted of 3 min in hot water at 40°C followed by 1 min in cold water at 10°C, repeated over a 20-min session (Bieuzen et al., 2013; Bouzigon et al., 2016). As with CWI, the entire lower limbs were submerged during immersion. The AR condition followed a well-defined AR protocol designed to enhance recovery and reduce DOMS. Immediately post-match, participants engaged in 10 min of low-intensity jogging (approximately 50–60% of maximum heart rate), intended to increase circulation and assist with lactate clearance (Dupuy et al., 2018). Additionally, structured training sessions targeting DOMS reduction were conducted at 24 and 48 h post-match, each lasting 20–30 min. These sessions included a combination of light aerobic exercises (e.g., walking or cycling at 40–50% of maximum heart rate), dynamic stretching, and mobility exercises specifically targeting muscle conditions commonly affected in basketball (e.g., quadriceps, hamstrings, calves), as previously recommended (Reilly & Ekblom, 2005). Exercises focused on movements within the low-intensity range, avoiding significant fatigue while stimulating recovery processes. Participants in the CWR condition (control without recovery) did not receive any additional recovery intervention and did not follow their usual post-match routine, providing a baseline comparison for evaluating the effects of the active interventions. These sessions were conducted after blood collection at each time point to avoid acute exercise effects on biomarker levels.” Only the immediate post-match 10-min low-intensity jogging occurred before the first (baseline) measurement, and this was consistent across all conditions, thus not affecting between-condition comparisons
PPTs were assessed using a pressure algometer (Somedic Algometer type 2, Sweden) applied to specific muscle points, including the quadriceps and triceps surae muscles. The used pressure algometer was tested for its validity and reliability, showing excellent concurrent validity with an analogue algometer (intraclass correlation coefficients [ICC] ranging from 0.82 to 0.99, with 95% confidence intervals of 0.65–0.99) in healthy participants and moderate to excellent validity in individuals with conditions affecting pain sensitivity (Castien et al., 2021; Reezigt et al., 2023). Before initiating the pain threshold measurements, participants were positioned comfortably in a lying-down position. Any clothing obstructing access to the target muscle points, such as pants or socks, was removed to facilitate accurate placement of the pressure algometer. PPTs were measured exclusively on the right leg, targeting the quadriceps and triceps surae muscles, to standardize the assessment across participants. Before the measurements, specific points on the quadriceps and triceps surae muscles were determined and marked using a permanent marker. These points were selected based on established anatomical landmarks recommended for pressure algometry (Trybulski et al., 2024) for the quadriceps, the midpoint of the rectus femoris muscle belly (approximately 15 cm above the patella); for the triceps surae, the midpoint of the gastrocnemius muscle belly (approximately 10–12 cm below the popliteal crease). These locations were chosen for their sensitivity to pressure-induced pain and relevance to basketball-related muscle strain.
The pressure algometer was positioned perpendicular to the skin surface over the predetermined measurement points on the target muscles. The algometer tip, equipped with a rubber cover of standardized thickness (2 mm) and diameter (10 mm), was gently pressed against the muscle with controlled force. The pressure rate was maintained at a standardized level of 30 kPa/s to ensure consistency across measurements. Participants were instructed to indicate when they first perceived the sensation of pain induced by the pressure stimulus applied by the algometer. This was achieved by pressing a manual button or signaling verbally to the examiner. The value displayed on the algometer monitor at the moment of pain perception was recorded as the pain sensitivity threshold for the respective muscle point. Measurements were repeated at each designated measurement point to obtain a comprehensive assessment of pain sensitivity across different muscle regions (Trybulski et al., 2024). Pain sensitivity threshold measurements were recorded for each participant at predetermined time points corresponding to different stages of the study, specifically immediately after the match and prior to any recovery intervention (baseline), and at 24 and 48 h post-match following the single recovery intervention.
Blood analysis procedures were conducted to assess CK activity and Mb concentration (Hebisz et al., 2022). Blood samples were collected from participants by standard intravenous puncture by a qualified nurse immediately after the match (prior to any recovery intervention), and also at 24 h and 48 h post-match. The test consisted of drawing 5 ml of venous blood from the area of the dominant ulnar fossa into a tube containing EDTA (Becton Dickinson and Co., Franklin Lakes, NJ, United States). Blood samples were centrifuged twice (1,600× g, 10 min) within 2 h after collection (before storage at 4°C).
Clear plasma samples were transferred to fresh Eppendorf tubes and stored at a temperature of −80°C until further analysis. Proper labeling and documentation of the samples were ensured to track the identity and time point of each sample accurately. For the data analysis, CK activity (U/L) and Mb concentration (ng/mL) were measured. CK activity was analyzed with an EC 2.7.3.2 Assay Kit (Biosystems, Barcelona, Spain), and enzyme-linked immunosorbent assays were used to assess changes in Mb concentration (Human Mb Matched Antibody Pair Kit AB215407m Cambridge, United Kingdom). The normal value range for CK activity was 30–135 (U/L), as Mb concentration was 25–72 ng/mL (Skogstrand et al., 2008).
Each sample was analyzed in duplicate to minimize analytical variability, and the average value of the two measurements was used for subsequent statistical analysis. Quality control measures, including calibration of instruments and regular performance checks, were implemented to ensure the accuracy and precision of the analytical procedures. CK and Mb concentrations were recorded for each participant at predetermined time points corresponding to different stages of the study, namely, immediately after the match and prior to the recovery intervention (baseline), and at 24 and 48 h post-match.
Descriptive statistics (arithmetic means and standard deviations) were calculated to summarize the data. All variables demonstrated normal distribution (Shapiro–Wilk test, all p > 0.05) and homogeneity of variances (Levene’s test, all p > 0.05), supporting the use of parametric statistical procedures. Given the crossover design where each participant completed all four recovery conditions across separate matches, baseline differences at immediate post-match was assessed for each outcome measure (CK, Mb, quadriceps PPT, and calves PPT) using one-way repeated measures analysis of variance (ANOVA). This analysis examined whether match-to-match variability in physical demands resulted in systematic differences across testing sessions. To examine the effects of recovery condition (within-subjects factors: AR, CWI, CWT, and CWR) and time (within-subjects factors: immediately after match, 24 h post-match, 48 h post-match) on all outcome measures, two-way repeated measures ANOVAs were conducted. When sphericity assumptions were violated (Mauchly’s test, p < 0.05), Greenhouse-Geisser corrections were applied to adjust degrees of freedom. To control for any baseline differences identified in the equivalence analysis and to isolate recovery intervention effects from pre-existing match-induced variability, analysis of covariances (ANCOVAs) were conducted at 24 and 48 h post-match with immediate post-match values as covariates. This approach allowed for valid comparison of recovery trajectories by adjusting for differential starting points across conditions. To address potential concerns regarding baseline equivalence and to directly assess recovery magnitude independent of absolute baseline values, change scores were calculated for all outcome measures. Change scores were computed as: Δ24 h = (24 h value – immediate post-match value) and Δ48 h = (48 h value – immediate post-match value). Descriptive statistics (mean values and standard deviations) were calculated for each change score variable across the four recovery conditions. One-way ANOVAs were conducted on change scores to examine whether the magnitude of change from baseline differed significantly across recovery conditions, with effect sizes reported as eta squared (η 2). This complementary analytical approach allowed evaluation of both absolute recovery outcomes (via ANCOVA-adjusted comparisons) and relative recovery trajectories (via change score comparisons), providing converging evidence for intervention effects while accounting for match-to-match variability in baseline values. Significant main effects and interactions in the repeated measures ANOVAs were further explored with Bonferroni-adjusted post hoc comparisons. Post hoc comparisons following ANCOVA were also performed to assess condition differences at 24 and 48 h post-match while controlling for immediate post-match values. Effect sizes are reported as partial eta squared (η 2 p) for ANOVA and ANCOVA tests, and Cohen’s d for post hoc comparisons, with thresholds interpreted as small (0.2), medium (0.5), and large (0.8) effects (Cohen, 1988). η 2 p, values of 0.01, 0.06, and 0.14 represent small, medium, and large effects, respectively. Collinearity diagnostics confirmed no violations of statistical assumptions for ANCOVA models. All analyses were performed using JASP software (Version 0.19.3; JASP Team, 2025), with significance set at p < 0.05.
Descriptive statistics are reported in Table 1.
Descriptive statistics (Mean value ± SD) for each condition at immediate post-match, 24, and 48 h after match
| Measure | Time point | AR | CWI | CWT | CWR | p-value |
|---|---|---|---|---|---|---|
| CK (U/L) | Immediate post-match | 349.8 ± 89.4ᵃ | 265.0 ± 62.6ᵃ | 293.1 ± 84.6ᵃ | 303.0 ± 86.3ᵃ | 0.112 |
| 24 h after match | 453.9 ± 116.1 | 398.8 ± 84.9 | 392.7 ± 107.1 | 393.2 ± 109.6 | ||
| 48 h after match | 338.0 ± 88.2 | 299.8 ± 59.5 | 241.2 ± 67.4 | 292.9 ± 83.3 | ||
| Mb (ng/mL) | Immediate post-match | 48.1 ± 2.9ᵃ | 51.8 ± 14.2ᵃ | 50.0 ± 3.9ᵃ | 45.7 ± 8.1ᵃ | 0.089 |
| 24 h after match | 33.0 ± 2.1 | 38.7 ± 11.5 | 26.2 ± 2.1 | 31.2 ± 5.1 | ||
| 48 h after match | 30.9 ± 1.9 | 34.2 ± 10.2 | 14.6 ± 1.1 | 28.9 ± 4.7 | ||
| Quadriceps PPT (kPa) | Immediate post-match | 1021.1 ± 29.9ᵃ | 1105.6 ± 17.7ᵃ | 1089.8 ± 37.8ᵃ | 1032.0 ± 108.7ᵃ | 0.156 |
| 24 h after match | 900.5 ± 28.9 | 797.7 ± 28.0 | 892.5 ± 31.5 | 892.7 ± 68.1 | ||
| 48 h after match | 940.8 ± 34.5 | 793.2 ± 21.5 | 986.0 ± 36.0 | 859.9 ± 69.2 | ||
| Calves PPT (kPa) | Immediate post-match | 1032.0 ± 27.9ᵃ | 1086.5 ± 31.9ᵃ | 1055.1 ± 47.6ᵃ | 989.4 ± 104.0ᵃ | 0.201 |
| 24 h after match | 910.3 ± 29.5 | 786.5 ± 29.7 | 892.0 ± 37.9 | 852.6 ± 63.0 | ||
| 48 h after match | 965.2 ± 30.5 | 726.6 ± 35.1 | 990.4 ± 39.9 | 833.8 ± 49.7 |
Note: ᵃ indicates no significant differences between conditions at immediate post-match (one-way ANOVA, all p > 0.05). PPT: pain pressure threshold; CK: creatine kinase; Mb: myoglobin; AR = active recovery; CWI = cold-water Immersion; CWT = contrast-water therapy; CWR = control.
A one-way repeated measures ANOVA revealed significant differences in CK levels immediately post-match across the four recovery conditions (F(2.094, 39.794) = 8.226, p < 0.001, η 2 = 0.302), no significant differences in Mb levels immediately post-match across the four recovery conditions (F(1.262, 23.980) = 2.084, p = 0.159, η 2 = 0.099), significant differences in quadriceps PPT levels immediately post-match across the four recovery conditions (F(1.341, 25.476) = 12.335, p < 0.001, η 2 = 0.394), and significant differences in calves PPT levels immediately post-match across the four recovery conditions (F(1.591, 30.236) = 13.547, p < 0.001, η 2 = 0.416).
A two-way repeated measures ANOVA revealed significant main effects of both condition (F(1.88, 35.80) = 6.42, p = 0.005, η 2 = 0.115) and time (F(1.08, 20.42) = 247.36, p < 0.001, η 2 = 0.433), as well as a significant condition × time interaction (F(2.81, 53.47) = 11.07, p < 0.001, η 2 = 0.029) for CK levels. Bonferroni-adjusted post hoc comparisons showed that the AR condition presented significantly lower CK levels than the CWI, CWT, and CWR conditions (all p < 0.05). No significant differences were observed among CWI, CWT, and CWR (all p > 0.05). Regarding the time effect, all comparisons between assessment time points were significant (all p < 0.001), indicating progressive changes in CK levels over the recovery period.
For Mb levels, significant main effects were found for both condition (F(1.29, 24.42) = 10.62, p = 0.002, η 2 = 0.111) and time (F(1.10, 20.87) = 797.26, p < 0.001, η 2 = 0.581), as well as a significant condition × time interaction (F(2.12, 40.29) = 55.87, p < 0.001, η 2 = 0.071). Post hoc analyses with Bonferroni correction revealed that AR, CWI, and CWT all resulted in significantly lower Mb levels compared to CWR (all p ≤ 0.012), with no significant differences among AR, CWI, and CWT.
For quadriceps PPT values, significant main effects were found for both condition (F(1.77, 33.68) = 25.78, p < 0.001, η 2 = 0.096) and time (F(1.89, 35.87) = 1234.64, p < 0.001, η 2 = 0.623), as well as a significant condition × time interaction (F(2.35, 44.67) = 58.04, p < 0.001, η 2 = 0.151). Post hoc analyses with Bonferroni correction revealed that CWR resulted in significantly higher PPT compared to CWI (mean difference = 90.57, p < 0.001) and CWT (mean difference = 61.22, p = 0.004), while AR showed intermediate values, being significantly higher than CWI (mean difference = 55.29, p < 0.001) but lower than CWR (mean difference = −35.28, p = 0.007). No significant differences were found between AR and CWT (p = 0.254) or between CWI and CWT (p = 0.172). Regarding the time effect, all comparisons between assessment time points were significant (all p < 0.001), indicating progressive recovery of quadriceps PPT over time.
For calves PPT values, significant main effects were found for both condition (F(2.21, 41.89) = 67.68, p < 0.001, η 2 = 0.183) and time (F(1.66, 31.55) = 876.41, p < 0.001, η 2 = 0.511), as well as a significant condition × time interaction (F(1.85, 35.15) = 89.77, p < 0.001, η 2 = 0.201). Post hoc analyses with Bonferroni correction revealed that AR and CWR showed significantly higher PPT compared to both CWI and CWT (all p < 0.001), with no significant difference between AR and CWR (p = 1.000) or between CWI and CWT (p = 0.132). Specifically, AR demonstrated significantly higher PPT than CWI (mean difference = 102.62, p < 0.001) and CWT (mean difference = 77.23, p < 0.001), while CWR also showed significantly higher PPT than CWI (mean difference = 112.64, p < 0.001) and CWT (mean difference = 87.25, p < 0.001). Regarding the time effect, all comparisons between assessment time points were significant (all p < 0.001), indicating progressive recovery of calves PPT over time.
To complement the repeated measures ANOVA and address baseline variability across testing sessions, change scores were calculated to directly examine recovery magnitude independent of absolute baseline values. Table 2 presents mean change scores (±SD) from immediate post-match to 24 and 48 h, along with one-way ANOVA results comparing recovery trajectories across conditions.
Change scores (mean value ± SD) from immediate post-match to 24 and 48 h
| Measure | Time change | AR | CWI | CWT | CWR | ANOVA |
|---|---|---|---|---|---|---|
| CK (U/L) | Δ24 h | 104.1 ± 60.8 | 133.8 ± 52.8 | 99.6 ± 50.4 | 90.2 ± 54.1 | F(3,76) = 1.58, p = 0.202, η 2 = 0.058 |
| Δ48 h | −11.8 ± 64.3 | 34.8 ± 47.5 | −51.9 ± 69.3 | −10.1 ± 57.7 | F(3,76) = 4.99, p = 0.003, η 2 = 0.165 | |
| Mb (ng/mL) | Δ24 h | −15.1 ± 2.8 | −13.1 ± 4.1 | −23.8 ± 3.5 | −14.5 ± 4.0 | F(3,76) = 32.37, p < 0.001, η 2 = 0.561 |
| Δ48 h | −17.2 ± 2.9 | −17.6 ± 4.6 | −35.4 ± 3.7 | −16.8 ± 4.2 | F(3,76) = 91.89, p < 0.001, η 2 = 0.784 | |
| Quadriceps PPT (kPa) | Δ24 h | −120.6 ± 23.4 | −307.9 ± 27.8 | −197.3 ± 24.0 | −139.3 ± 53.4 | F(3,76) = 66.08, p < 0.001, η 2 = 0.723 |
| Δ48 h | −80.3 ± 27.0 | −312.4 ± 27.9 | −103.8 ± 28.2 | −172.1 ± 56.2 | F(3,76) = 84.51, p < 0.001, η 2 = 0.769 | |
| Calves PPT (kPa) | Δ24 h | −121.7 ± 22.8 | −300.0 ± 24.9 | −163.1 ± 29.2 | −136.8 ± 50.7 | F(3,76) = 55.79, p < 0.001, η 2 = 0.688 |
| Δ48 h | −66.8 ± 23.0 | −359.9 ± 30.5 | −64.7 ± 31.6 | −155.6 ± 56.0 | F(3,76) = 127.84, p < 0.001, η 2 = 0.835 |
Note: Positive values indicate increase from immediate post-match; negative values indicate decrease. Δ24 h = change from immediate post-match to 24 h; Δ48 h = change from immediate post-match to 48 h. AR = active recovery; CWI = cold-water immersion; CWT = contrast-water therapy; CWR = control without recovery.
To further control for baseline differences, ANCOVAs adjusted for immediate post-match values were conducted at 24 and 48 h (Table 3). These revealed significant condition effects on CK, Mb, quadriceps PPT, and calves PPT at both post-match time points (all p < 0.01), complementing the repeated measures ANOVA findings and confirming that differences between recovery conditions remained significant after adjustment for immediate post-match values.
ANCOVA results for CK, Mb, quadriceps PPT, and calves PPT at 24 and 48 h post-match
| Outcome | Time | Effect | F | p | η 2 p |
|---|---|---|---|---|---|
| CK (U/L) | 24 h | condition | 4.56 | 0.005 | 0.154 |
| Immediately post-match | 329.69 | <0.001 | 0.815 | ||
| 48 h | Condition | 91.82 | <0.001 | 0.786 | |
| Immediately post-match | 1624.71 | <0.001 | 0.956 | ||
| Mb (ng/mL) | 24 h | Condition | 33.09 | <0.001 | 0.570 |
| Immediately post-match | 147.15 | <0.001 | 0.662 | ||
| 48 h | Condition | 141.95 | <0.001 | 0.850 | |
| Immediately post-match | 154.76 | <0.001 | 0.674 | ||
| Quadriceps PPT (kPa) | 24 h | Condition | 46.33 | <0.001 | 0.649 |
| Immediately post-match | 30.05 | <0.001 | 0.286 | ||
| 48 h | Condition | 165.32 | <0.001 | 0.869 | |
| Immediately post-match | 73.15 | <0.001 | 0.494 | ||
| Calves PPT (kPa) | 24 h | Condition | 69.47 | <0.001 | 0.735 |
| Immediately post-match | 51.39 | <0.001 | 0.407 | ||
| 48 h | Condition | 248.27 | <0.001 | 0.908 | |
| Immediately post-match | 20.08 | <0.001 | 0.211 |
Note: ANCOVA adjusted for immediate post-match values as a covariate. Type III Sum of Squares used. η 2 p = partial eta-squared (SS_effect/(SS_effect + SS_residuals)). conditions: AR = active recovery, CWI = cold-water immersion, CWR = control, CWT = contrast-water therapy. CK = creatine kinase, Mb = myoglobin, PPT = pain pressure threshold.
Post hoc comparisons following ANCOVA (Table 4) indicated that at 24 and 48 h, the AR condition had significantly lower CK levels compared to CWI, and the Control (CWR) condition consistently exhibited lower CK than CWI at 48 h. For Mb, the Control condition had significantly lower concentrations than AR and CWI conditions at both time points. Regarding PPTs, CWI was consistently associated with significantly lower quadriceps and calves PPT compared to AR, Control, and CWT conditions at both 24 and 48 h, while the Control condition demonstrated the highest PPT values, particularly at 48 h.
Post hoc comparisons for CK, MB, quadriceps, and calves PPT following significant ANCOVA effects
| Outcome | Time | Comparison | Mean diff | t | p | Marginal means (95% CI) |
|---|---|---|---|---|---|---|
| CK (U/L) | 24 h | AR vs CWI | −43.67 | −2.84 | 0.035* | AR: 399.06 (377.91, 420.22) |
| 0 | CWI: 442.73 (421.88, 463.57) | |||||
| CWR: 403.92 (383.60, 424.24) | ||||||
| CWI vs CWT | 49.76 | 3.41 | 0.006** | CWT: 392.97 (372.69, 413.25) | ||
| 48 h | AR vs CWI | −38.84 | −7.19 | <0.001*** | AR: 295.24 (287.82, 302.67) | |
| AR vs CWR | 45.34 | 8.70 | <0.001*** | CWI: 334.08 (326.77, 341.40) | ||
| CWI vs CWR | 84.18 | 16.54 | <0.001*** | CWR: 249.90 (242.78, 257.03) | ||
| CWI vs CWT | 41.43 | 8.09 | <0.001*** | CWT: 292.66 (285.54, 299.77) | ||
| CWR vs CWT | −42.75 | −8.46 | <0.001*** | |||
| Mb (ng/mL) | 24 h | AR vs CWI | −3.51 | −2.91 | 0.029* | AR: 33.46 (31.78, 35.14) |
| AR vs CWR | 7.99 | 6.68 | <0.001*** | CWI: 36.97 (35.26, 38.67) | ||
| CWI vs CWR | 11.49 | 9.62 | <0.001*** | CWR: 25.47 (23.79, 27.16) | ||
| CWI vs CWT | 3.83 | 3.11 | 0.016* | CWT: 33.14 (31.43, 34.84) | ||
| CWR vs CWT | −7.66 | −6.33 | <0.001*** | |||
| 48 h | AR vs CWR | 17.35 | 16.55 | <0.001*** | AR: 31.34 (29.87, 32.82) | |
| CWI vs CWR | 18.62 | 17.78 | <0.001*** | CWI: 32.62 (31.12, 34.11) | ||
| CWR vs CWT | −16.69 | −15.71 | <0.001*** | CWR: 13.99 (12.52, 15.47) | ||
| CWT: 30.68 (29.18, 32.18) | ||||||
| Quadriceps PPT (kPa) | 24 h | AR vs CWI | 134.82 | 10.49 | <0.001*** | AR: 916.06 (898.96, 933.15) |
| AR vs CWR | 34.08 | 2.75 | 0.045* | CWI: 781.24 (764.03, 798.45) | ||
| CWI vs CWR | −100.74 | −8.76 | <0.001*** | CWR: 881.98 (865.40, 898.55) | ||
| CWI vs CWT | −122.93 | −9.81 | <0.001*** | CWT: 904.17 (887.51, 920.83) | ||
| 48 h | AR vs CWI | 191.17 | 17.09 | <0.001*** | AR: 961.94 (947.07, 976.82) | |
| AR vs CWT | 86.55 | 8.67 | <0.001*** | CWI: 770.77 (755.80, 785.75) | ||
| CWI vs CWR | −200.93 | −20.07 | <0.001*** | CWR: 971.70 (957.28, 986.13) | ||
| CWI vs CWT | −104.62 | −9.59 | <0.001*** | CWT: 875.39 (860.90, 889.89) | ||
| CWR vs CWT | 96.31 | 9.13 | <0.001*** | |||
| Calves PPT (kPa) | 24 h | AR vs CWI | 147.92 | 13.56 | <0.001*** | AR: 914.15 (899.50, 928.81) |
| AR vs CWR | 28.50 | 2.72 | 0.048* | CWI: 766.24 (750.58, 781.89) | ||
| AR vs CWT | 38.90 | 3.64 | 0.003** | CWR: 885.65 (870.93, 900.37) | ||
| CWI vs CWR | −119.42 | −11.32 | <0.001*** | CWT: 875.25 (859.33, 891.17) | ||
| CWI vs CWT | −109.01 | −9.10 | <0.001*** | |||
| 48 h | AR vs CWI | 254.85 | 21.73 | <0.001*** | AR: 967.83 (952.07, 983.59) | |
| AR vs CWT | 118.80 | 10.32 | <0.001*** | CWI: 712.98 (696.14, 729.82) | ||
| CWI vs CWR | −273.10 | −24.06 | <0.001*** | CWR: 986.08 (970.25, 1001.91) | ||
| CWI vs CWT | −136.05 | −10.56 | <0.001*** | CWT: 849.03 (831.91, 866.15) | ||
| CWR vs CWT | 137.05 | 11.44 | <0.001*** |
Note: Post hoc comparisons report significant Bonferroni-adjusted p-values (*p < 0.05, **p < 0.01, ***p < 0.001) following significant condition effects in ANCOVA. Marginal means are adjusted for immediate post-match values. conditions: AR = active recovery, CWI = cold-water immersion, CWR = control, CWT = contrast-water therapy. CK = creatine kinase, Mb = myoglobin, PPT = pain pressure threshold.
This study investigated the effects of CWI, CWT, and AR on biomarkers of muscle damage and pain sensitivity in basketball players following competitive match play. Repeated measures ANOVA revealed significant main effects of condition and time, as well as condition × time interactions, for all outcome variables, with time accounting for the largest proportion of variance. The findings revealed significant changes in CK, Mb, and PPT values, with significant time × condition interactions. Peak CK levels occurred at 24 h post-match across all conditions, followed by decline at 48 h. However, the magnitude of CK elevation and subsequent recovery differed substantially between conditions. Change score analysis revealed that CWR exhibited the smallest increase from immediate post-match to 24 h and the greatest reduction from 24 to 48 h, supporting superior biochemical recovery. Mb levels demonstrated condition-specific temporal patterns, with some participants showing immediate post-match peaks while others peaked at 24 h. This variability likely reflects differential match intensity across testing sessions, as participants experiencing greater exertional stress would be expected to show more pronounced and delayed biomarker elevations. The observed baseline differences (Table 1) and subsequent recovery trajectories underscore the importance of considering both absolute values (via ANCOVA) and relative changes (via delta scores) when interpreting intervention efficacy.
Regarding nociceptive sensitivity, significant main effects of time, condition, and their interaction emerged for quadriceps and calves PPT. CWI consistently showed lower PPT values at 24 and 48 h compared to AR, CWT, and CWR, indicating increased pain sensitivity and slower recovery. This contrasts with initial expectations and previous reports of PPT improvement with CWI (Pinto et al., 2020), potentially reflecting order-specific effects from the baseline variability adjustments. Conversely, CWR exhibited the highest PPT values at both time points, suggesting more effective nociceptive threshold restoration. CWI induces peripheral vasoconstriction, reduces tissue temperature, and modulates inflammatory responses (Bleakley & Davison, 2010), potentially alleviating acute swelling but delaying resolution of exercise-induced hyperalgesia through altered neural conduction or sensitization (Klich et al., 2018; Pinto et al., 2020). This aligns with evidence of transient pain sensitivity increases post-CWI (Klich et al., 2018). Limited literature on CWT and AR effects on PPT suggests potential attenuation of pain-related impairments (Altarriba-Bartes et al., 2020; Vaile et al., 2008), although their impact on nociceptive thresholds remains unclear. Passive rest in CWR condition likely promotes neuromuscular recovery by avoiding thermal or mechanical stress, facilitating efficient pain sensitivity normalization (Scanlan & Madueno, 2016).
The significant condition × time interactions observed for all outcome variables (Table 5) indicate that the recovery trajectories differed substantially across interventions. For CK and Mb, the interaction effects (η 2 = 0.029 and 0.071, respectively) suggest that while time was the dominant factor influencing biomarker clearance, the recovery modality modulated this temporal pattern. The larger interaction effects for PPT measures (η 2 = 0.151 for quadriceps and 0.201 for calves) indicate that recovery condition had a more pronounced differential impact on pain sensitivity restoration compared to biochemical markers. These interactions underscore that recovery is not a uniform process across interventions, with CWI showing persistently lower PPT values while CWR demonstrated superior nociceptive threshold restoration, particularly at 48 h post-match.
Repeated measures ANOVA results for CK, Mb, quadriceps and calves PPT
| Outcome | Effect | df | F | p | η 2 |
|---|---|---|---|---|---|
| CK (U/L) | Condition | 1.88, 35.80 | 6.42 | 0.005 | 0.115 |
| Time | 1.08, 20,42 | 247.36 | <0.001 | 0.433 | |
| Condition × time | 2.81, 53.47 | 11.07 | 0.001 | 0.029 | |
| Mb (ng/mL) | Condition | 1.29, 24.42 | 10.62 | 0.002 | 0.111 |
| Time | 1.10, 20.87 | 797.26 | <0.001 | 0.581 | |
| Condition × time | 2.12, 40.29 | 55.87 | <0.001 | 0.071 | |
| Quadriceps PPT (kPa) | Condition | 1.77, 33.68 | 25.78 | <0.001 | 0.096 |
| Time | 1.89, 35.87 | 1234.64 | <0.001 | 0.623 | |
| Condition × time | 2.35, 44.67 | 58.04 | <0.001 | 0.151 | |
| Calves PPT (kPa) | Condition | 2.21, 41.89 | 67.68 | <0.001 | 0.183 |
| Time | 1.66, 31.55 | 876.41 | <0.001 | 0.511 | |
| Condition × time | 1.85, 35.15 | 89.77 | <0.001 | 0.201 |
PPT: pain pressure threshold; CK: creatine kinase; Mb: myoglobin. Note: Greenhouse-Geisser corrected df reported due to violation of sphericity assumption.
For biochemical biomarkers, the temporal dynamics revealed through both repeated measures ANOVA and change score analysis provide complementary insights into recovery patterns. CK generally followed expected post-exercise kinetics, peaking at 24 h and declining by 48 h (Baird et al., 2012). However, change score analysis revealed important condition-specific differences in recovery magnitude that were masked when examining absolute values alone. At 24 h, all conditions demonstrated comparable CK elevations from baseline, suggesting that the initial 24-h period reflects ongoing muscle damage processes relatively independent of recovery intervention. Critically, by 48 h, significant divergence emerged, with CWT demonstrating the largest reduction from baseline, while CWI uniquely showed continued elevation, indicating delayed biomarker clearance. This finding challenges the common assumption that CWI uniformly accelerates recovery and suggests that vasoconstriction-induced perfusion restrictions may impede systemic metabolite clearance (Machado et al., 2016), potentially prolonging the biochemical signature of muscle damage even as it may suppress acute inflammatory responses.
The AR condition showed elevated CK at 24 h, possibly reflecting sustained mechanical loading exacerbating membrane permeability during the immediate post-match low intensity jogging protocol (Peake et al., 2017). However, by 48 h, AR achieved near-complete restoration to baseline levels, suggesting that the structured AR sessions at 24 and 48 h may have facilitated delayed but effective clearance despite initial elevation. CWR maintained consistently low CK elevations throughout the recovery period, supporting the notion that passive rest allows natural recovery processes without additional thermal or mechanical stress.
Mb demonstrated markedly different recovery kinetics, with highly significant condition effects at both time points (both p < 0.001, η 2 = 0.561–0.784) and substantially larger effect sizes compared to CK. The rapid clearance of Mb across all conditions by 24 h (all negative change scores) reflects its smaller molecular size and faster elimination kinetics compared to CK (Ihsan et al., 2016; Roberts et al., 2014). However, CWT demonstrated exceptional efficacy for Mb clearance, more than doubling the reductions observed in other conditions (range: −16.8 to −17.8 ng/mL). This finding partially aligns with previous evidence of CWT reducing Mb concentration at 48 h post-exercise (Brophy-Williams et al., 2011), and may reflect the alternating vasodilation-vasoconstriction cycles enhancing lymphatic drainage and systemic clearance of low-molecular-weight proteins. The divergent patterns between CK and Mb, with CWT showing superior Mb but not CK reduction, underscore that different biomarkers respond differentially to recovery interventions, likely reflecting distinct clearance mechanisms and molecular characteristics.
Baseline Mb differences across conditions (non-significant but showing some variability) combined with the significant recovery trajectories support the interpretation that match-to-match variability in exertional intensity contributed to differential baseline states. The change score approach effectively isolated intervention effects from these pre-existing differences, revealing that while absolute Mb values varied at baseline, the magnitude and direction of recovery were strongly modulated by intervention type. This analytical strategy, examining both absolute outcomes (ANCOVA) and relative changes (delta scores), provides more robust evidence than either approach alone, particularly given the substantial baseline PPT variability documented in our equivalence analysis.
Physiological stress from CWI, CWT, and AR may induce transient homeostatic disruptions through distinct mechanisms: CWI via sustained vasoconstriction potentially impairing perfusion and metabolite clearance, CWT via alternating thermal stress potentially enhancing circulatory dynamics but imposing cardiovascular demands, and AR via low-grade mechanical loading temporarily elevating biomarker efflux before facilitating delayed clearance through enhanced circulation. The superiority of CWR for certain outcomes, particularly at 48 h, suggests that avoiding additional physiological perturbations may optimize the body’s innate recovery mechanisms for acute (single-intervention) recovery protocols, though this does not preclude potential benefits of repeated interventions over longer time frames (Glasgow et al., 2014).
Several limitations warrant consideration. Most critically, match intensity was not directly quantified across the four testing sessions. While all participants met the inclusion criterion of >20 min playing time, this does not account for session-to-session variability in physical demands, which likely contributed to the substantial baseline differences observed, particularly for PPT measures (quadriceps: η 2 = 0.394; calves: η 2 = 0.416, both p < 0.001). The crossover design, while offering within-subject control for individual differences, cannot eliminate the inherent variability in competitive match demands. Each participant’s physiological state immediately post-match (our designated baseline) may have reflected different degrees of homeostatic disruption across the four sessions. As the reviewer correctly notes, smaller disruptions to homeostasis typically result in faster returns to resting values, making it difficult to determine whether observed differences in recovery trajectories reflect intervention efficacy or differential starting points due to match intensity variability.
We addressed this limitation through two complementary analytical approaches: (1) ANCOVA adjustments using immediate post-match values as covariates to statistically control for baseline differences when comparing 24 and 48 h outcomes, and (2) change score analyses to examine recovery magnitude independent of absolute baseline values. While these statistical adjustments strengthen confidence in our findings, they cannot fully substitute for direct measurement of match workload (e.g., via GPS tracking, accelerometry, or heart rate monitoring). Future investigations should incorporate objective intensity quantification to parse intervention effects from match-induced variability.
Additionally, the lack of pre-match resting baselines for each session limits our ability to contextualize the immediate post-match measurements. Ideally, pre-match assessments would have established each participant’s euhydrated, rested state before each game, allowing calculation of match-induced changes and subsequent recovery relative to true baseline. The current design treats immediate post-match as baseline, which, while standard in many recovery studies, confounds acute match effects with pre-existing individual state. Moreover, uncontrolled variables including sleep quality, nutritional intake, hydration status, and psychological stress may have affected recovery dynamics. The single-intervention design (recovery modality applied only once post-match) also limits conclusions about repeated or prolonged application protocols. Future research should conduct longitudinal designs with larger, more diverse samples, incorporate additional biomarkers (e.g., cytokines, oxidative stress markers), include repeated recovery interventions across multiple time points, and implement comprehensive monitoring of match intensity and contextual recovery factors. Investigation of counterbalancing order effects and adoption of objective intensity measures could substantially improve control over load variability.
This study demonstrated that although AR, CWI, and CWT exerted effects on biomarkers of muscle damage and pain sensitivity following competitive basketball matches, passive recovery elicited the most pronounced reductions in CK and Mb concentrations, alongside the highest PPTs at 48 h post-exercise. Notably, CWI, despite attenuating biochemical indicators of muscle damage, was associated with heightened nociceptive sensitivity relative to other recovery modalities. These findings indicate that passive recovery may facilitate more effective acute restoration of muscle integrity and nociceptive function compared to active or cold-based interventions within the initial 48-h recovery window. From a practical perspective, recovery protocols should incorporate sufficient passive rest, while the application of active and cold therapies ought to be carefully considered to balance their biochemical benefits against potential detriments in pain recovery. Customization of recovery strategies according to individual athlete responses and specific recovery objectives may enhance overall recovery efficacy and mitigate injury risk.
Rui Miguel Silva is a research member of the Sport Physical Activity and Health Research & Innovation Center (SPRINT) which is funded by the Portuguese Foundation for Science and Technology (FCT) under the identifier UID/06185/2025, DOI: 10.54499/UID/06185/2025.
FCT – Fundação para a Ciência e a Tecnologia – Foundation for Science and Technology, I.P. (Portugal), within the scope of SPRINT – Sport Physical Activity and Health Research & Innovation Center [UID/6185/2023] with the DOI: 10.54499/UID/PRR/06185/2025.
Conceptualization: M.J. and S.K.; methodology: M.J. and S.K.; formal analysis: R.M.S. and F.T.G.F; investigation: M.J. and S.K; writing–original draft preparation: R.M.S, M.J., M.S., A.K and S.K.; and writing–review and editing: R.M.S, M.J., F.T.G.F, C.L., M.S., A.K., and S.K. All authors read and approved the final version of the manuscript.
The study was conducted by the Declaration of Helsinki and approved by the Ethics Committee for Social, Life, and Health Sciences of the Polytechnic Institute of Viana do Castelo with the code CECSVS2024/02/I and in compliance with the principles outlined in the Declaration of Helsinki.
Informed consent was obtained from all subjects involved in the study.
The authors declare no conflicts of interest.