
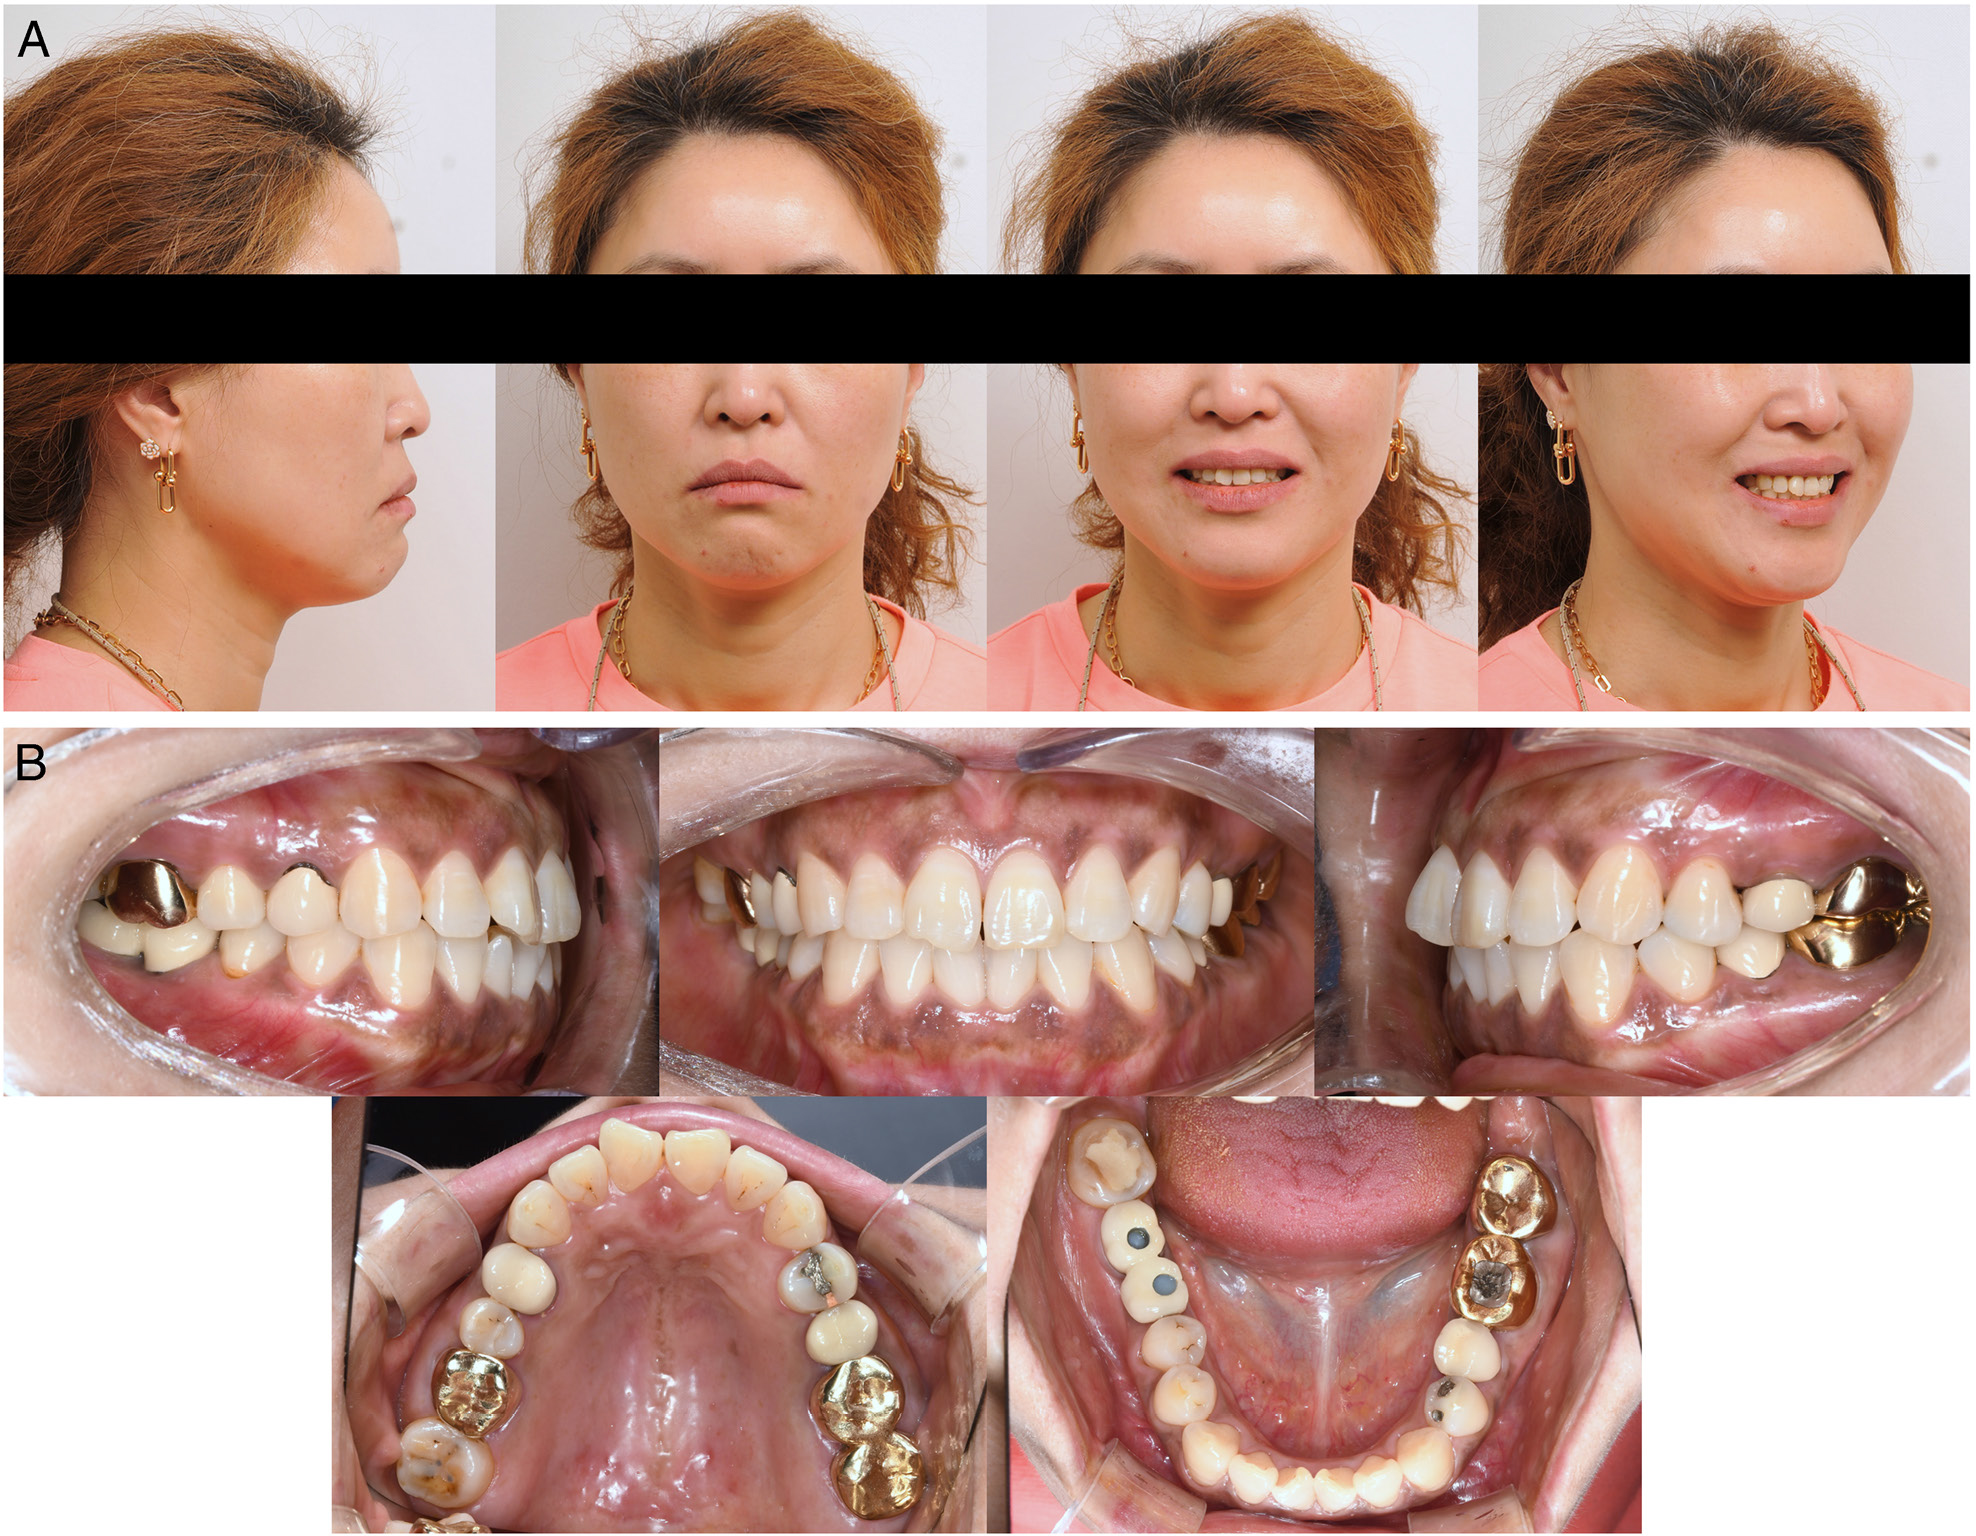
Figure 1.
Pre-treatment photographic records. A. Intraoral views. B. Extraoral views.
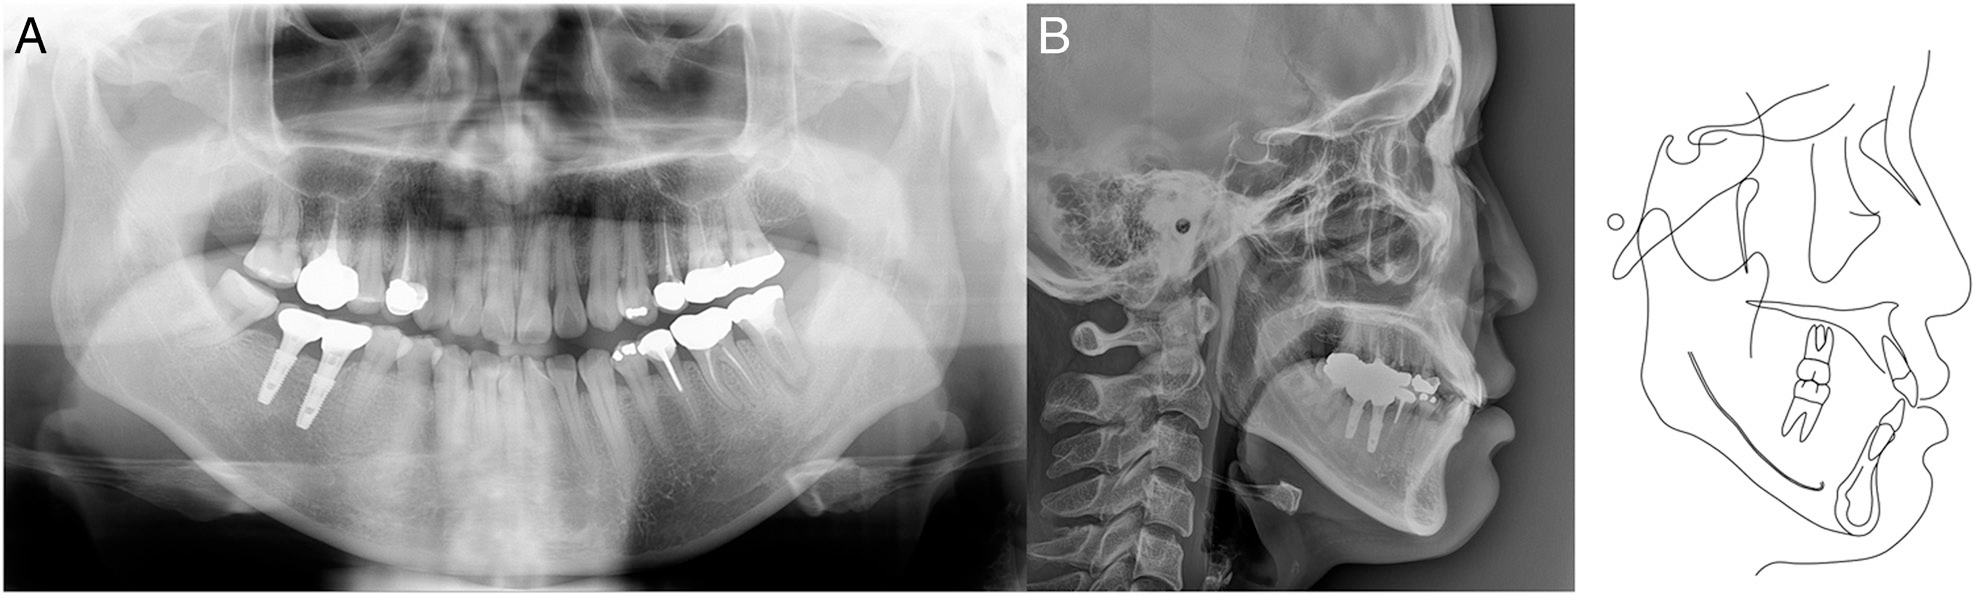
Figure 2.
Pre-treatment radiographic records. A. Panoramic radiograph. B. Lateral cephalogram with corresponding tracing.
Table I.
Cephalometric measurements
| Measurements | Norm | Pre-treatment | Post-treatment | |
|---|---|---|---|---|
| Anterior Posterior | SNA (°) | 81.7 | 81.8 | 81.9 |
| SNB (°) | 79.0 | 79.6 | 79.4 | |
| ANB (°) | 2.8 | 2.3 | 2.6 | |
| Vertical | FMA (°) | 25.4 | 32.3 | 33.2 |
| Gonial Angle (°) | 124.2 | 126.8 | 126.8 | |
| FH-Occ (°) | 5.9 | 12.1 | 12.9 | |
| ANS to Me (mm) | 69.1 | 78.0 | 79.1 | |
| Dental | U1 to FH (°) | 116.6 | 113.0 | 106.7 |
| IMPA (°) | 87.3 | 86.4 | 79.6 | |
| U1 to Sn-TVL (mm) | –9.3 | –4.1 | –6.3 | |
| L1 to Sn-TVL (mm) | –12.4 | –7.8 | –9.2 | |
| Soft tissue | Upper lip to E-line (mm) | –2.1 | –1.1 | –1.6 |
| Lower lip to E-line (mm) | 0 | 2.6 | 0.2 |
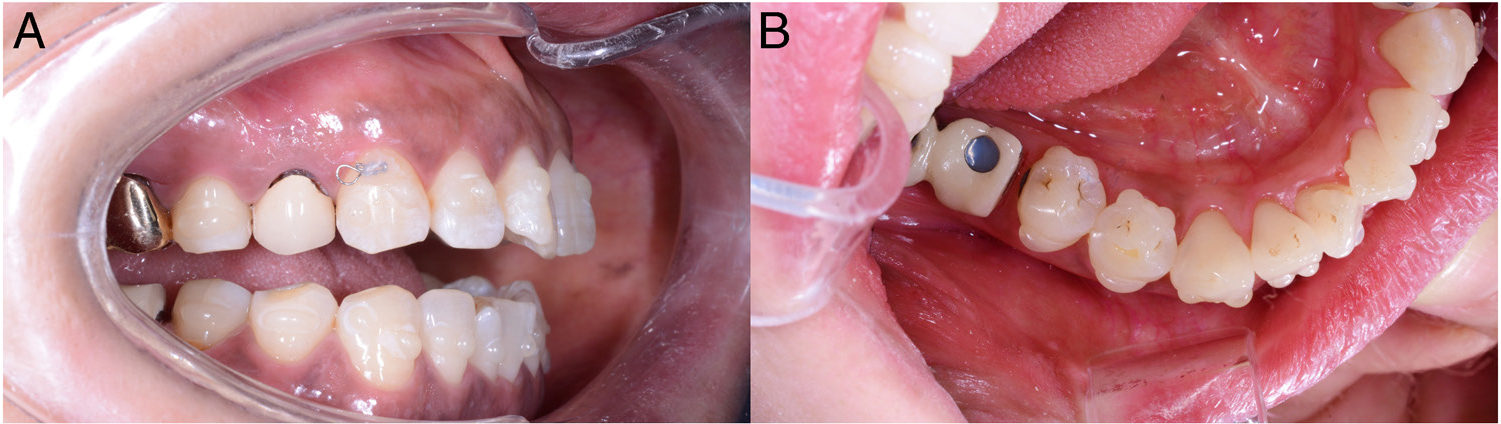
Figure 3.
Preparatory procedures for the virtual setup. A. Intraoral attachments directly bonded to the teeth, including elliptical attachments and cervical eyelets on the canines. B. Mesial interproximal reduction of the mandibular right posterior implant restoration.
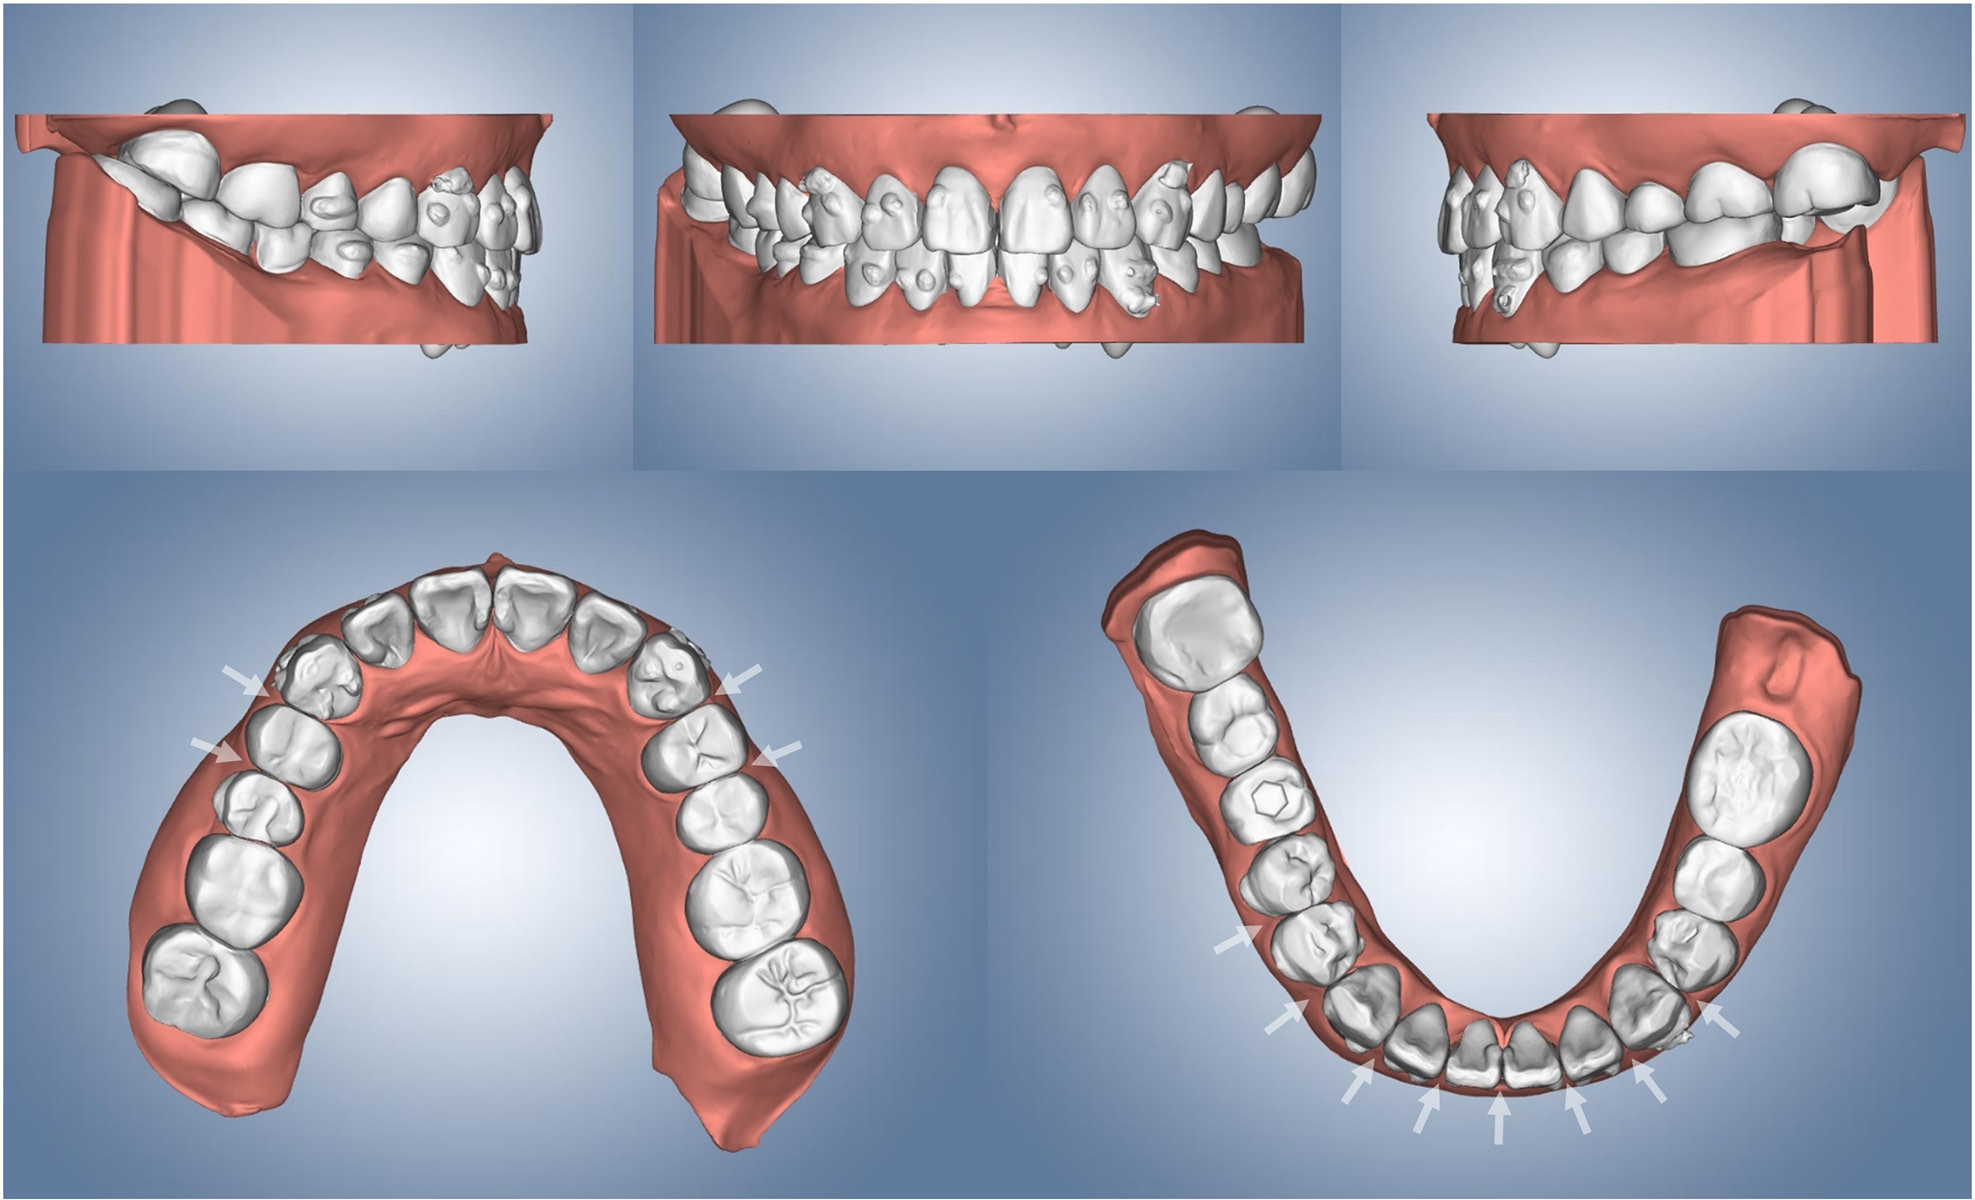
Figure 4.
The initial virtual setup created using orthodontic computer-aided designing software, highlighting the planned interproximal reduction site (white arrow), with a maximum reduction of approximately 0.2 mm.
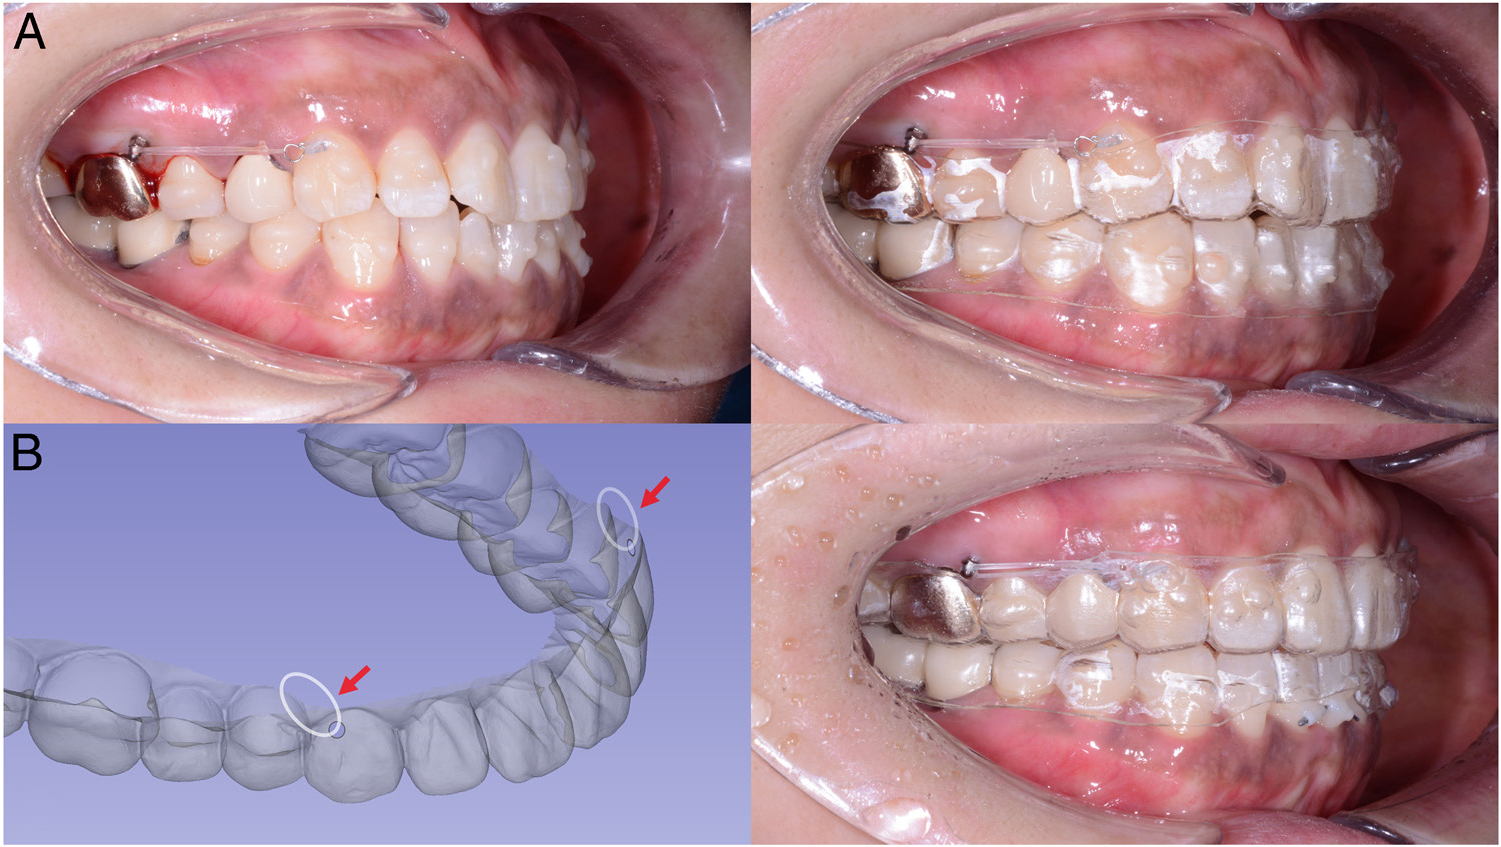
Figure 5.
The application of the distalising force using micro-implant anchorage. A. Distalising forces applied to bonded eyelets for initial canine retraction (left: pre-wear; right: post-wear). B. The integrated aligner elastic technique. An elastic is threaded through holes in the aligner, forming a single, integrated unit delivering approximately 200 g of force upon engagement (left: three-dimensional illustration showing the elastic anchored at the aligner [red arrows]; right: clinical application).
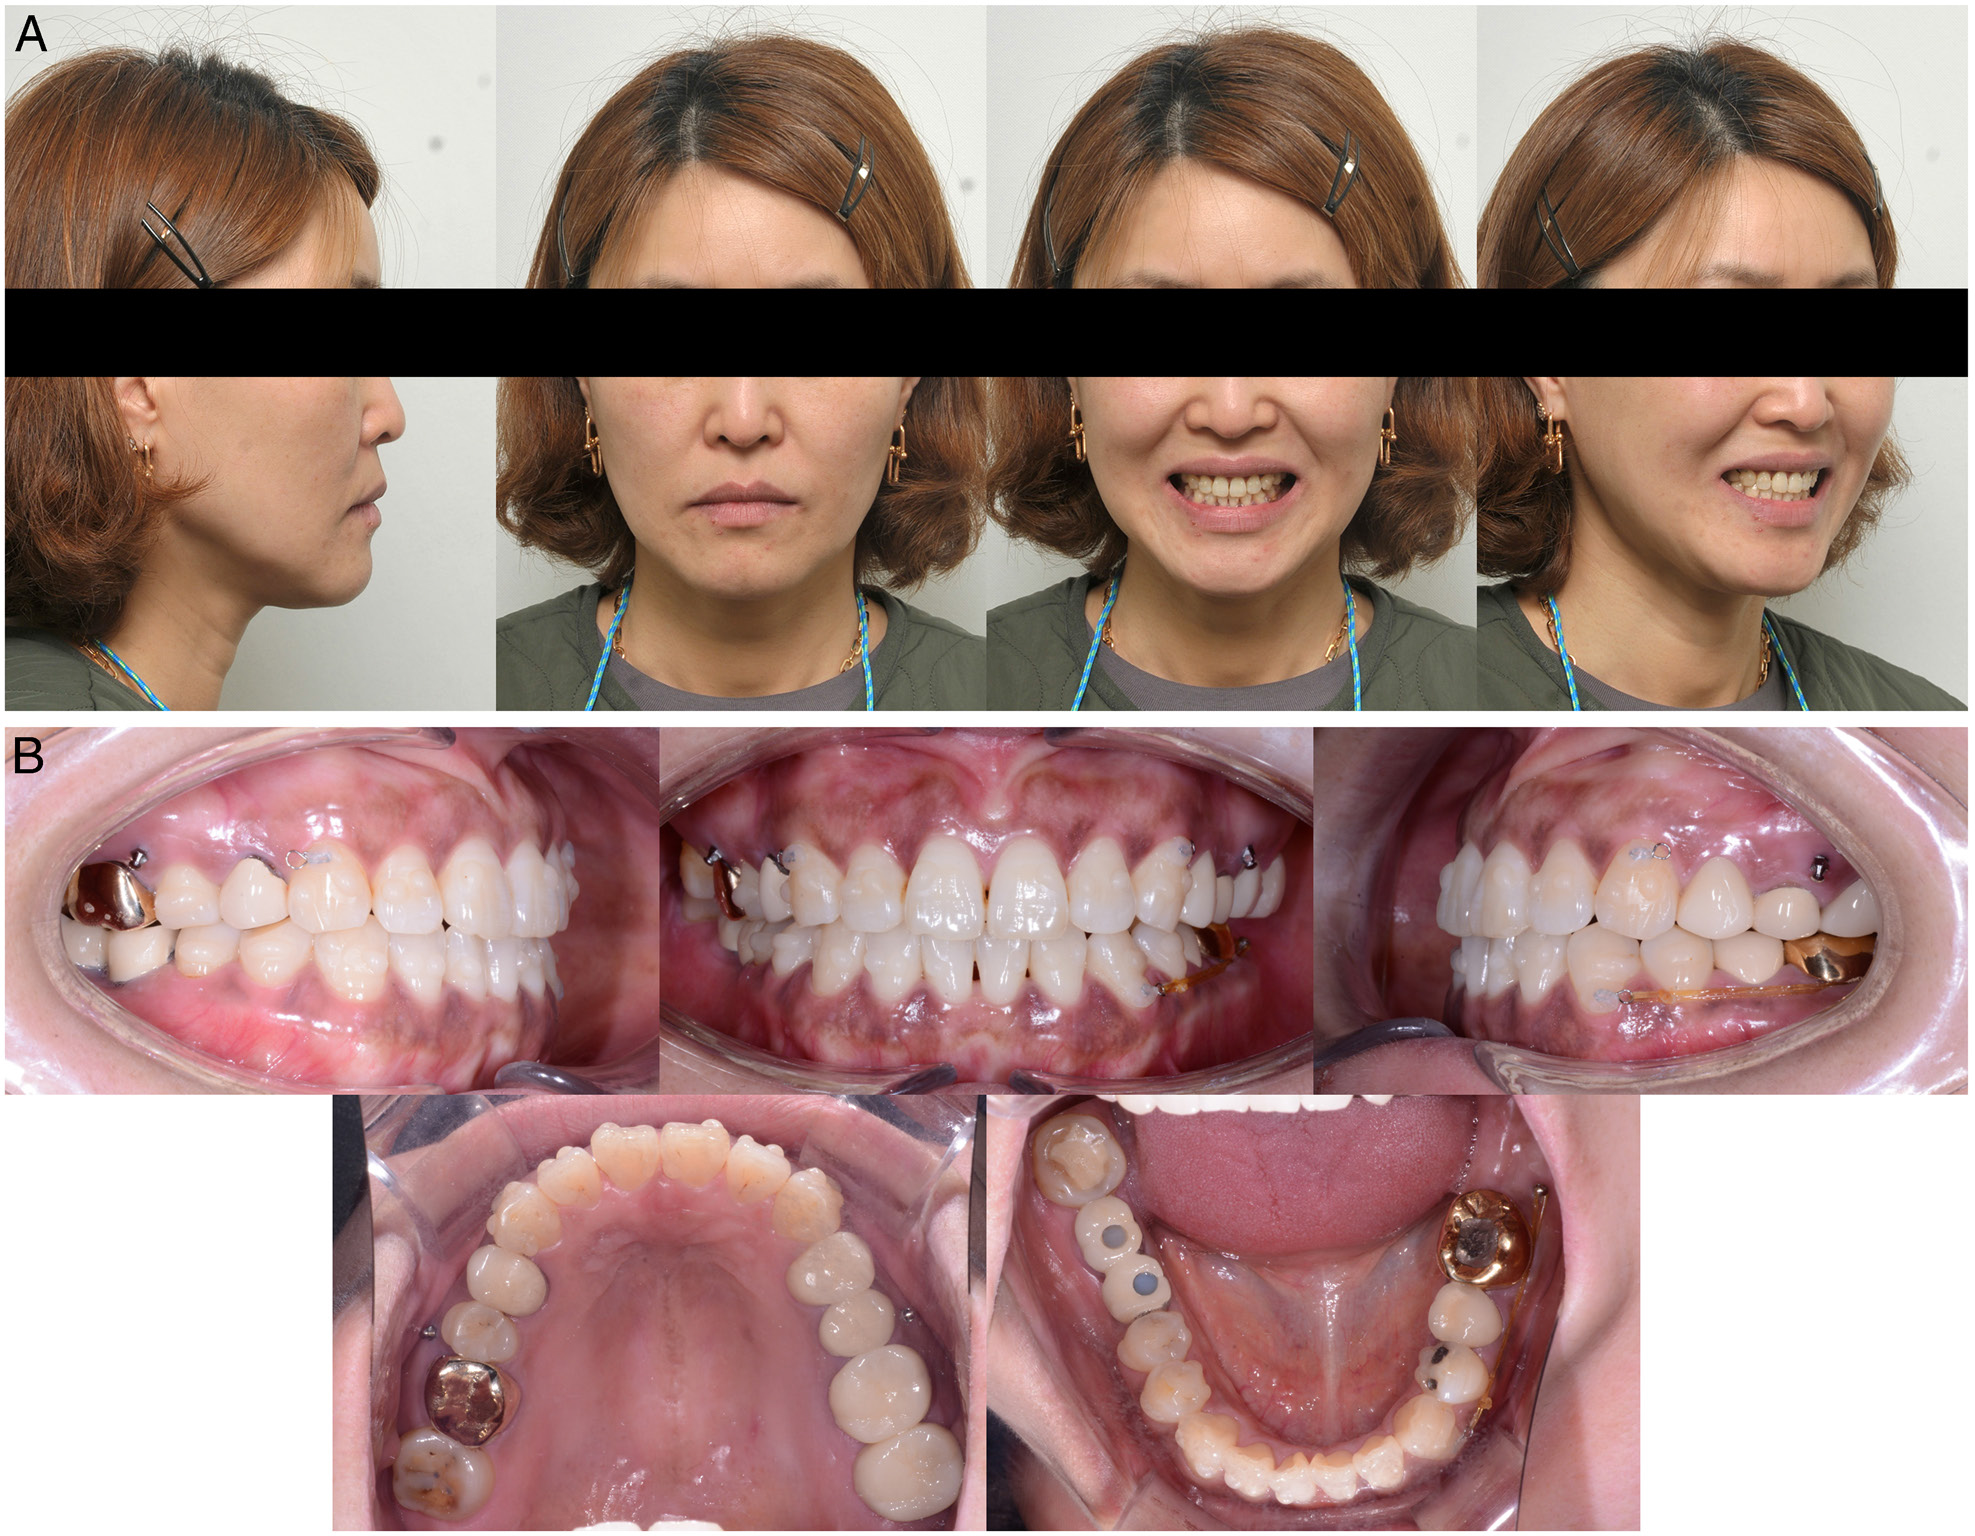
Figure 6.
Mid-treatment photographic records at 5 months. A. Intraoral views. B. Extraoral views.
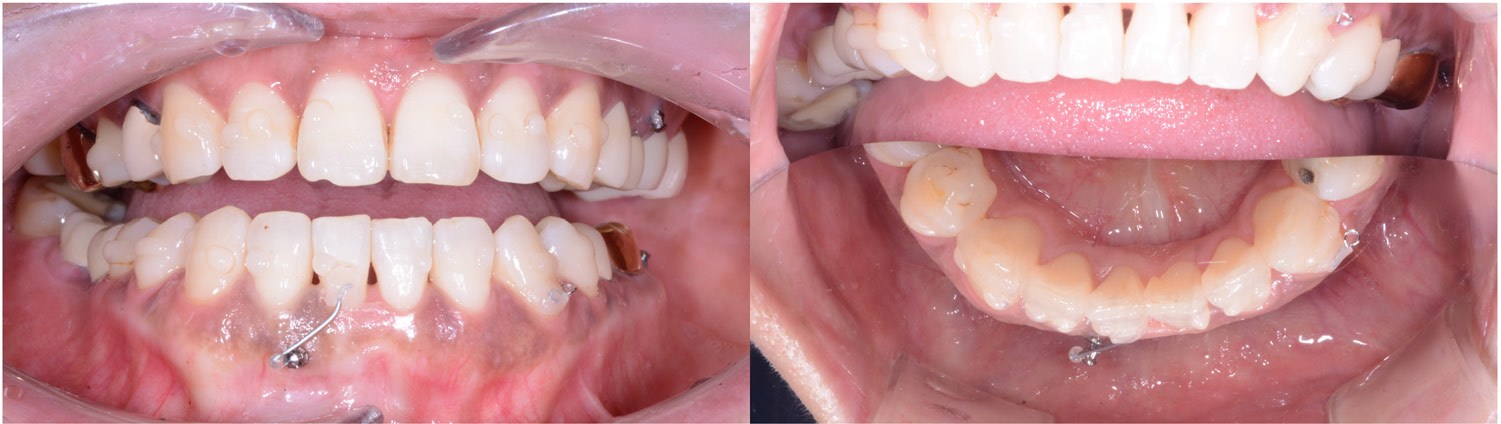
Figure 7.
Micro-implant uprighting cantilever used for root control of the mandibular right central incisor.
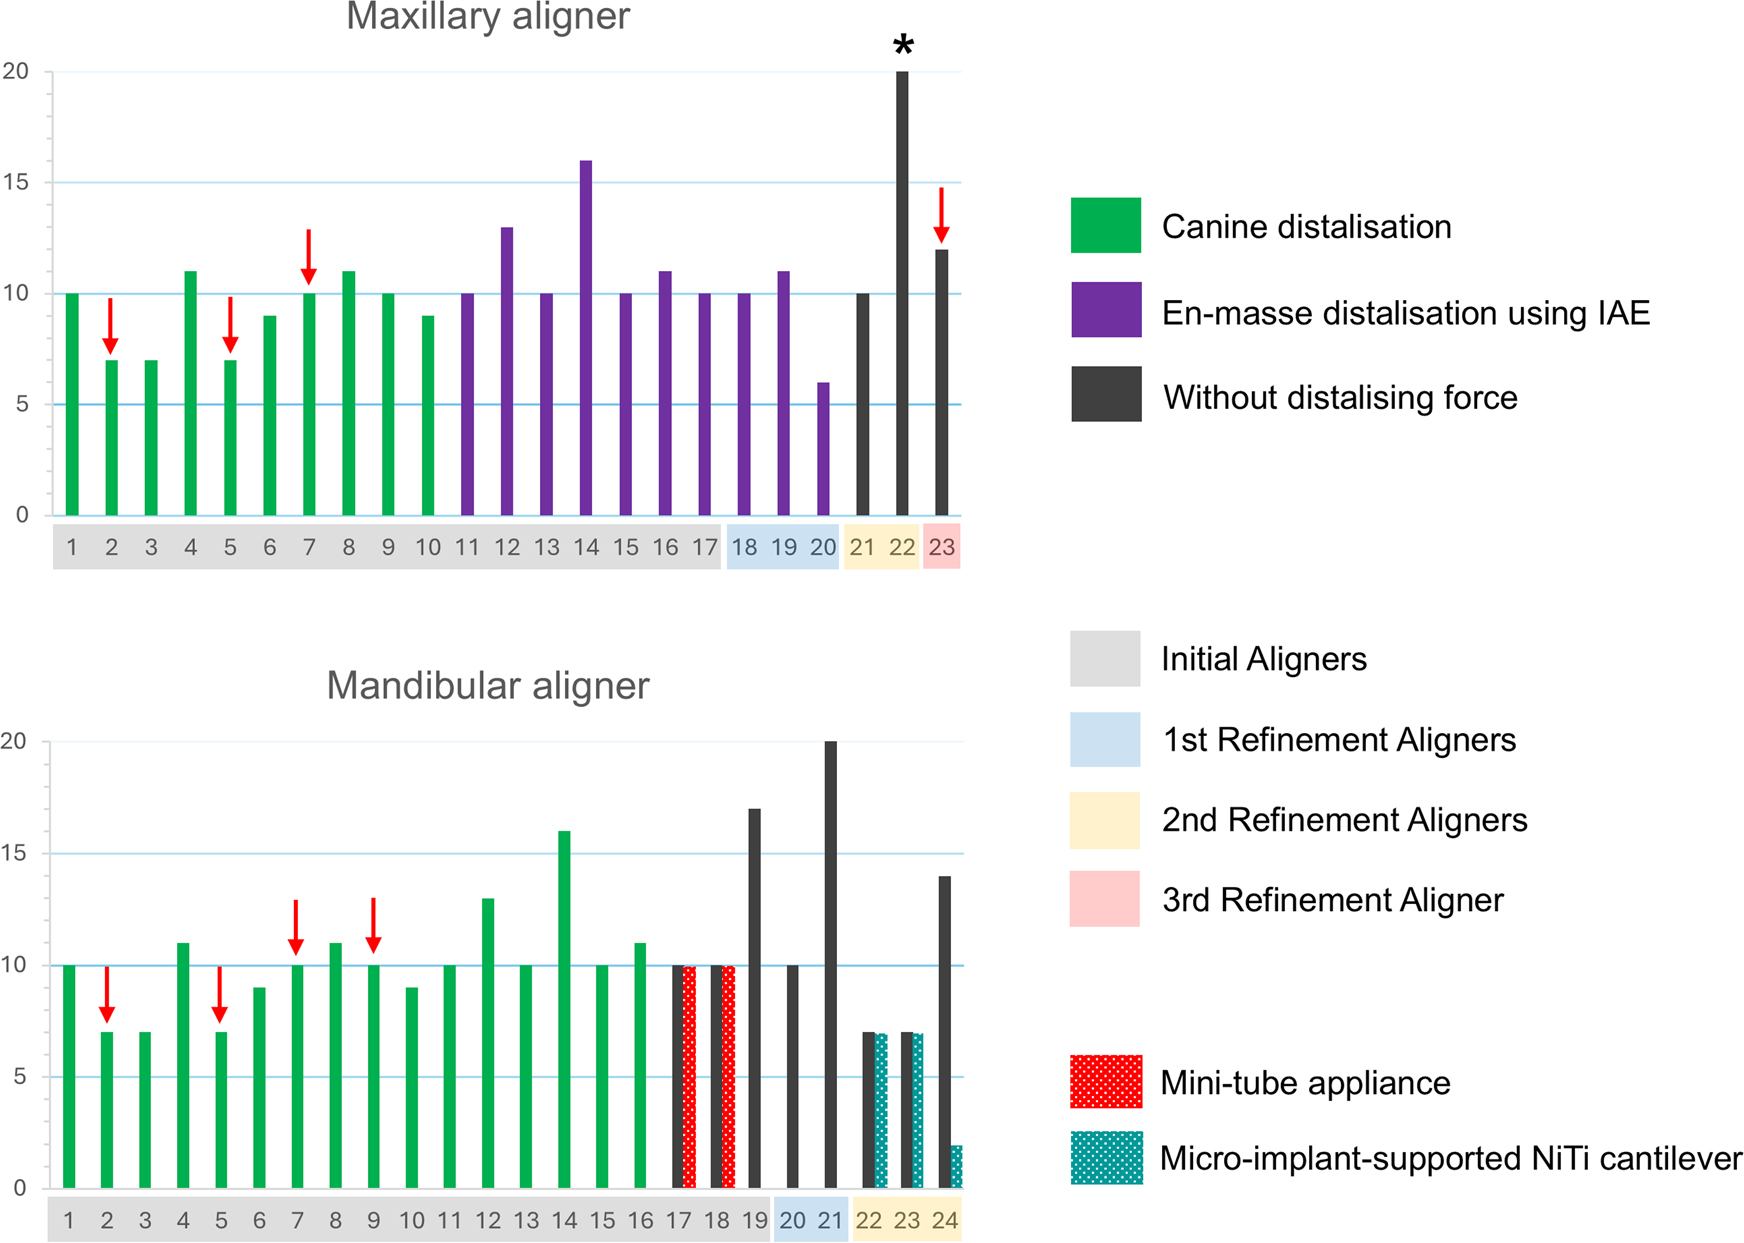
Figure 8.
Timeline of treatment progress. The horizontal axis represents the aligner stages; the vertical axis indicates the wear duration (in days). The asterisk (*) indicates an aligner worn as a provisional retainer (48 days); the red arrow indicates the timing of interproximal reduction; the green bar represents canine distalisation; the purple bar represents en-masse distalisation using the integrated aligner elastic technique; the black bar indicates phases without a distalising force.
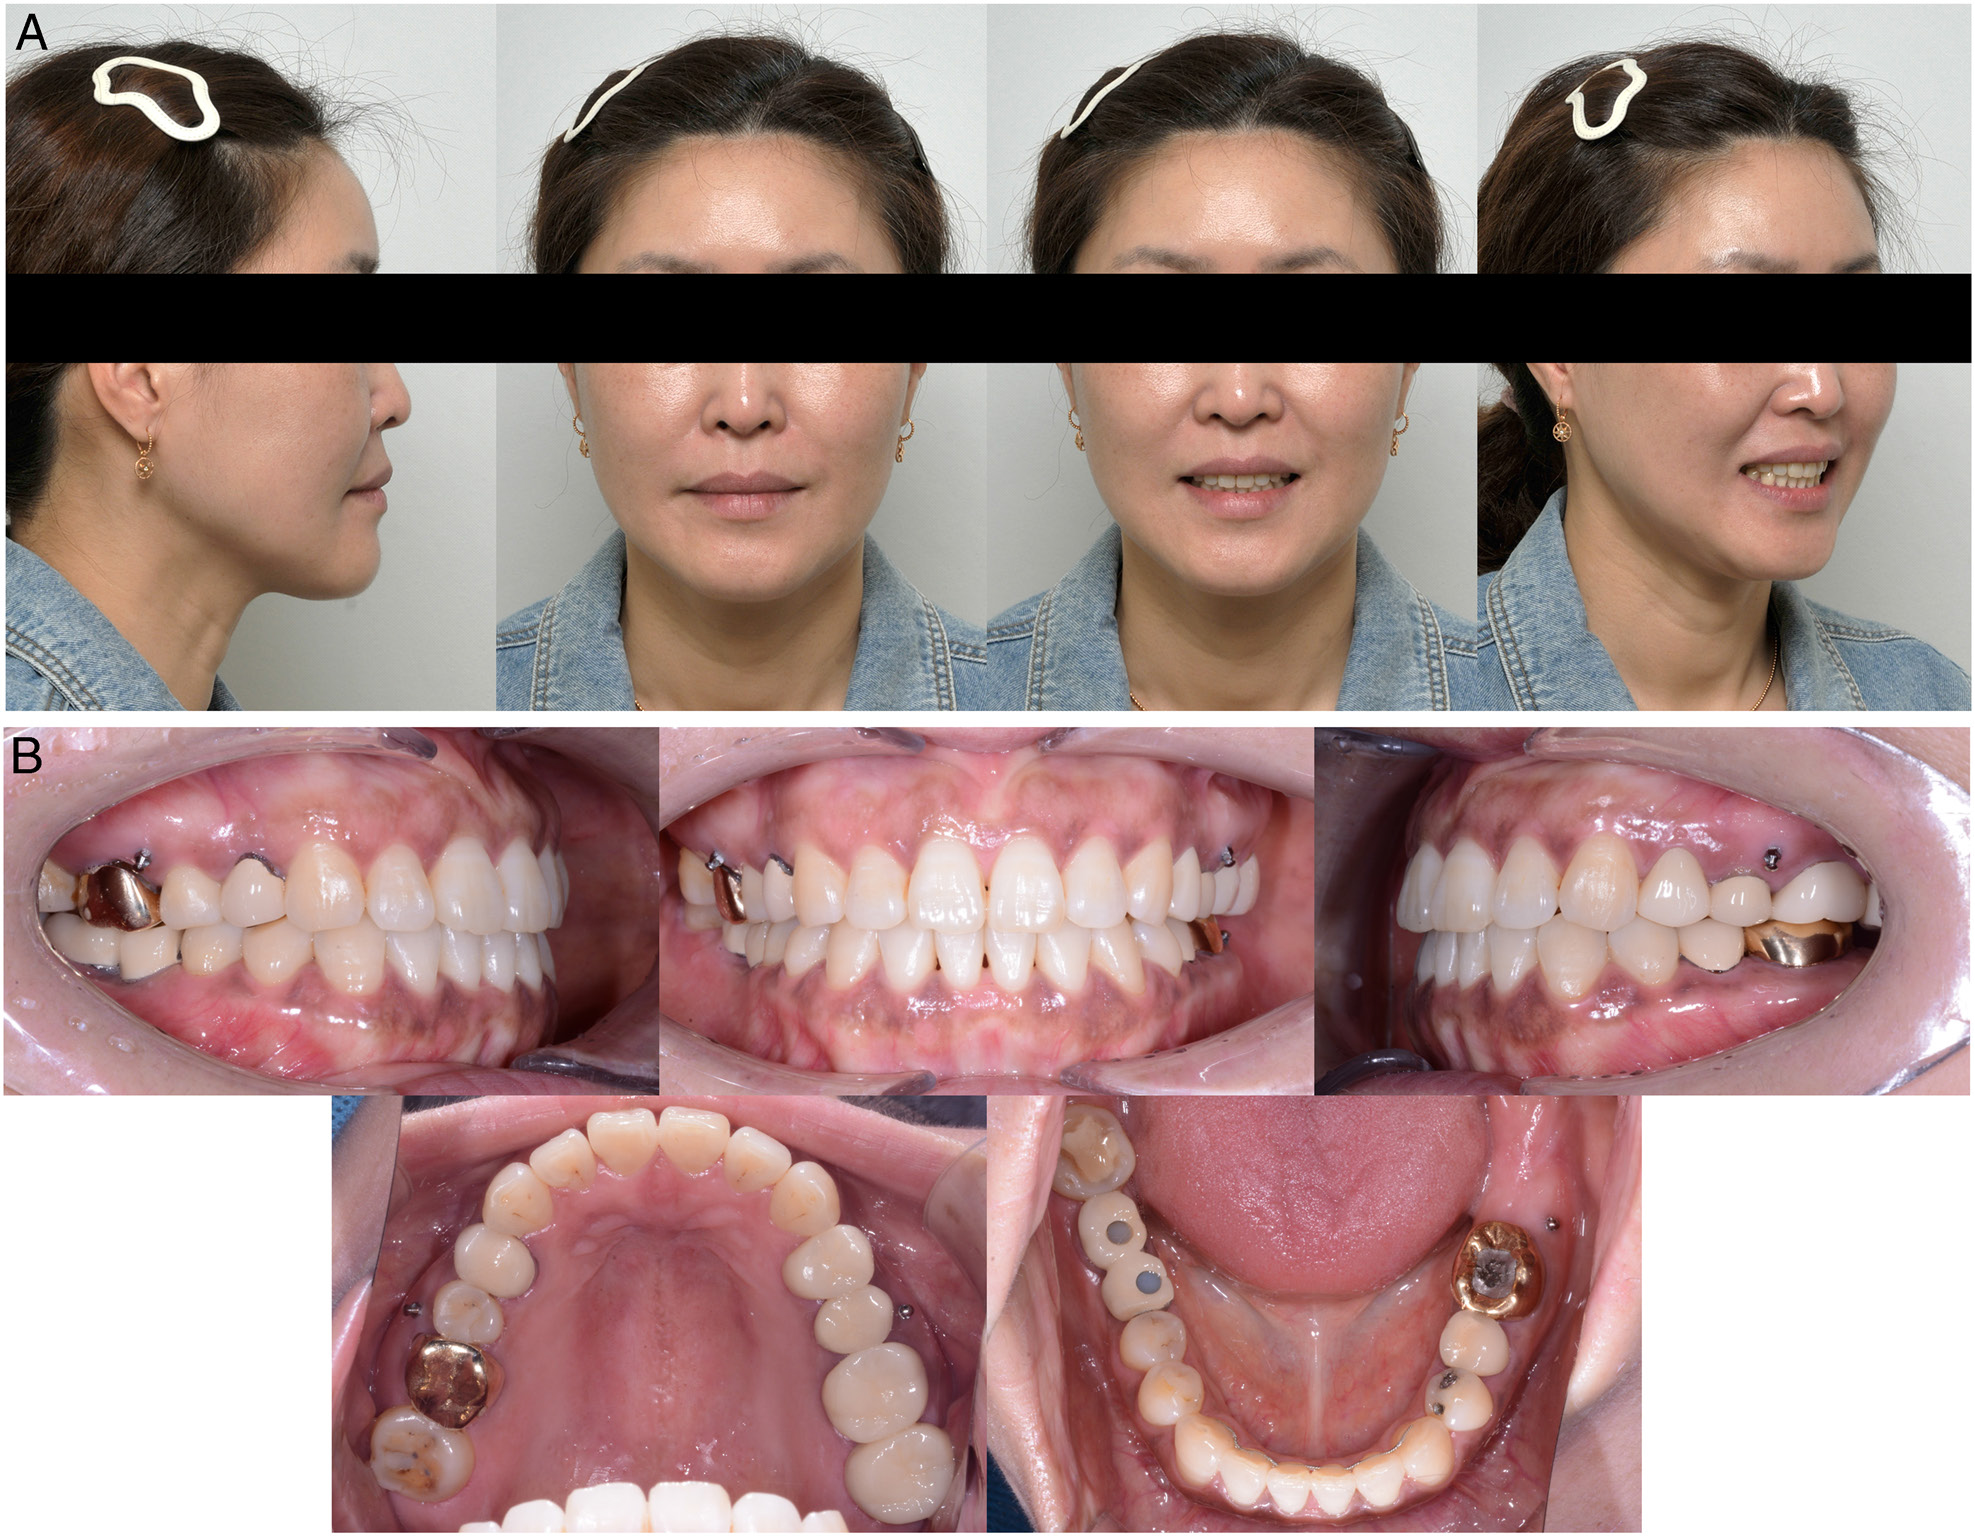
Figure 9.
Post-treatment photographic records. A. Intraoral views. B. Extraoral views.
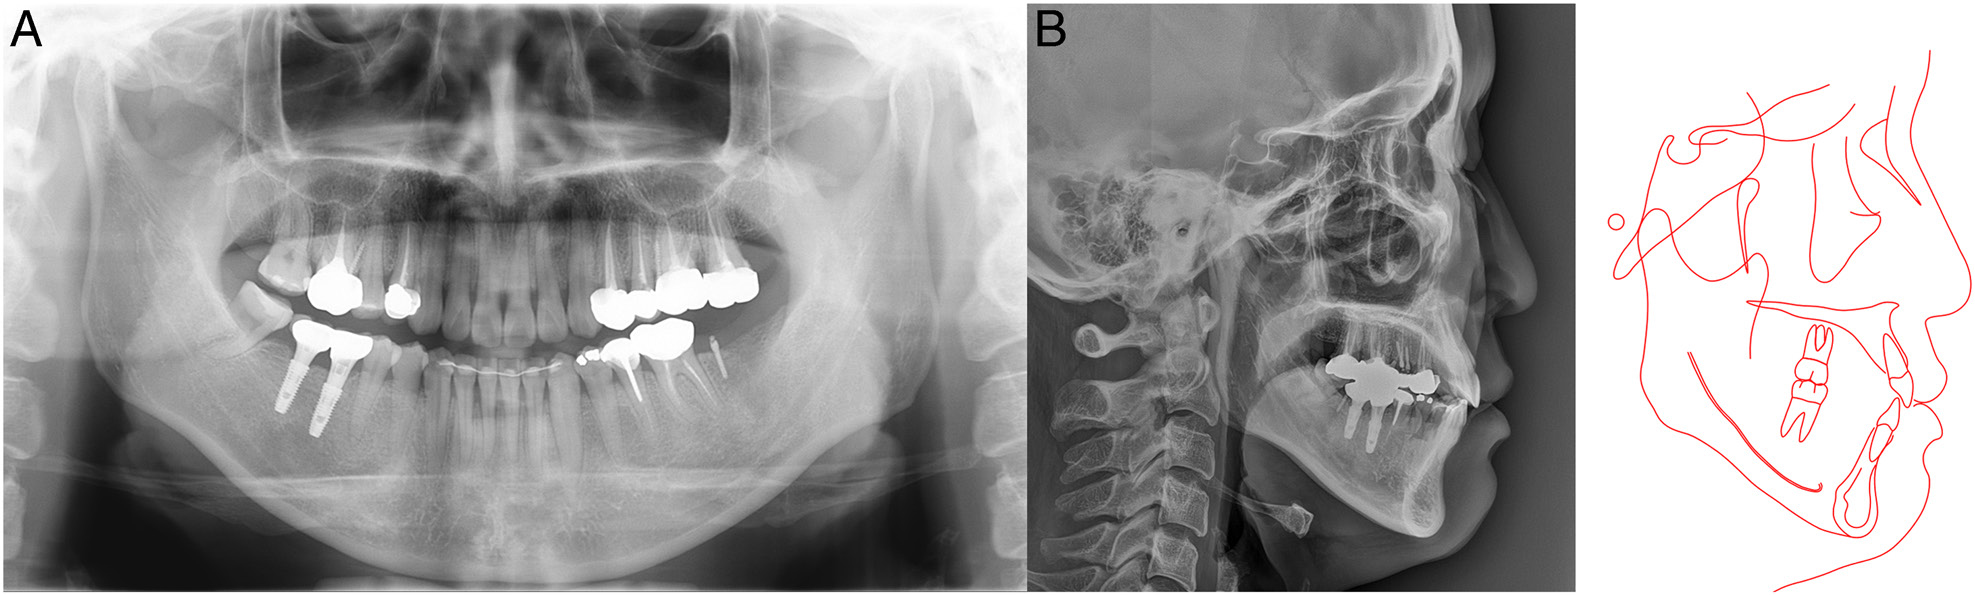
Figure 10.
Post-treatment radiographic records. A. Panoramic radiograph. B. Lateral cephalogram with corresponding tracing.
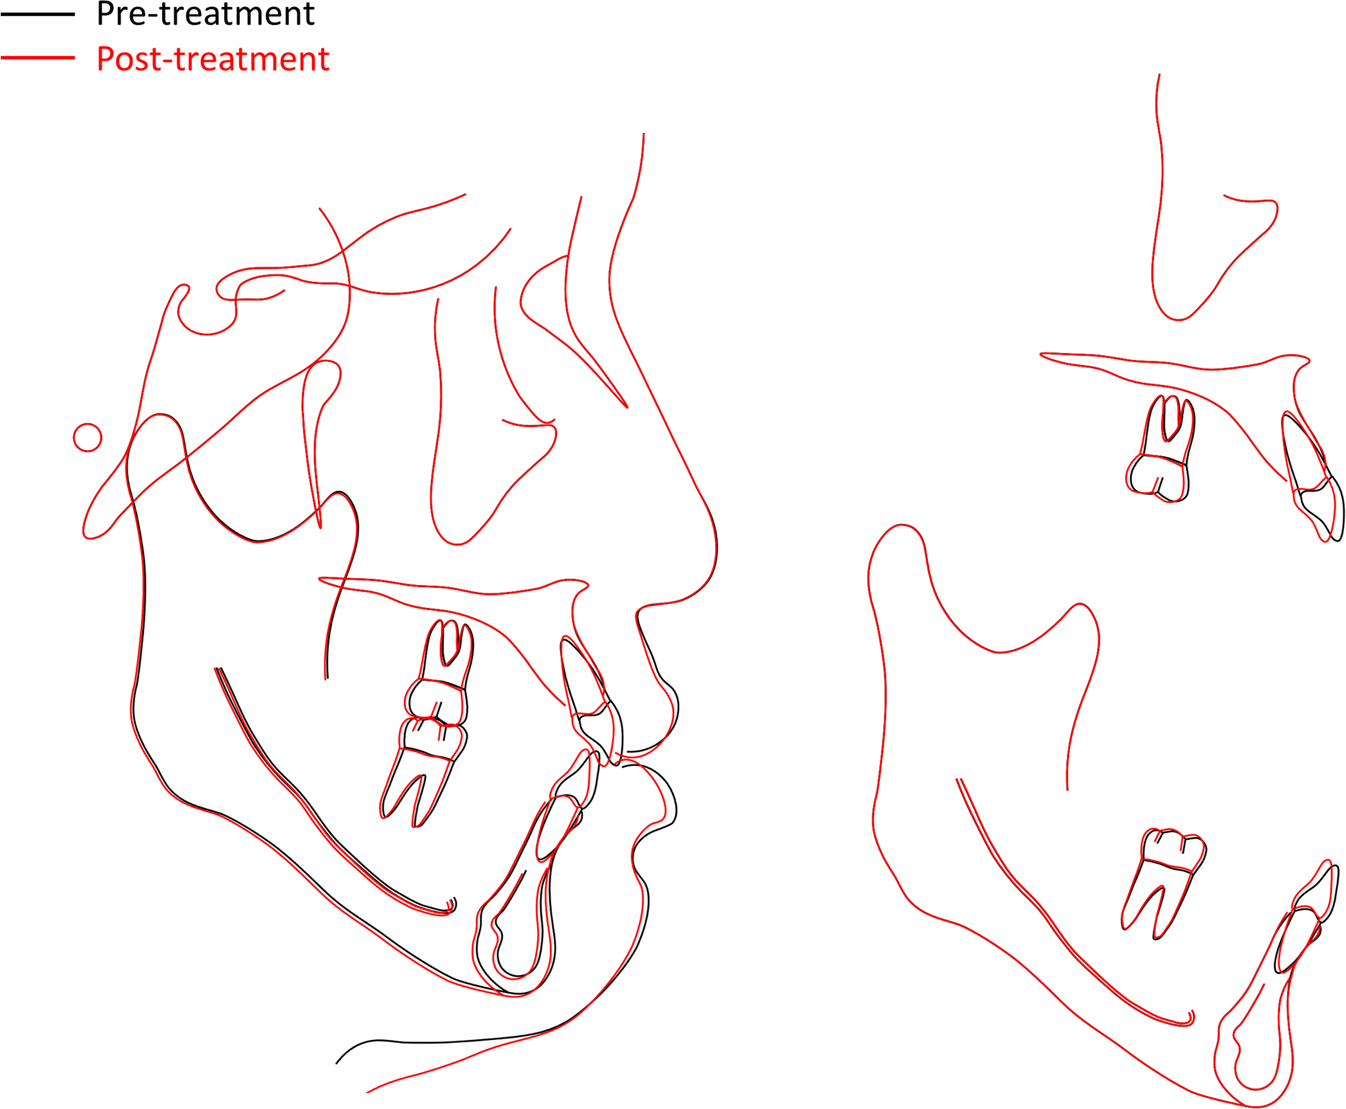
Figure 11.
Superimposition of pre- and post-treatment lateral cephalograms.
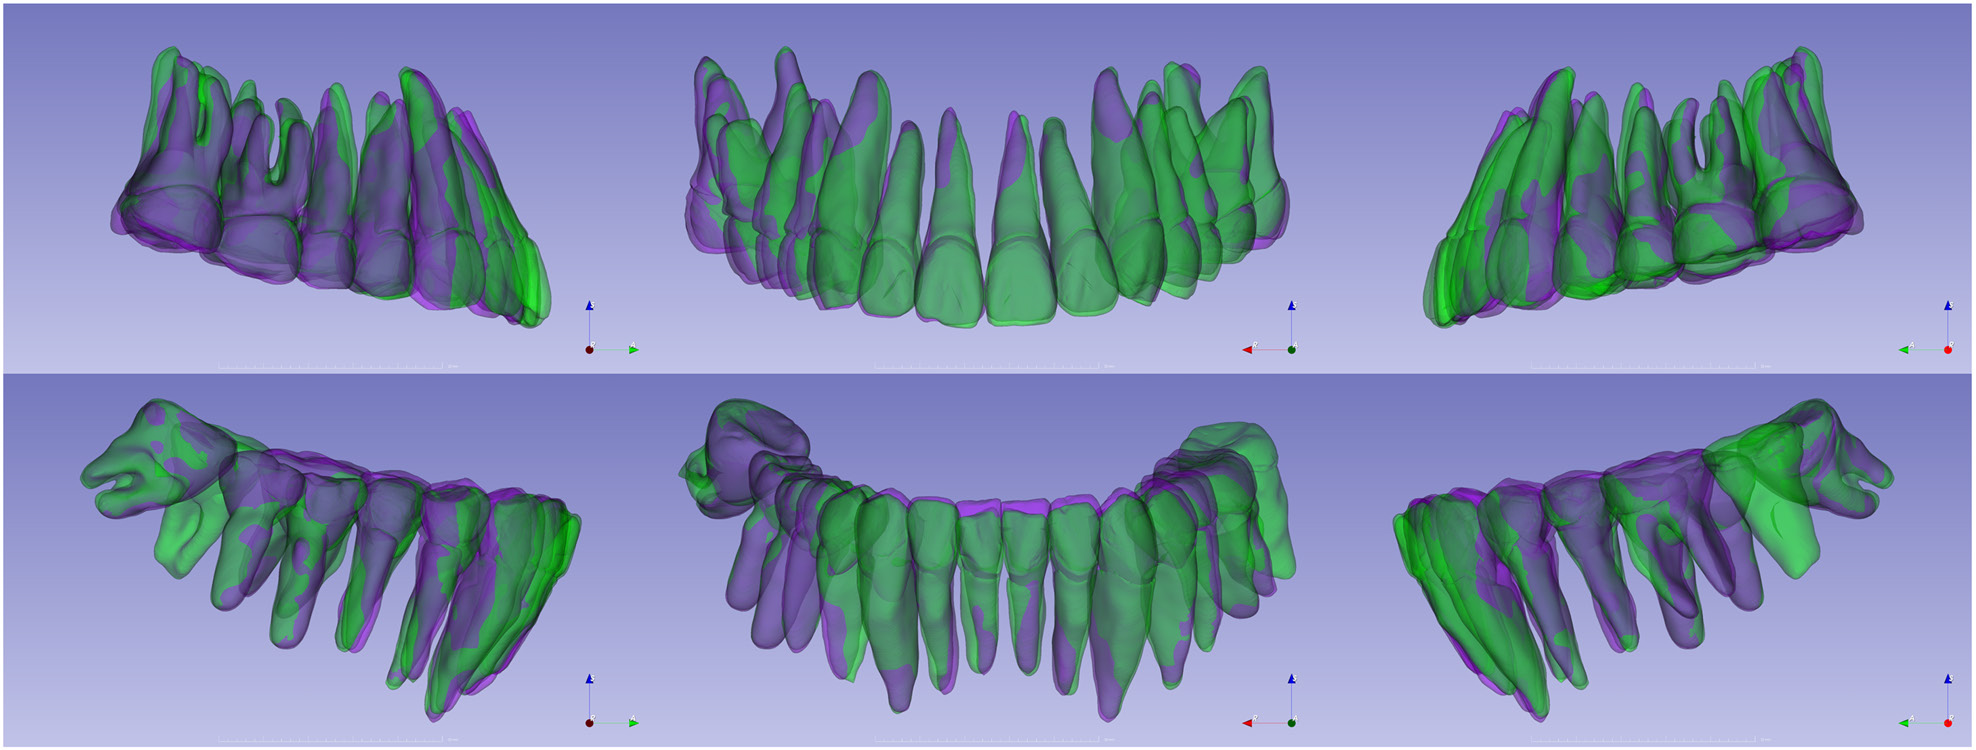
Figure 12.
Voxel-based superimposition of three-dimensional dental models before and after treatment. The maxillary dentition was superimposed on the cranial base; the mandibular dentition was superimposed on the mandibular symphysis. Green: pre-treatment; purple: post-treatment.
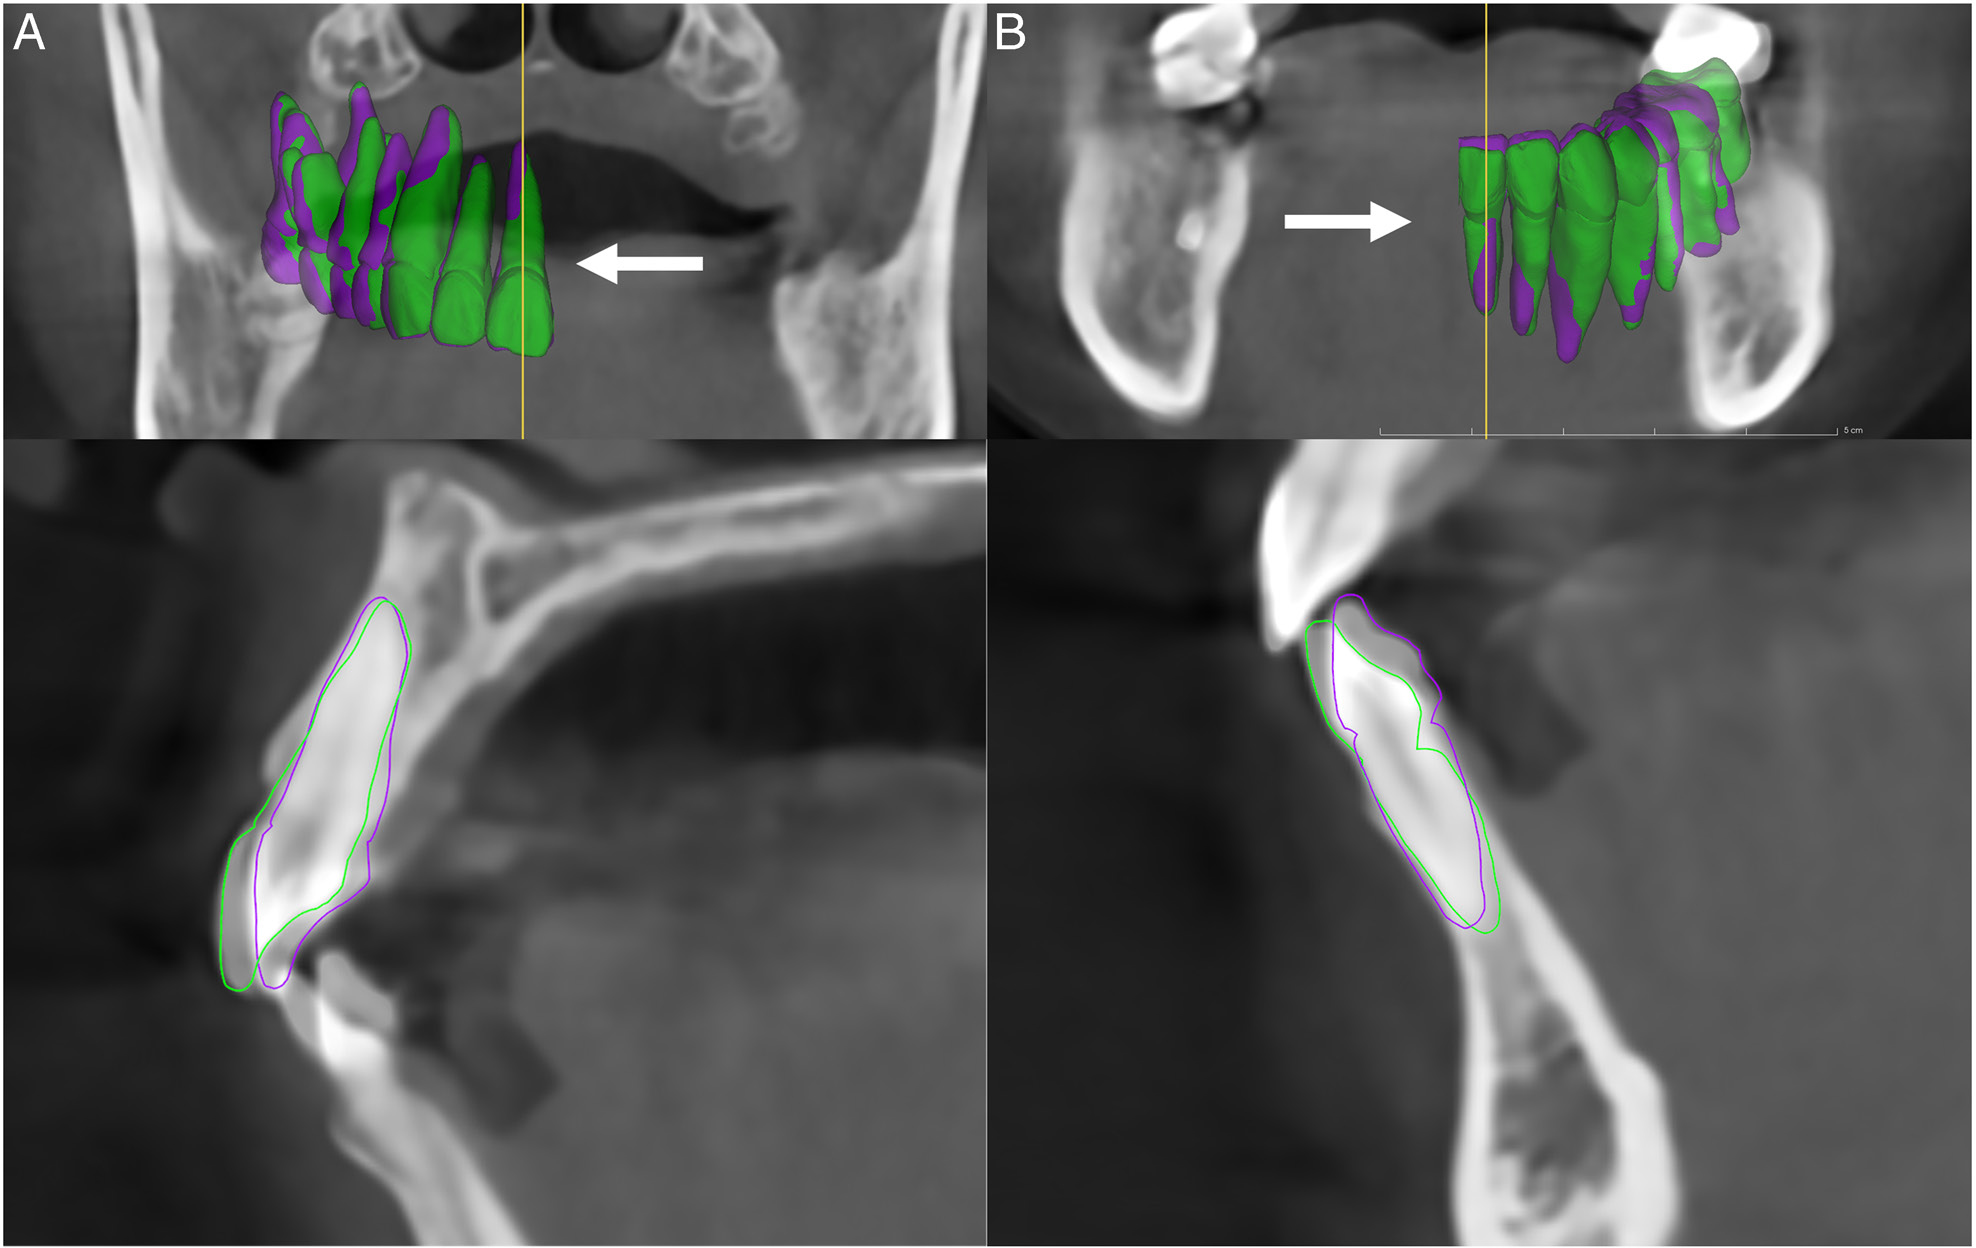
Figure 13.
Sagittal evaluation of the maxillary and mandibular central incisors. Green: pre-treatment: purple: post-treatment. The sagittal slicing plane (yellow line) and viewing direction (white arrow) are shown. A. Maxillary right central incisor. B. Mandibular left central incisor.
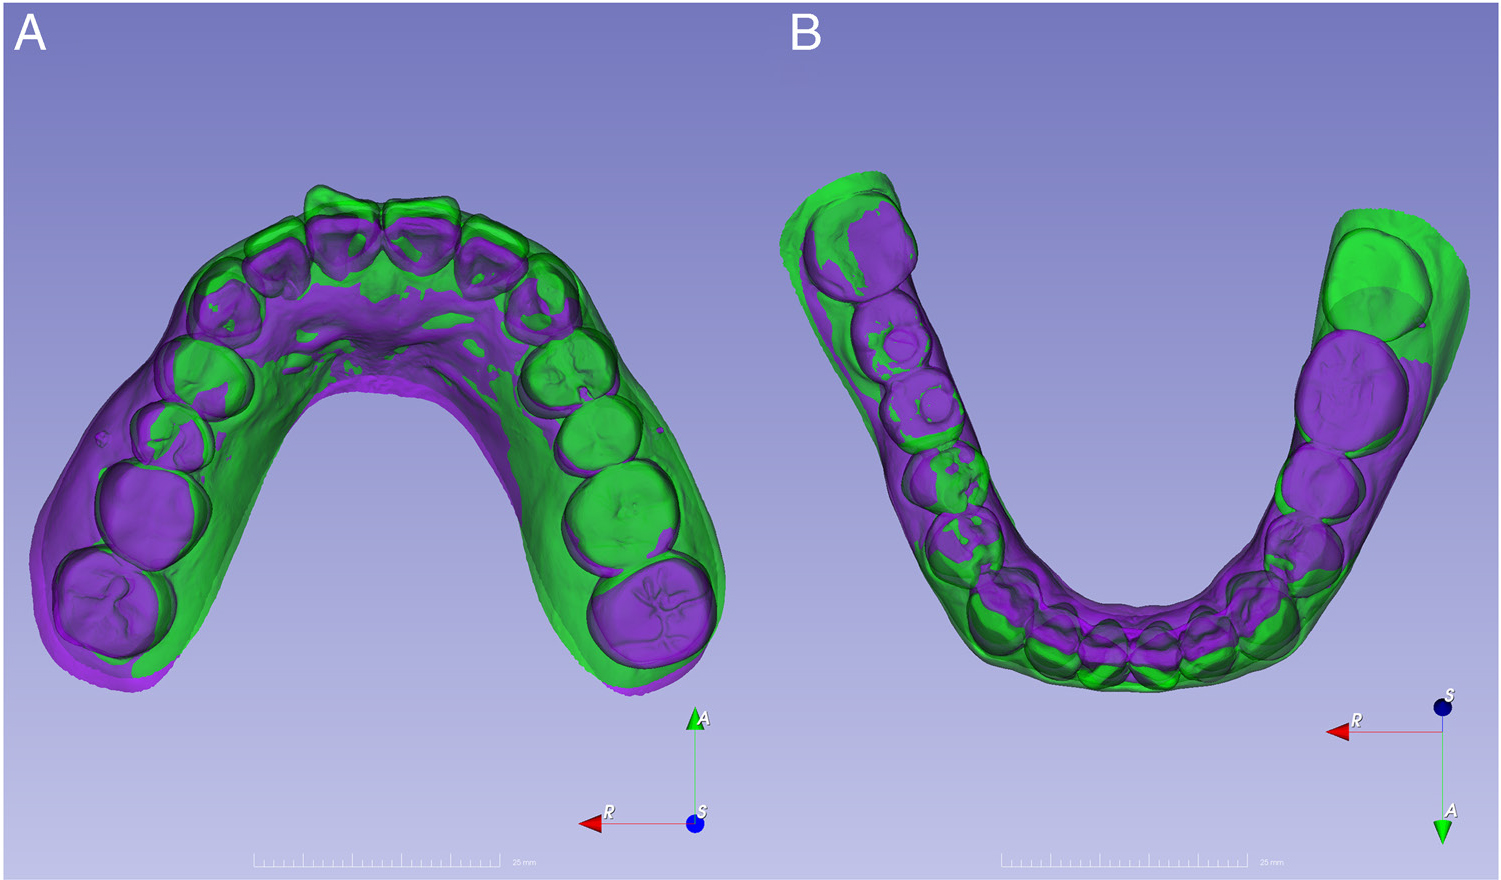
Figure 14.
Horizontal plane evaluation of the maxillary and mandibular arches using voxel-based superimposition. Green: pre-treatment; purple: post-treatment.
Table II.
Evaluation of tooth movements
| #17 | #15 | #13 | #11 | #21 | #23 | #25 | #27 | #45 | #43 | #41 | #31 | #33 | #35 | #36 | |
|---|---|---|---|---|---|---|---|---|---|---|---|---|---|---|---|
| On Sagittal Reference Plane | |||||||||||||||
| Z-axis Root | |||||||||||||||
| Direction of Movement | E | E | R | I | I | E | R | E | I | E | R | E | I | E | E |
| Z-axis Crown | |||||||||||||||
| Direction of Movement | E | E | R | R | I | I | I | E | E | E | E | E | E | E | E |
| Y-axis Crown | |||||||||||||||
| Type of Movement | T | N | T | T | T | T | T | N | T | T | T | T | T | T | T |
| Axial Change | –1.6 | 0.9 | 6 | 6.9 | 6.3 | 5.6 | –2.3 | 0.9 | 4.2 | 5.9 | 6.6 | 7.6 | 5.4 | 0.8 | 2.4 |
| Direction of Movement | P | P | P | P | P | P | P | P | P | P | P | P | P | P | P |
| Amount of Movement | 0.4 | 0.3 | 2.1 | 2.5 | 2.1 | 1.9 | 0.5 | 1.0 | 0.9 | 1.8 | 1.3 | 1.3 | 2.2 | 0.2 | 0.6 |
| On Horizontal Reference Plane | |||||||||||||||
| X-Y axis Crown | |||||||||||||||
| Amount of Movement | 0.9 | 0.9 | 2.2 | 2.5 | 2.1 | 1.9 | 0.6 | 1.0 | 1.4 | 1.9 | 1.3 | 1.3 | 2.3 | 1.1 | 0.4 |
| Lateral Deviation | 57 | 68.6 | 15.1 | 5.3 | 11.4 | 5.4 | 24.8 | 11.4 | 51.3 | 14.6 | 16.3 | 7.5 | 10.4 | 77.1 | 24.6 |
| Angle | |||||||||||||||
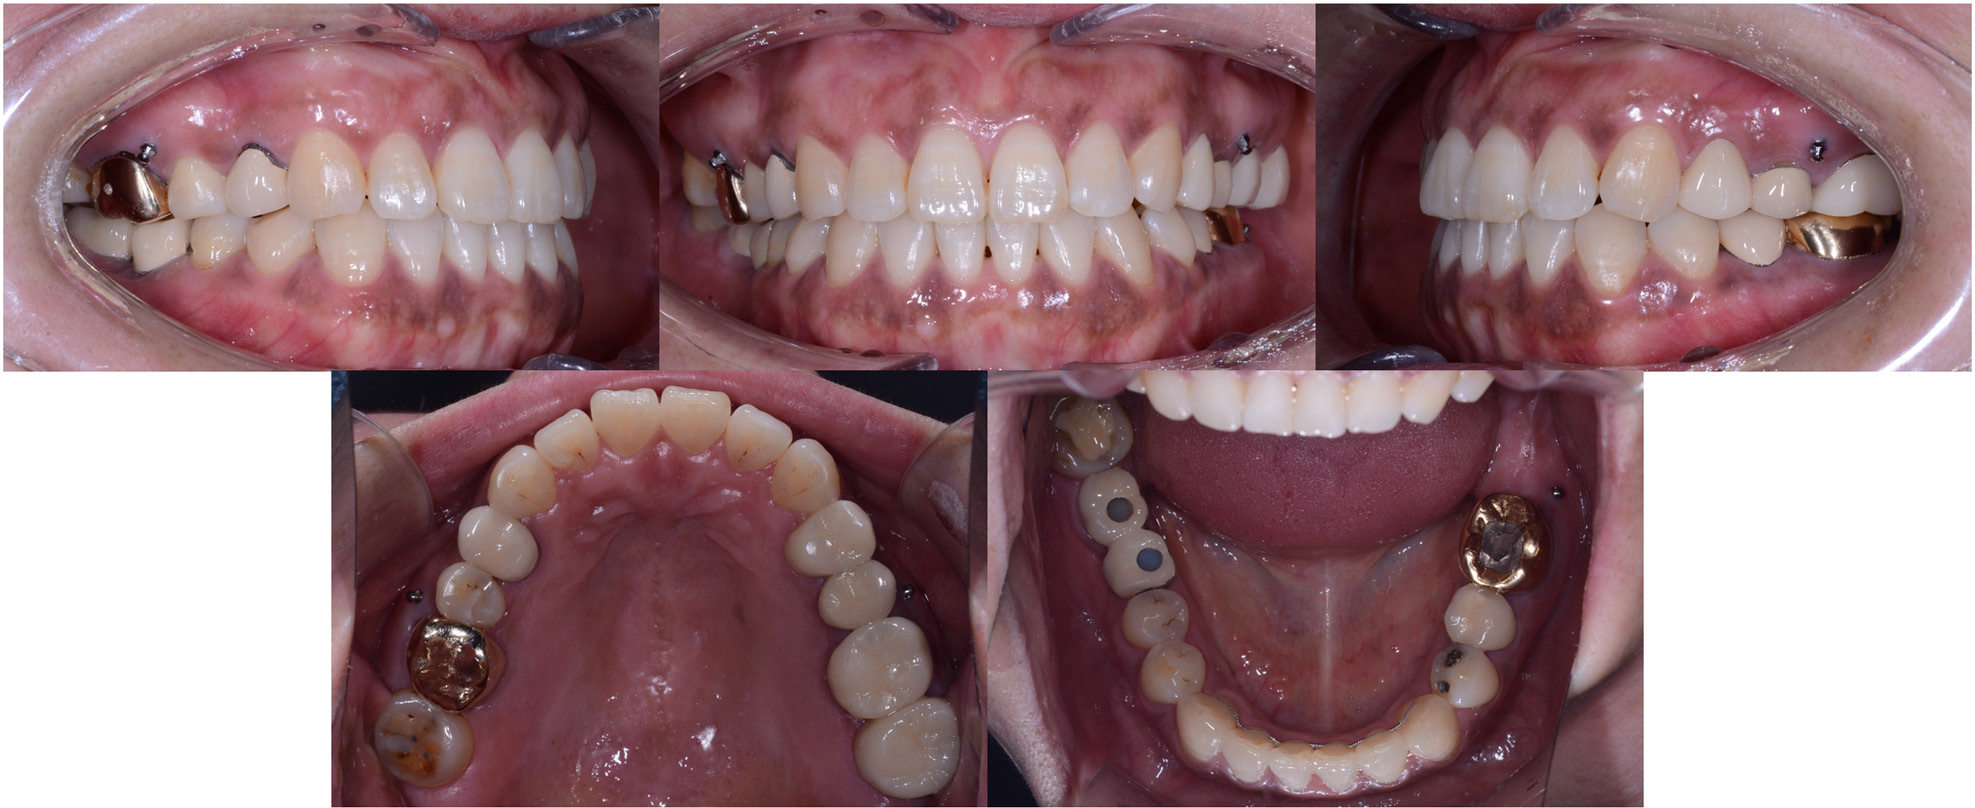
Figure 15.
Intraoral photographic records taken 6 months after the completion of active treatment during the retention phase.
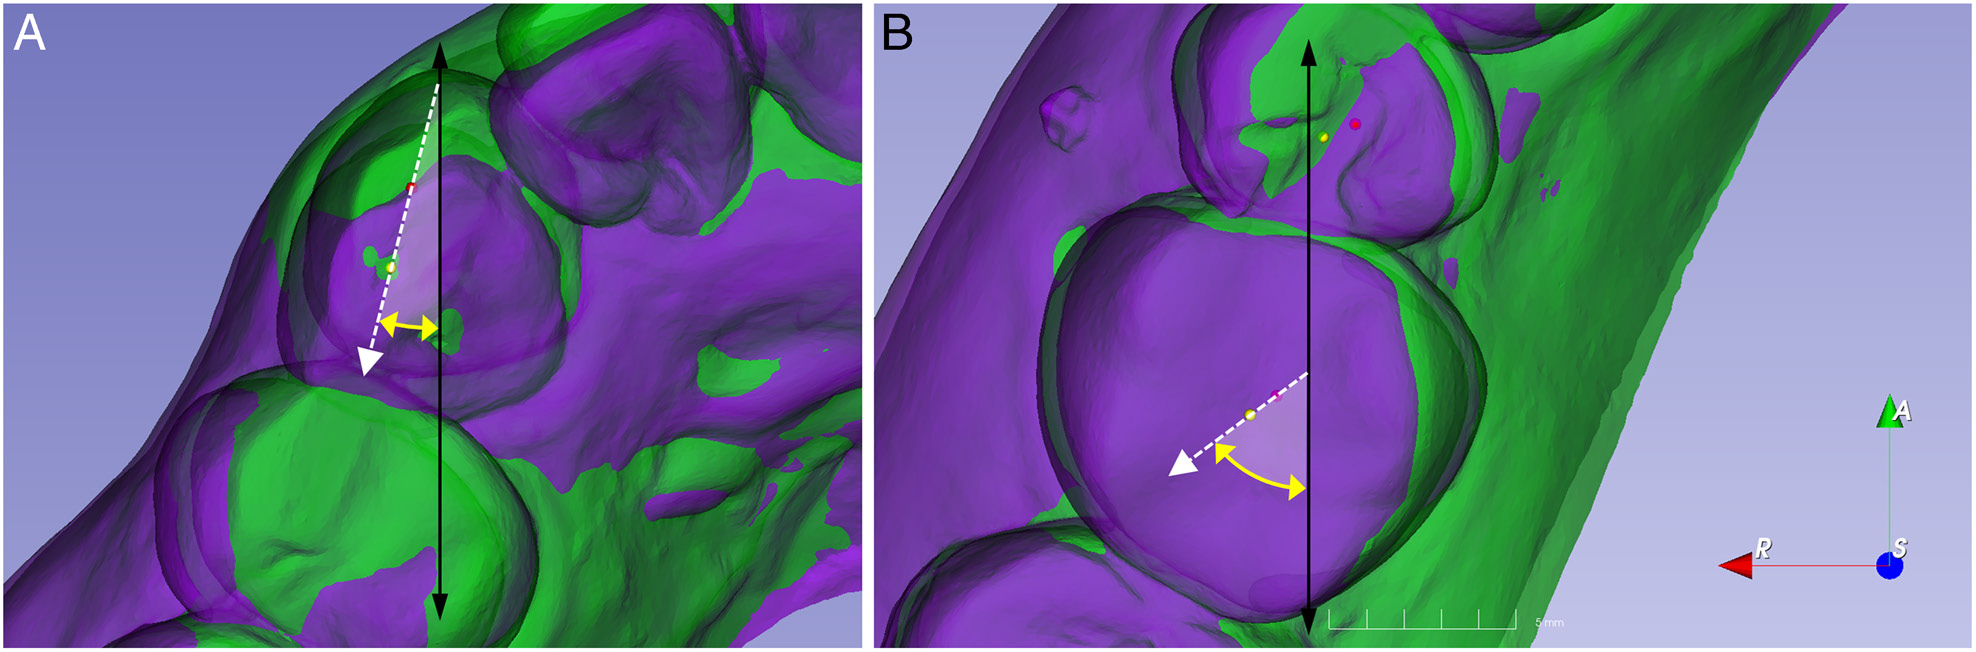
Figure 16.
Measurement of the lateral deviation angle (LDA) in the maxillary right canine (A) and first molar (B). LDA is defined as the angle between the tooth movement vector (dotted white arrow) and a reference line parallel to the midsagittal plane (double-headed vertical arrow). The measured angle is represented by the yellow arrow and white arc.