
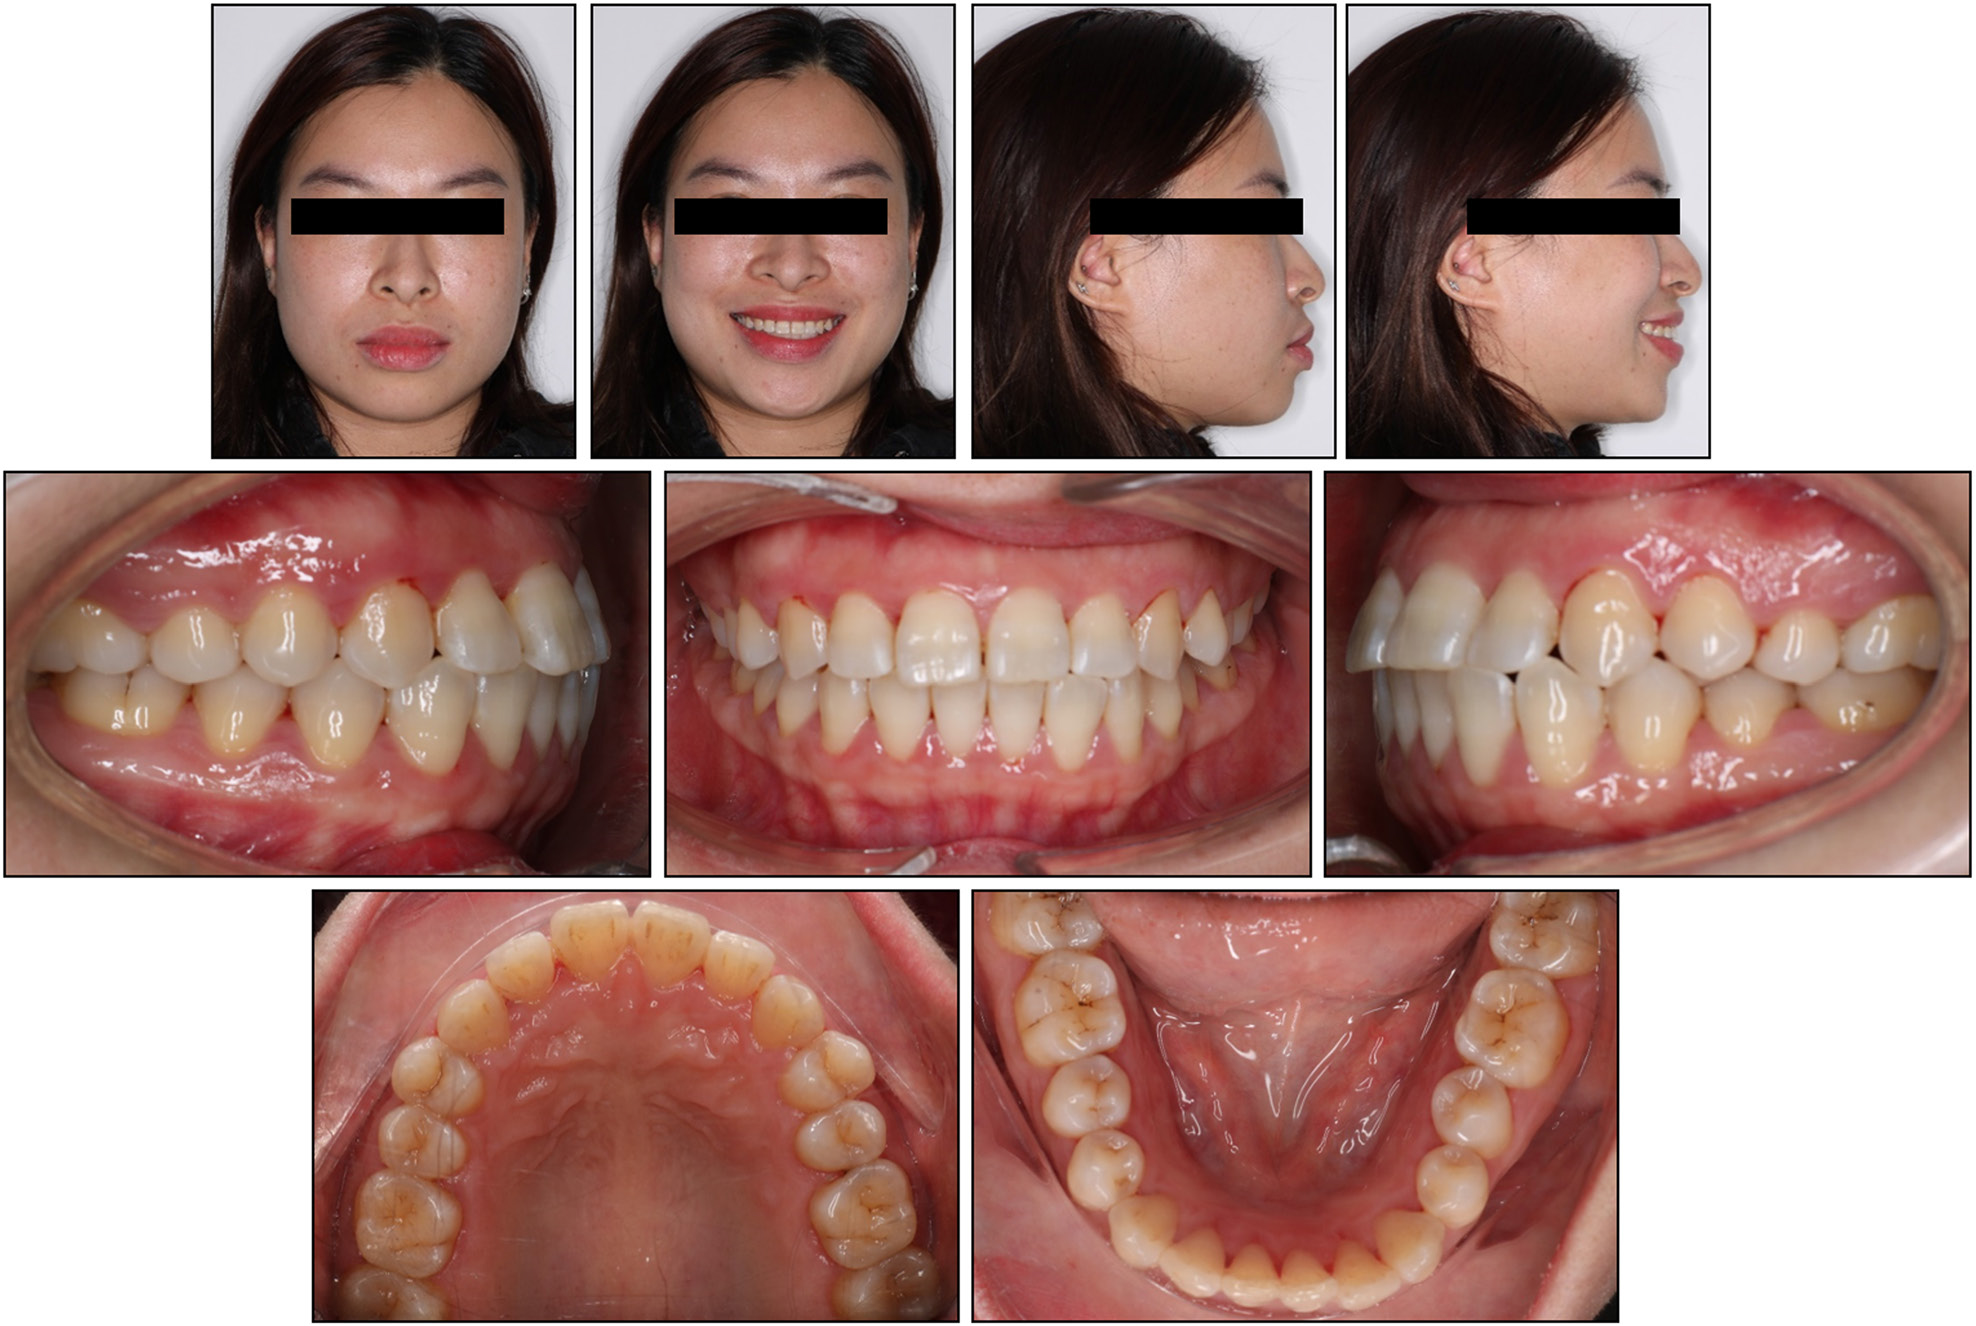
Figure 1.
Pre-treatment extraoral and intraoral photographs.
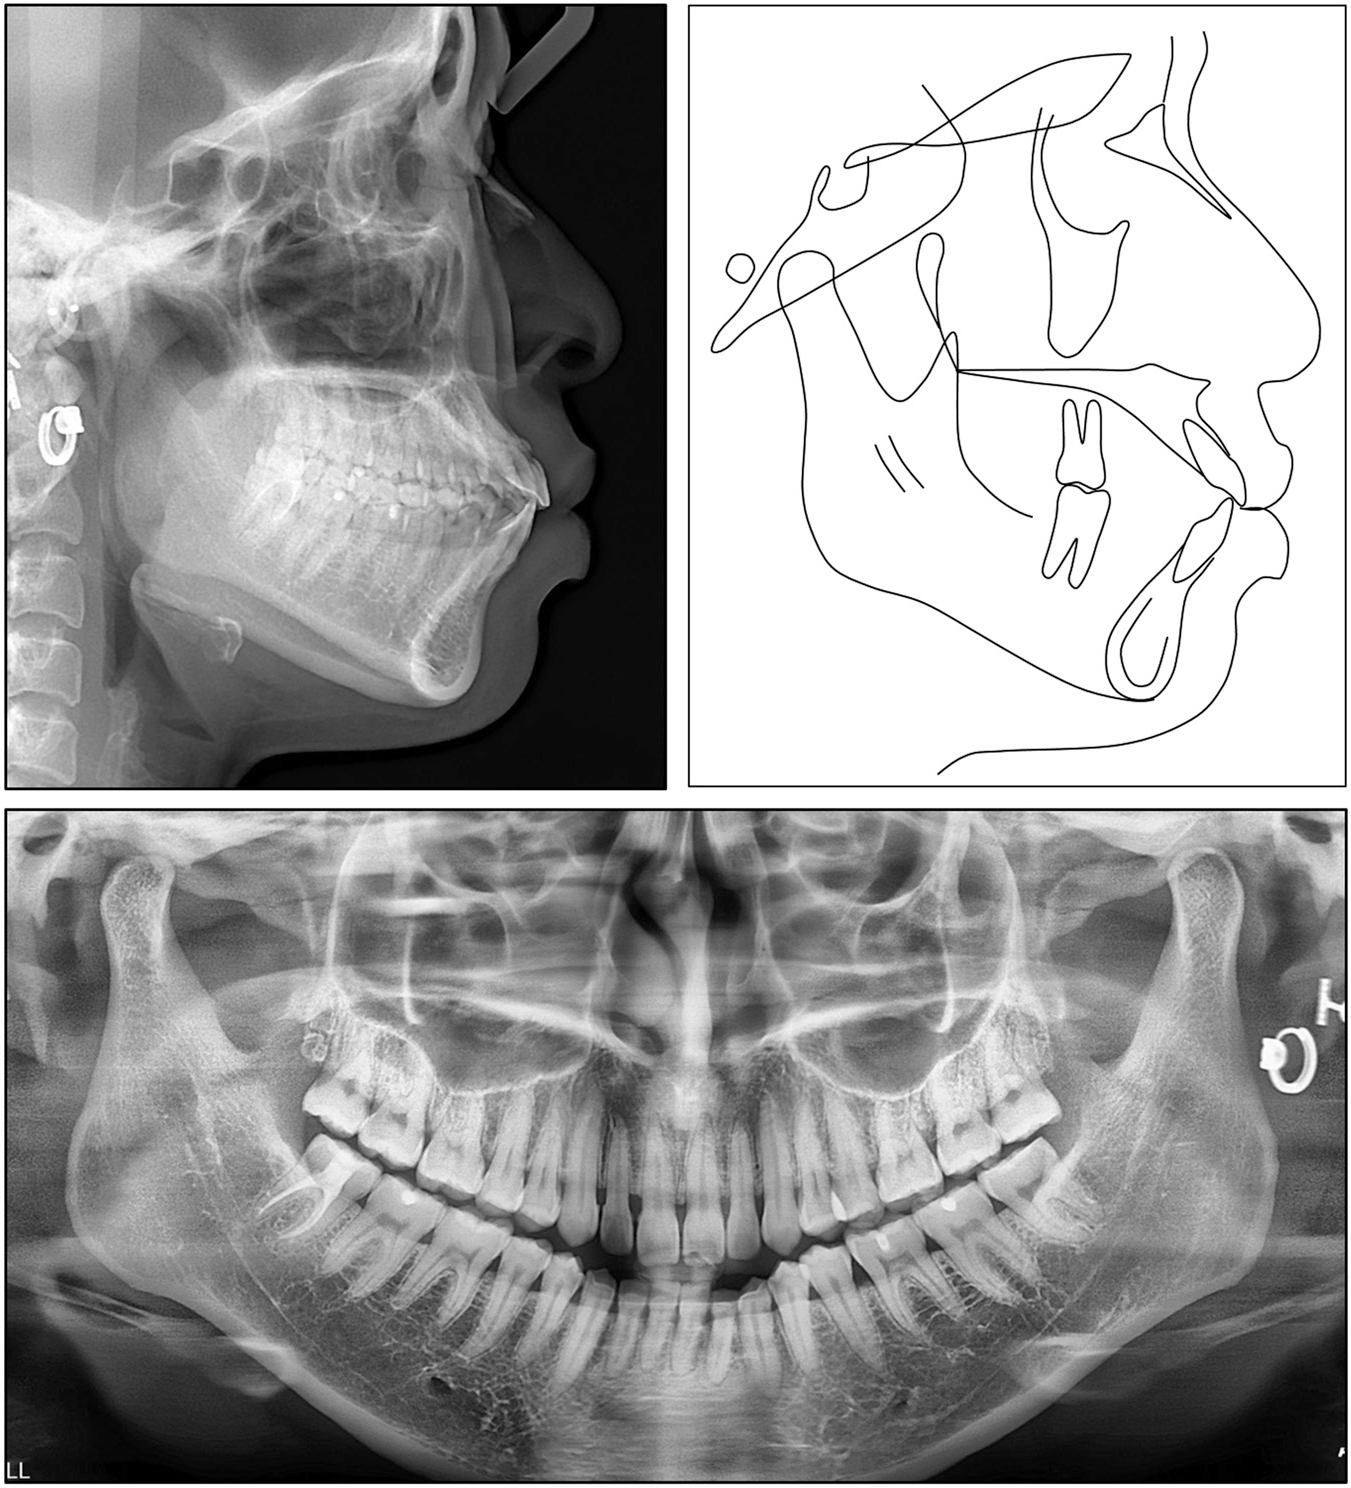
Figure 2.
Pre-treatment panoramic and cephalometric radiographs and tracing graphs.
Table I.
Cephalometric measurements
| Pretreatment | Posttreatment | |
|---|---|---|
| Skeletal | ||
| SNA (°) | 82.4 | 81.3 |
| SNB (°) | 78.6 | 78.7 |
| ANB (°) | 3.8 | 2.6 |
| FMA (°) | 26.3 | 25.7 |
| Dental | ||
| U1-SN (°) | 110.2 | 100.4 |
| U1-NA (°) | 27.8 | 18.9 |
| U1-NA (mm) | 9.8 | 2.8 |
| L1-MP (°) | 97.8 | 89.0 |
| L1-NB (°) | 34.8 | 24.2 |
| L1-NB (mm) | 9.8 | 4.2 |
| Interincisal angle (°) | 113.6 | 133.9 |
| Soft tissue | ||
| Upper lip/E-line (mm) | 2.2 | -0.8 |
| Lower lip/E-line (mm) | 4.8 | 0.8 |
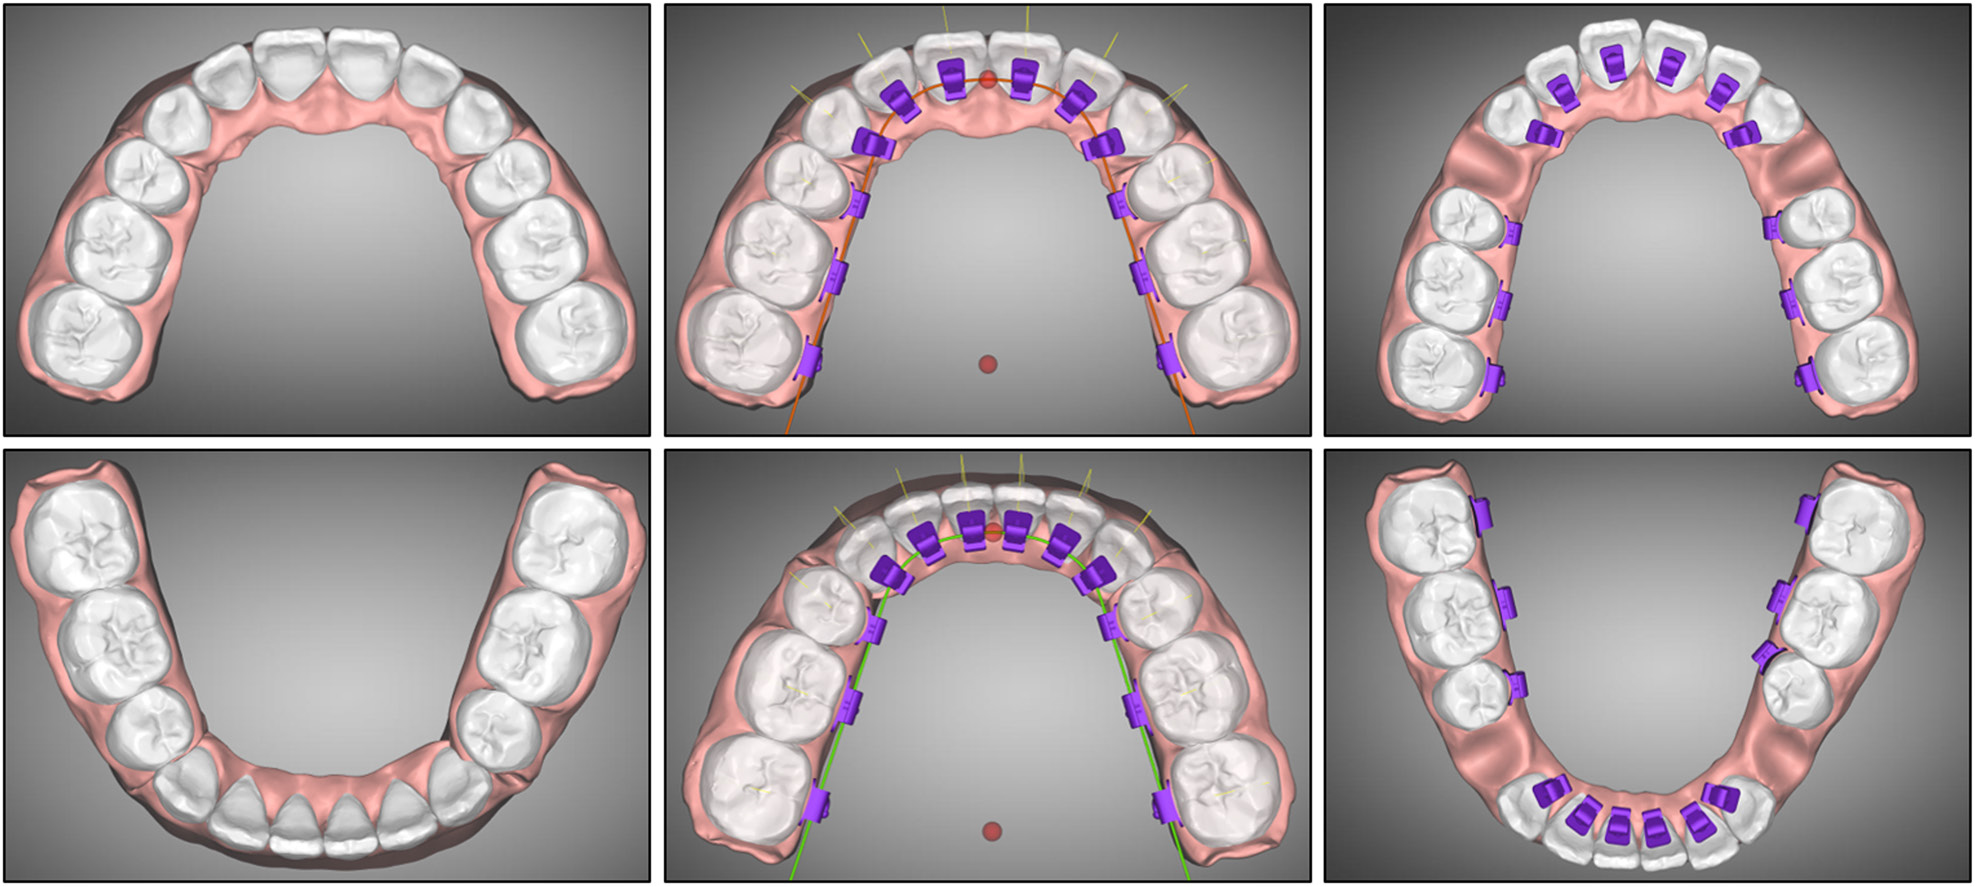
Figure 3.
Digital orthodontic setup and bracket placement.
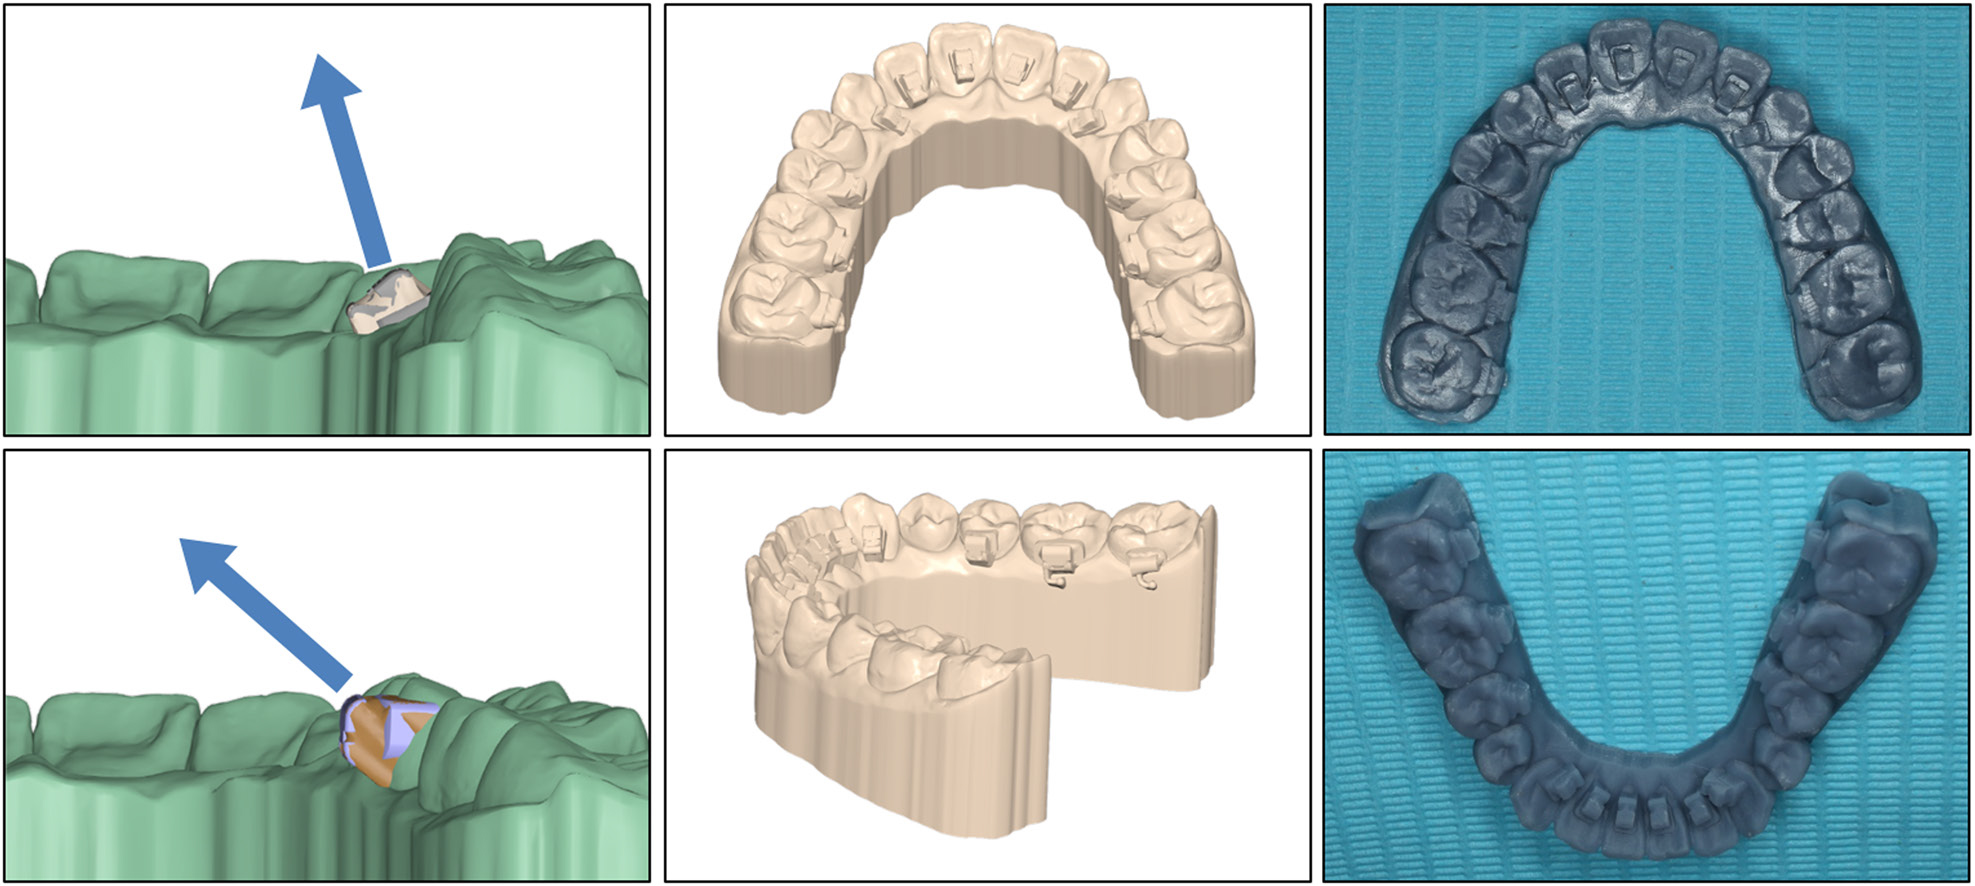
Figure 4.
Virtual blocking out of bracket undercuts to facilitate rigid tray removal and 3D printing of models with ideal bracket positions.
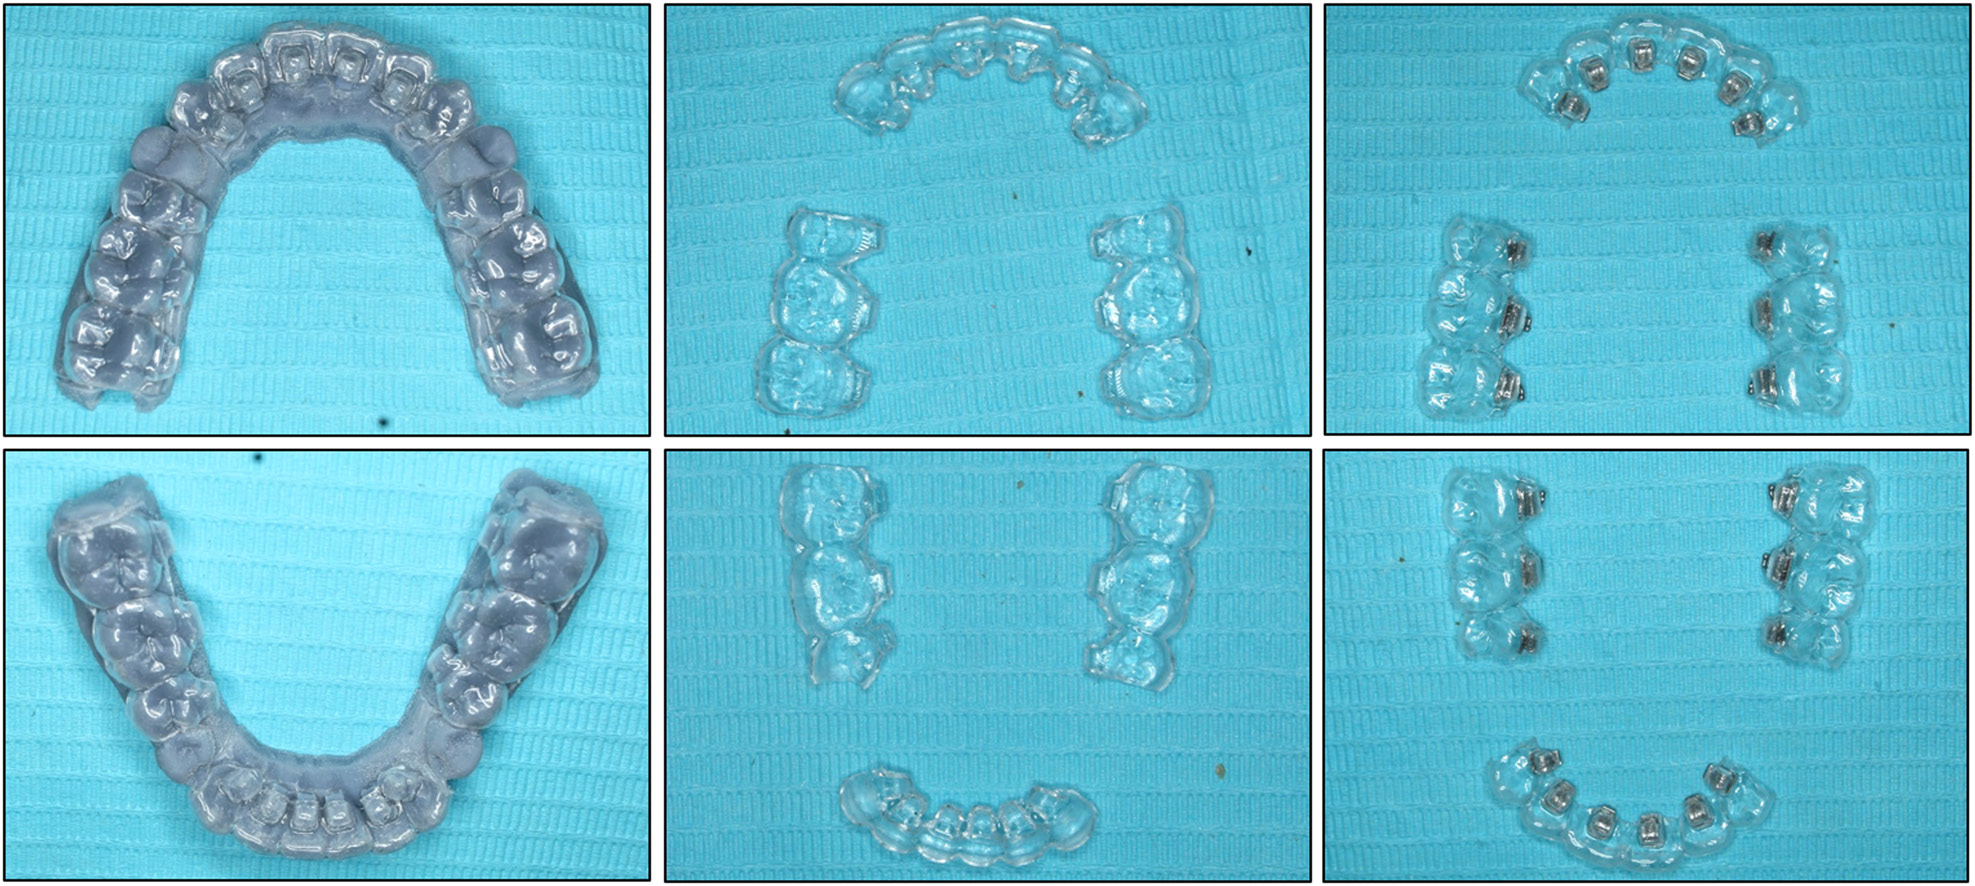
Figure 5.
Fabrication of single rigid vacuum-formed indirect bonding trays and insertion of lingual brackets.
Table II.
Deviations between bonded and planned bracket positions
| Tooth type | Linear dimension | Angular dimension | ||||
|---|---|---|---|---|---|---|
| MD (mm) | BL (mm) | OG (mm) | Rotation (°) | Tip (°) | Torque (°) | |
| Incisor | 0.055 | 0.047 | 0.050 | 1.252 | 1.350 | 1.907 |
| Upper | 0.036 | 0.028 | 0.051 | 1.113 | 2.052 | 2.248 |
| Lower | 0.074 | 0.066 | 0.049 | 1.390 | 0.649 | 1.567 |
| Canine | 0.057 | 0.022 | 0.048 | 0.689 | 1.817 | 0.829 |
| Upper | 0.061 | 0.021 | 0.051 | 0.659 | 1.669 | 0.621 |
| Lower | 0.052 | 0.023 | 0.046 | 0.720 | 1.966 | 1.036 |
| Premolar | 0.064 | 0.054 | 0.086 | 1.075 | 0.993 | 1.157 |
| Upper | 0.087 | 0.073 | 0.133 | 1.482 | 1.182 | 1.597 |
| Lower | 0.041 | 0.034 | 0.038 | 0.669 | 0.804 | 0.717 |
| Molar | 0.040 | 0.051 | 0.087 | 0.542 | 0.922 | 2.386 |
| Upper | 0.028 | 0.031 | 0.112 | 0.559 | 0.816 | 1.798 |
| Lower | 0.051 | 0.070 | 0.062 | 0.525 | 1.028 | 2.974 |
| Total | 0.052* | 0.045* | 0.068* | 0.892* | 1.226* | 1.762 |
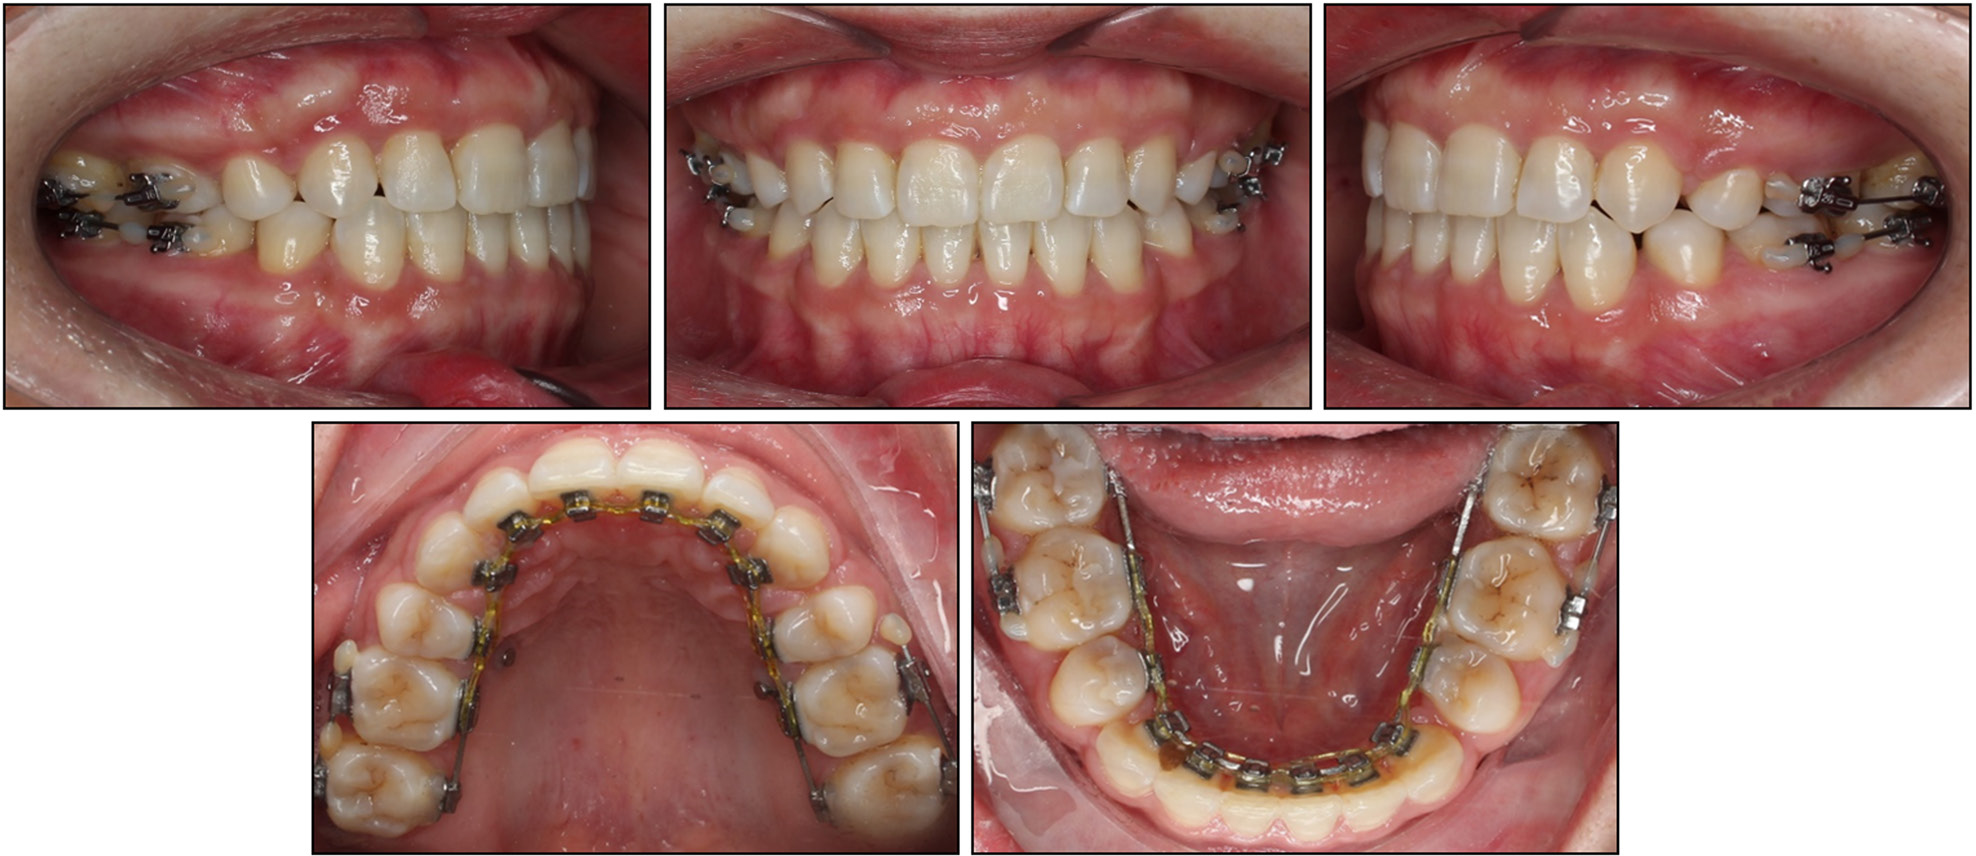
Figure 6.
Intraoral photographs at the nineteenth month.
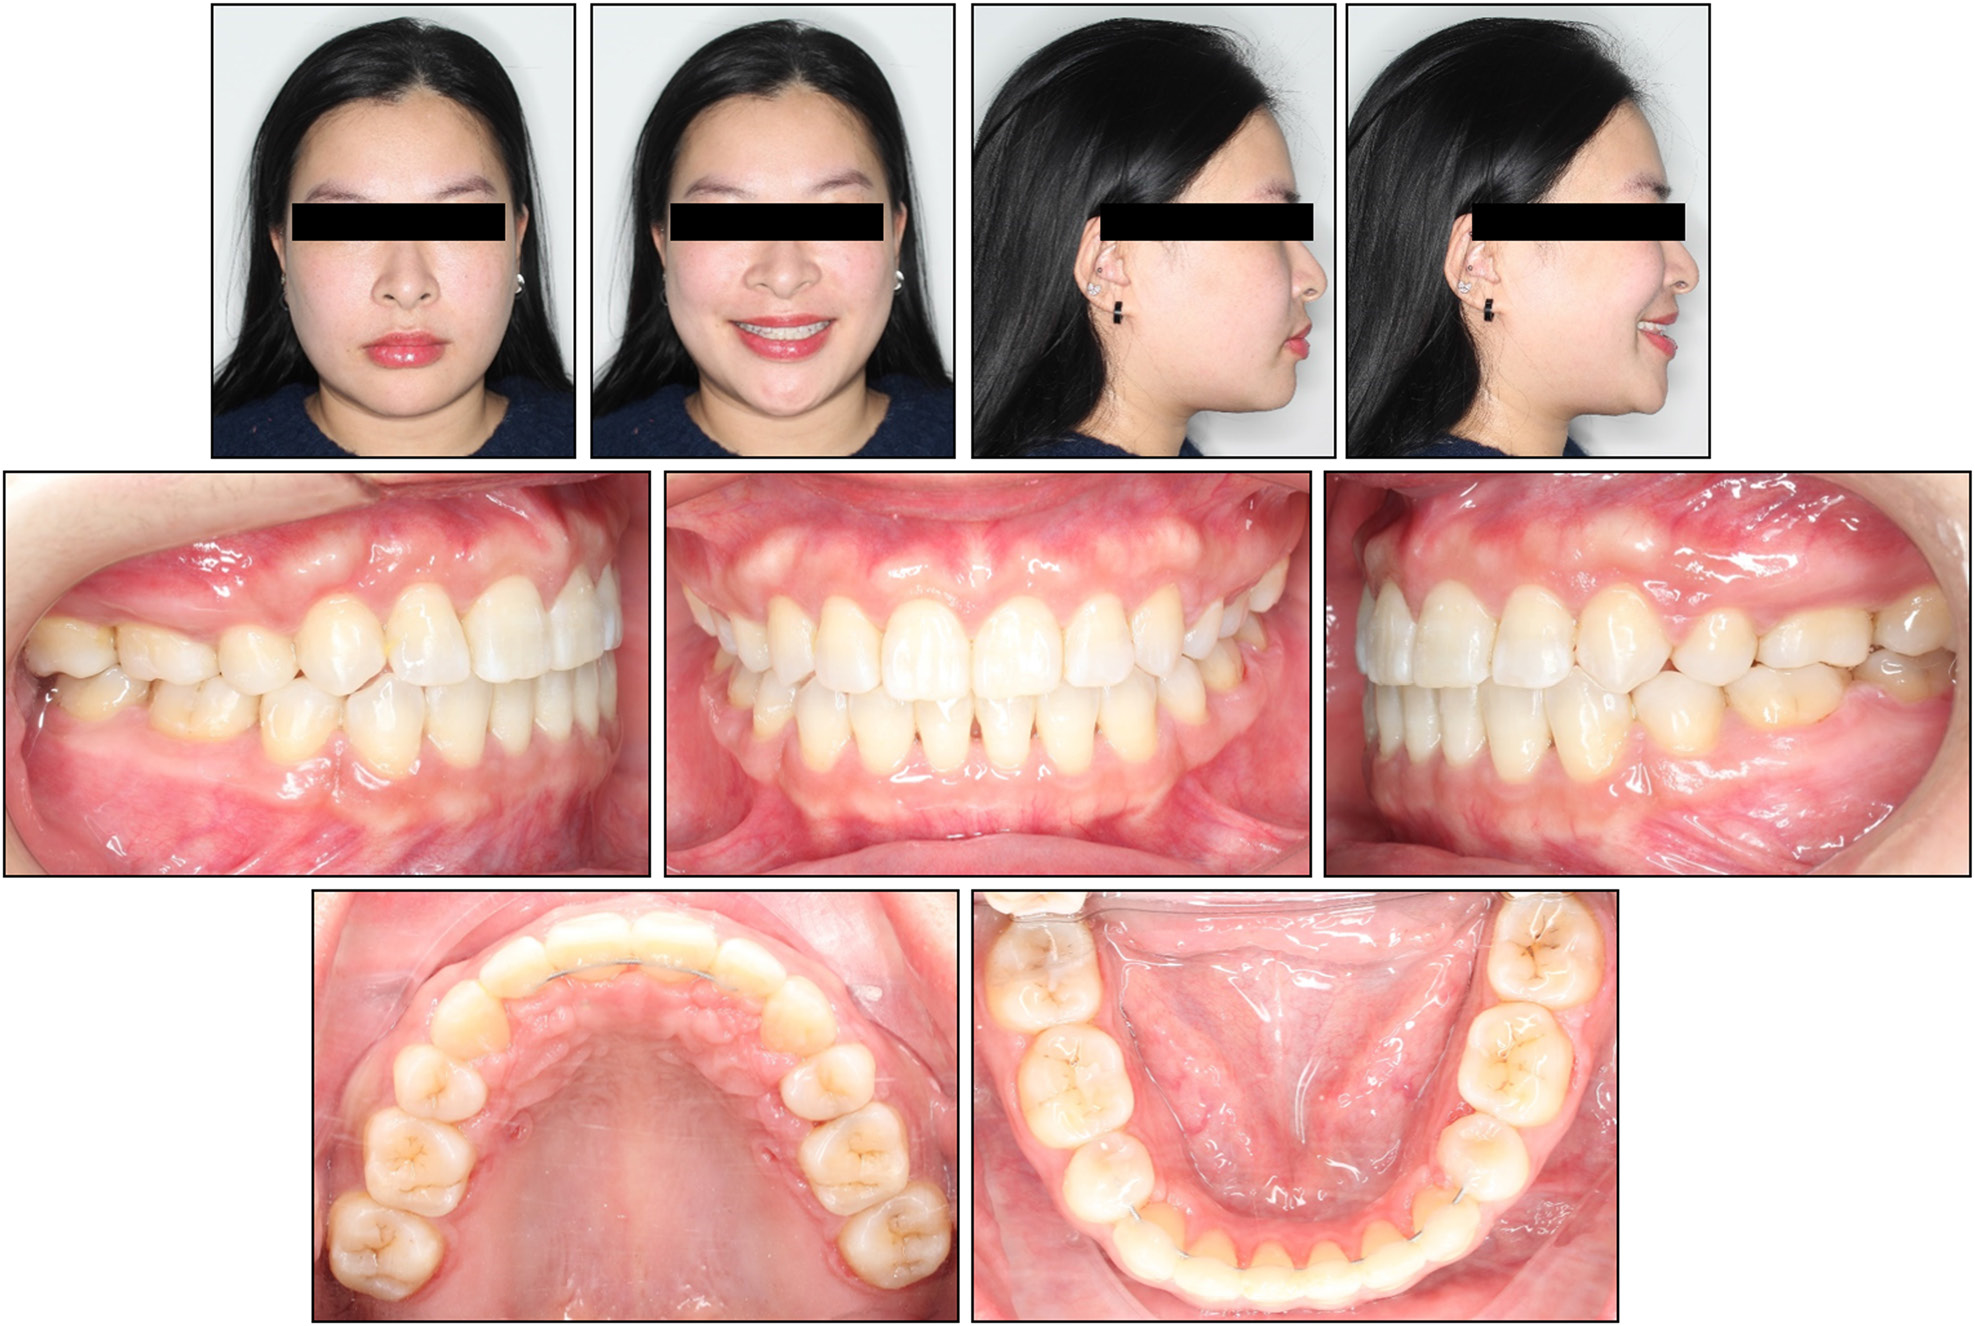
Figure 7.
Post-treatment extraoral and intraoral photographs.
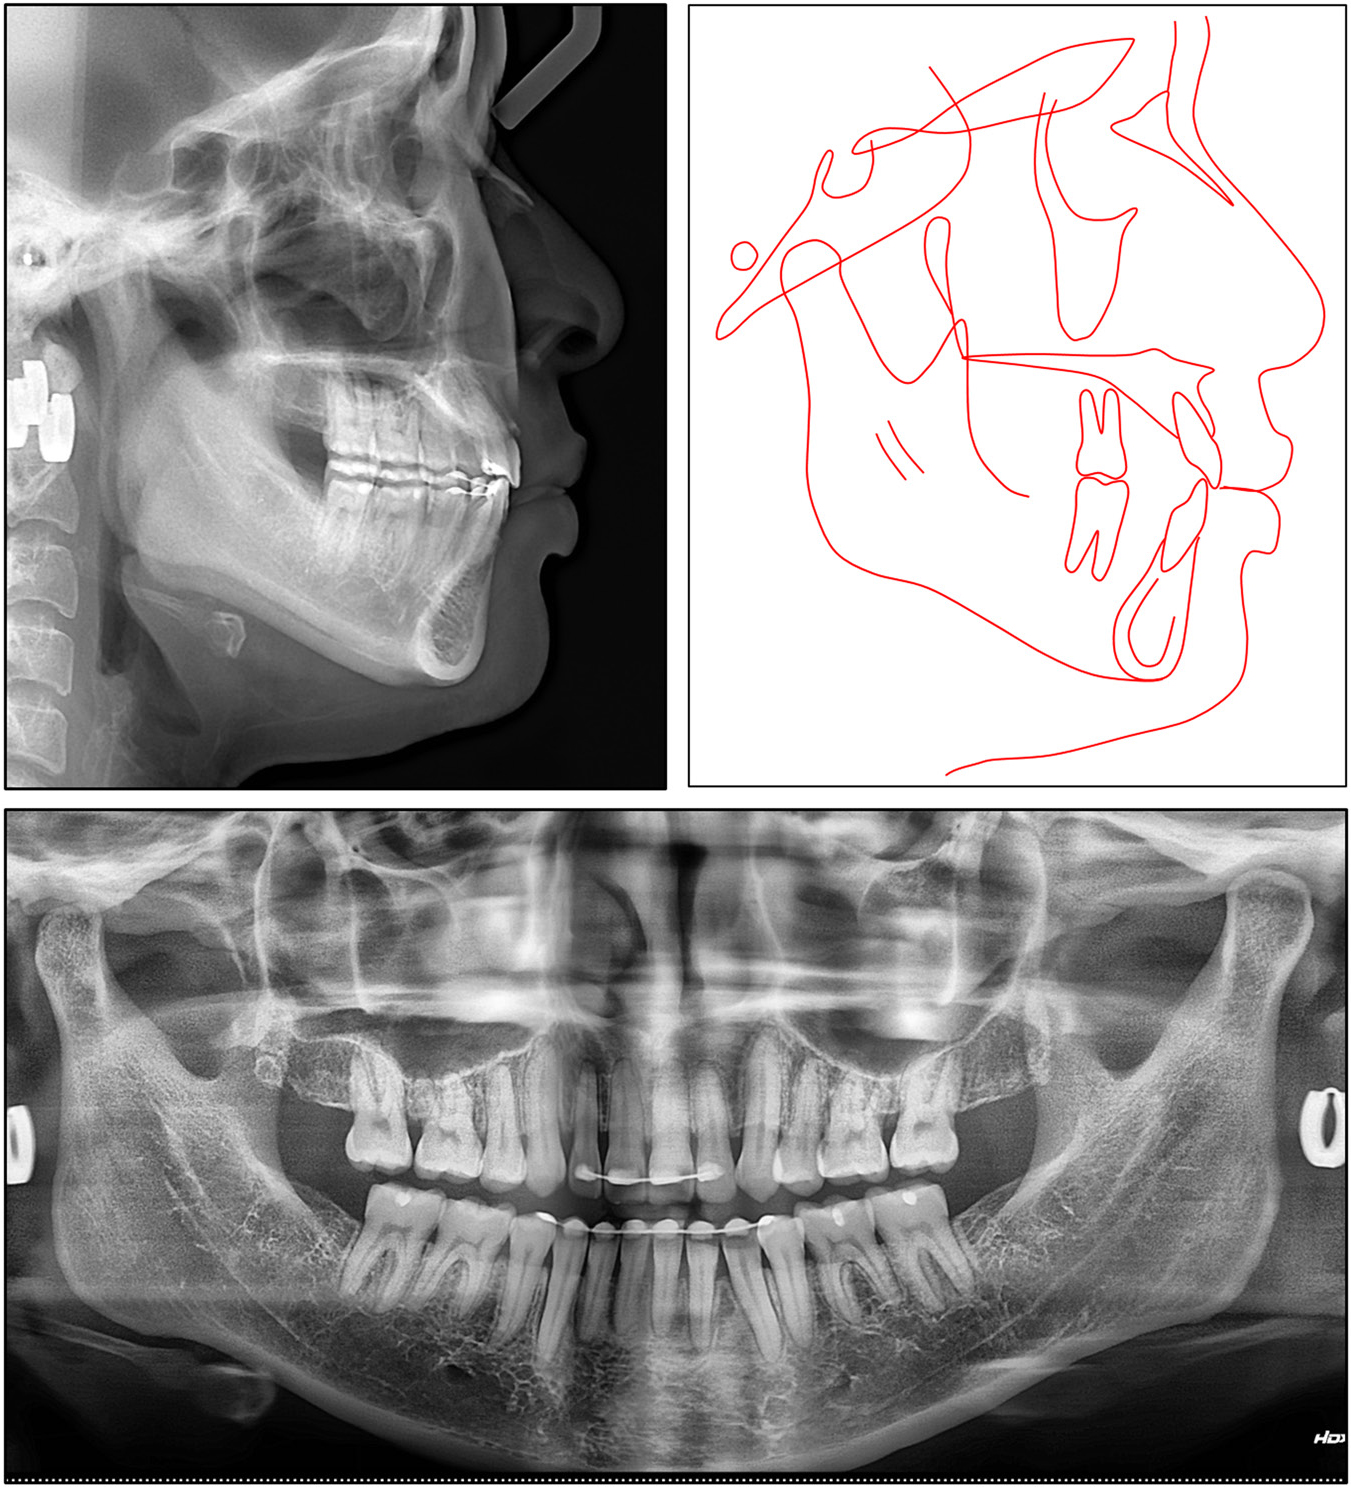
Figure 8.
Post-treatment panoramic and cephalometric radiographs and tracing graphs.
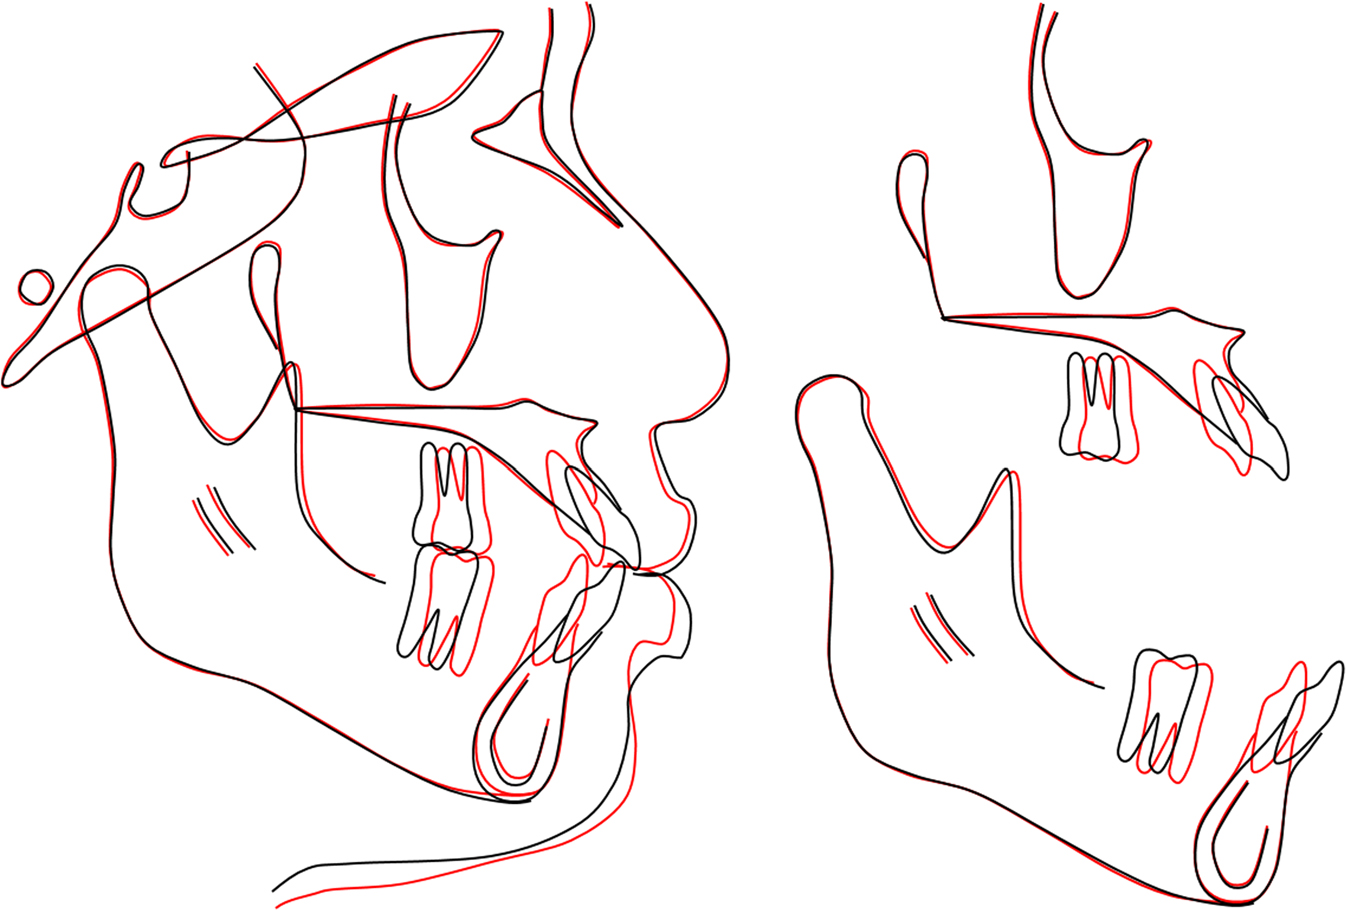
Figure 9.
General and regional lateral cephalometric superimpositions: black, pre-treatment; red, post-treatment.
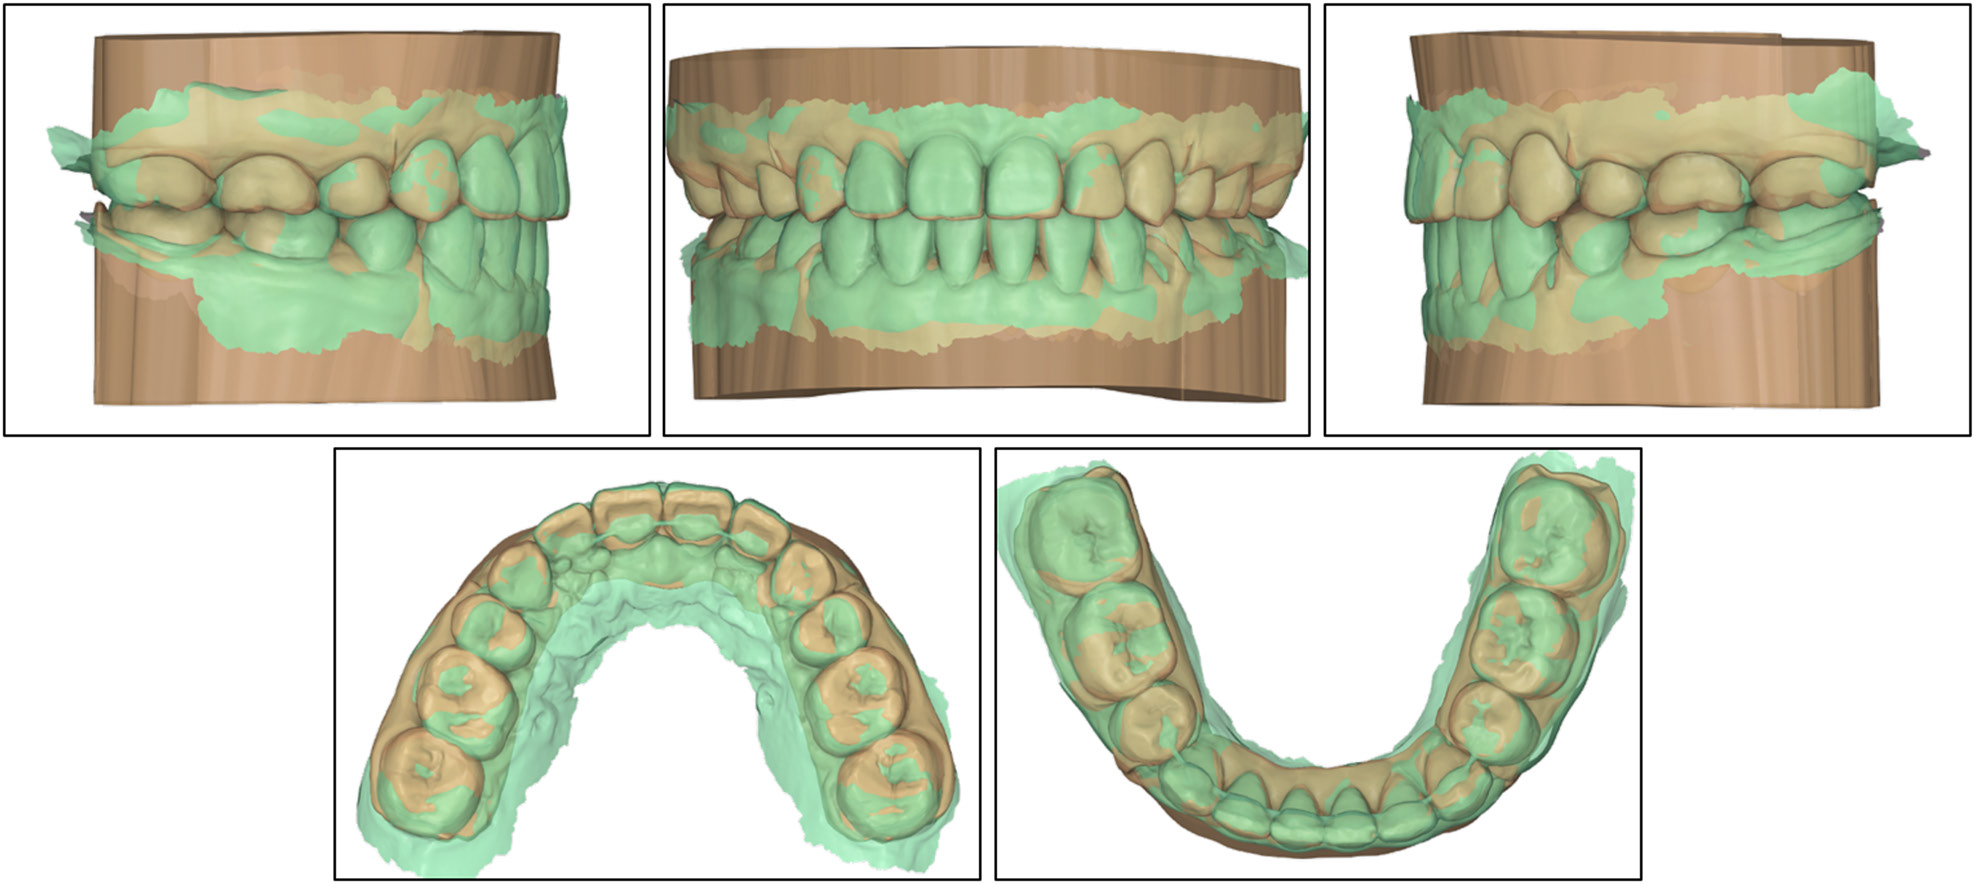
Figure 10.
Superimpositions of the post-treatment intraoral scans (green) with the orthodontic setup models (yellow).
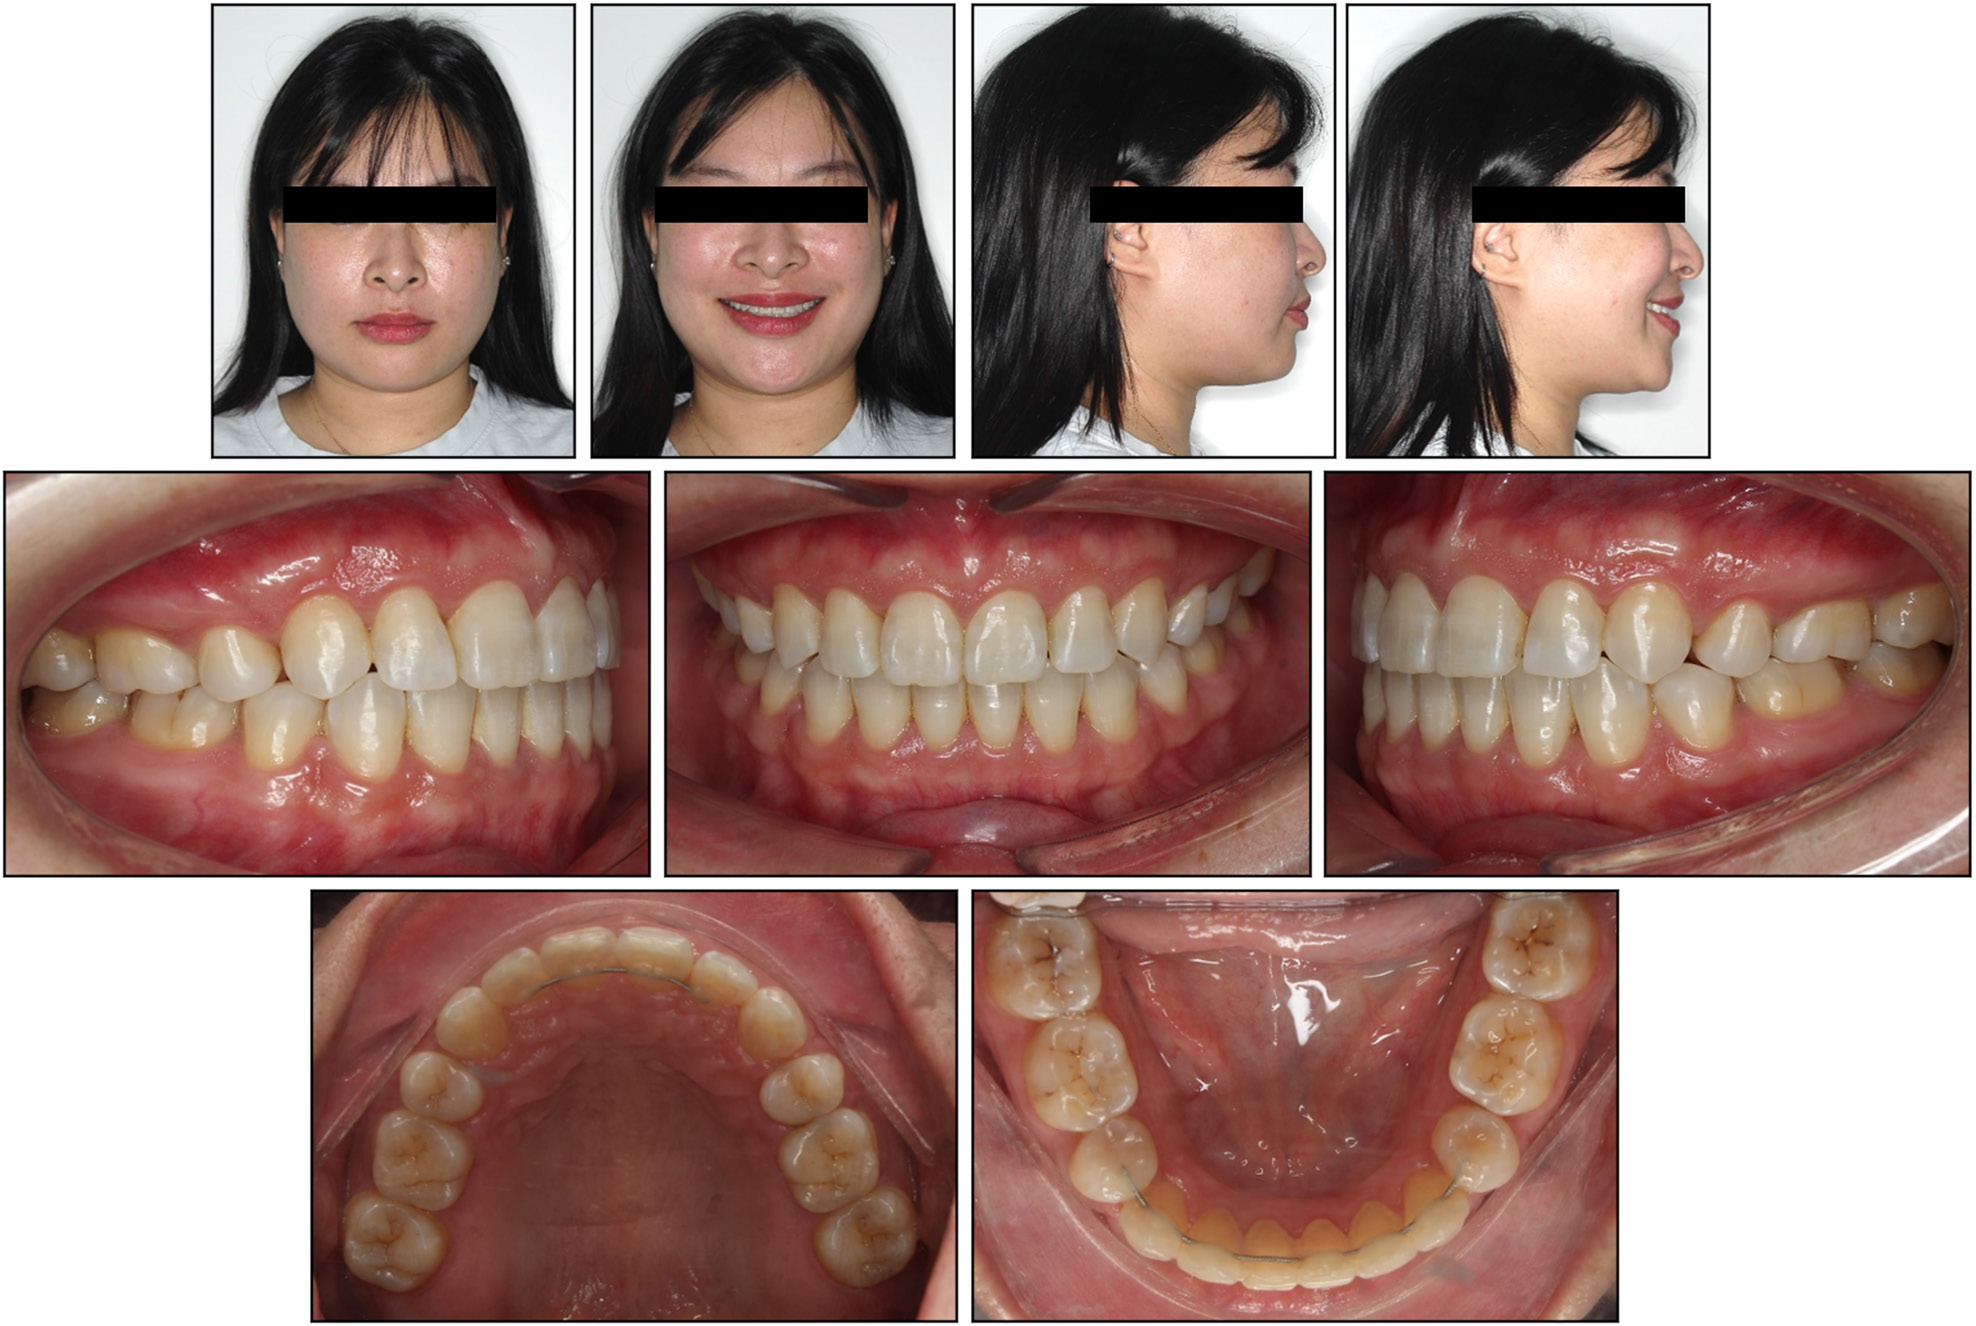
Figure 11.
One-year post-retention extraoral and intraoral photographs.