
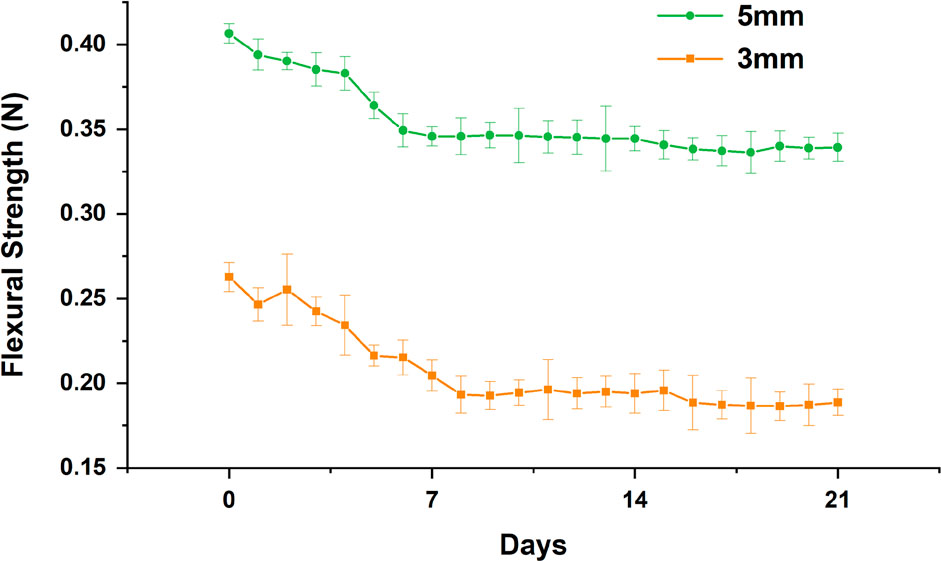
Figure 1.
Flexural strength of the clear aligners was affected by the simulated aging process.
Table I.
Translucency and surface roughness of clear aligners did not change significantly during the 21-day study (P > 0.05 for all, n = 3 in each group)
| Translucency Parameter | Roughness – internal surface (μm) | Roughness – external surface (μm) | ||||||||||
|---|---|---|---|---|---|---|---|---|---|---|---|---|
| Lower | Upper | Lower | Upper | Lower | Upper | |||||||
| Day | Mean±SD | 95% CI | 95% CI | P-value | Mean±SD | 95% CI | 95% CI | P-value | Mean±SD | 95% CI | 95% CI | P-value |
| 0 | 3.69 ± 0.66 | 2.05 | 5.34 | P > 0.05 | 5.53 ± 0.26 | 4.89 | 6.17 | P > 0.05 | 1.34 ± 0.04 | 1.23 | 1.44 | P > 0.05 |
| 1 | 4.97 ± 3.32 | -3.27 | 13.20 | P > 0.05 | 5.30 ± 0.23 | 4.74 | 5.87 | P > 0.05 | 1.53 ± 0.10 | 1.28 | 1.77 | P > 0.05 |
| 2 | 4.31 ± 4.25 | -6.24 | 14.86 | P > 0.05 | 5.64 ± 0.8 | 3.65 | 7.64 | P > 0.05 | 1.72 ± 0.06 | 1.58 | 1.87 | P > 0.05 |
| 3 | 3.10 ± 1.84 | -1.47 | 7.67 | P > 0.05 | 5.65 ± 0.67 | 3.97 | 7.32 | P > 0.05 | 1.44 ± 0.50 | 0.19 | 2.69 | P > 0.05 |
| 4 | 4.93 ± 2.91 | -2.30 | 12.17 | P > 0.05 | 5.39 ± 0.41 | 4.37 | 6.4 | P > 0.05 | 1.60 ± 0.54 | 0.27 | 2.93 | P > 0.05 |
| 5 | 4.85 ± 0.91 | 2.58 | 7.12 | P > 0.05 | 5.33 ± 0.58 | 3.9 | 6.77 | P > 0.05 | 1.45 ± 0.30 | 0.7 | 2.2 | P > 0.05 |
| 6 | 4.50 ± 1.59 | 0.54 | 8.46 | P > 0.05 | 5.45 ± 0.49 | 4.24 | 6.65 | P > 0.05 | 1.45 ± 0.25 | 0.84 | 2.07 | P > 0.05 |
| 7 | 3.87 ± 0.75 | 2.01 | 5.73 | P > 0.05 | 5.58 ± 0.21 | 5.05 | 6.1 | P > 0.05 | 1.29 ± 0.19 | 0.82 | 1.75 | P > 0.05 |
| 8 | 4.72 ± 0.35 | 3.86 | 5.59 | P > 0.05 | 5.47 ± 0.49 | 4.25 | 6.68 | P > 0.05 | 1.38 ± 0.50 | 0.14 | 2.62 | P > 0.05 |
| 9 | 3.20 ± 1.59 | -0.76 | 7.15 | P > 0.05 | 5.27 ± 1.07 | 2.61 | 7.94 | P > 0.05 | 1.48 ± 0.45 | 0.37 | 2.59 | P > 0.05 |
| 10 | 2.35 ± 0.84 | 0.27 | 4.44 | P > 0.05 | 5.23 ± 0.65 | 3.61 | 6.86 | P > 0.05 | 1.65 ± 0.06 | 1.51 | 1.79 | P > 0.05 |
| 11 | 3.89 ± 1.61 | -0.11 | 7.89 | P > 0.05 | 5.64 ± 0.03 | 5.55 | 5.73 | P > 0.05 | 1.72 ± 0.05 | 1.59 | 1.85 | P > 0.05 |
| 12 | 2.35 ± 0.19 | 1.86 | 2.83 | P > 0.05 | 5.39 ± 0.19 | 4.92 | 5.87 | P > 0.05 | 1.52 ± 0.13 | 1.2 | 1.84 | P > 0.05 |
| 13 | 4.76 ± 1.43 | 1.20 | 8.32 | P > 0.05 | 5.54 ± 0.08 | 5.33 | 5.74 | P > 0.05 | 1.34 ± 0.51 | 0.07 | 2.61 | P > 0.05 |
| 14 | 2.51 ± 1.06 | -0.12 | 5.14 | P > 0.05 | 5.45 ± 0.52 | 4.15 | 6.74 | P > 0.05 | 1.55 ± 0.45 | 0.42 | 2.67 | P > 0.05 |
| 15 | 2.53 ± 0.33 | 1.72 | 3.34 | P > 0.05 | 5.80 ± 0.03 | 5.73 | 5.87 | P > 0.05 | 1.27 ± 0.05 | 1.14 | 1.41 | P > 0.05 |
| 16 | 3.62 ± 1.96 | -1.24 | 8.49 | P > 0.05 | 5.57 ± 0.52 | 4.27 | 6.86 | P > 0.05 | 1.75 ± 0.25 | 1.14 | 2.36 | P > 0.05 |
| 17 | 2.36 ± 0.39 | 1.40 | 3.32 | P > 0.05 | 5.53 ± 0.19 | 5.07 | 6.00 | P > 0.05 | 1.72 ± 0.10 | 1.46 | 1.98 | P > 0.05 |
| 18 | 2.65 ± 1.30 | -0.57 | 5.88 | P > 0.05 | 5.78 ± 0.27 | 5.1 | 6.46 | P > 0.05 | 1.63 ± 0.24 | 1.04 | 2.23 | P > 0.05 |
| 19 | 5.97 ± 1.35 | 2.63 | 9.32 | P > 0.05 | 5.41 ± 0.77 | 3.5 | 7.31 | P > 0.05 | 1.81 ± 0.09 | 1.58 | 2.05 | P > 0.05 |
| 20 | 3.75 ± 1.88 | -0.91 | 8.41 | P > 0.05 | 5.28 ± 0.78 | 3.34 | 7.21 | P > 0.05 | 1.68 ± 0.18 | 1.23 | 2.14 | P > 0.05 |
| 21 | 4.49 ± 0.75 | 2.64 | 6.34 | P > 0.05 | 5.31 ± 0.78 | 3.36 | 7.25 | P > 0.05 | 1.70 ± 0.25 | 1.07 | 2.32 | P > 0.05 |
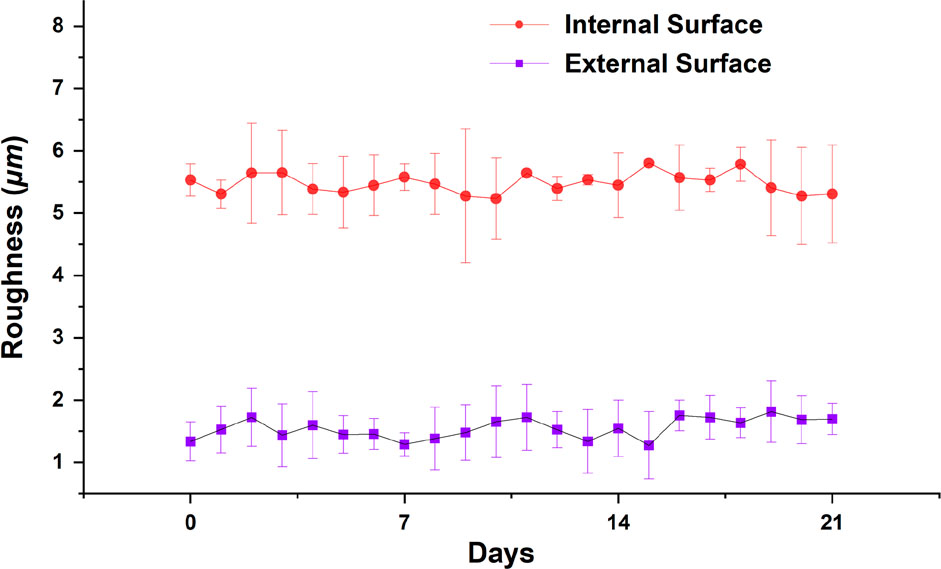
Figure 2.
Surface roughness of the clear aligners was not significantly changed by the simulated aging process.
Table II.
Tensile strength and maximum load of the clear aligners did not change significantly during the 21-day study (P > 0.05 for all, n=3 in each group)
| Tensile strength (N/mm2) | Maximum load (N/mm2) | |||||||
|---|---|---|---|---|---|---|---|---|
| Lower | Upper | Lower | Upper | |||||
| Day | Mean±SD | 95% CI | 95% CI | P-value | Mean±SD | 95% CI | 95% CI | P-value |
| 0 | 20.85 ± 1.08 | 18.18 | 23.53 | > 0.05 | 104.26 ± 5.38 | 18.18 | 23.53 | > 0.05 |
| 1 | 20.55 ± 2.75 | 16.17 | 24.92 | > 0.05 | 102.74 ± 13.75 | 16.17 | 24.92 | > 0.05 |
| 2 | 21.38 ± 3.38 | 16.00 | 26.76 | > 0.05 | 106.89 ± 16.91 | 16.00 | 26.76 | > 0.05 |
| 3 | 19.87 ± 3.10 | 14.93 | 24.80 | > 0.05 | 99.34 ± 15.50 | 14.93 | 24.80 | > 0.05 |
| 4 | 20.28 ± 2.44 | 16.41 | 24.16 | > 0.05 | 101.42 ± 12.18 | 16.41 | 24.16 | > 0.05 |
| 5 | 20.98 ± 3.20 | 15.88 | 26.08 | > 0.05 | 104.91 ± 16.02 | 15.88 | 26.08 | > 0.05 |
| 6 | 20.01 ± 2.61 | 15.85 | 24.16 | > 0.05 | 100.05 ± 13.06 | 15.85 | 24.16 | > 0.05 |
| 7 | 19.02 ± 0.48 | 18.26 | 19.78 | > 0.05 | 95.11 ± 2.39 | 18.26 | 19.78 | > 0.05 |
| 8 | 21.70 ± 3.90 | 15.49 | 27.91 | > 0.05 | 108.50 ± 19.51 | 15.49 | 27.91 | > 0.05 |
| 9 | 20.11 ± 3.01 | 15.32 | 24.91 | > 0.05 | 100.57 ± 15.06 | 15.32 | 24.91 | > 0.05 |
| 10 | 18.98 ± 4.34 | 12.07 | 25.88 | > 0.05 | 94.89 ± 21.69 | 12.07 | 25.88 | > 0.05 |
| 11 | 22.02 ± 2.46 | 18.10 | 25.93 | > 0.05 | 110.08 ± 12.30 | 18.10 | 25.93 | > 0.05 |
| 12 | 18.22 ± 3.48 | 12.67 | 23.76 | > 0.05 | 91.08 ± 17.42 | 12.67 | 23.76 | > 0.05 |
| 13 | 18.95 ± 2.84 | 14.43 | 23.46 | > 0.05 | 94.74 ± 14.18 | 14.43 | 23.46 | > 0.05 |
| 14 | 18.82 ± 1.56 | 16.33 | 21.31 | > 0.05 | 94.08 ± 7.82 | 16.33 | 21.31 | > 0.05 |
| 15 | 21.11 ± 2.61 | 16.95 | 25.26 | > 0.05 | 105.53 ± 13.05 | 16.95 | 25.26 | > 0.05 |
| 16 | 20.43 ± 4.67 | 13.01 | 27.85 | > 0.05 | 102.15 ± 23.33 | 13.01 | 27.85 | > 0.05 |
| 17 | 19.45 ± 3.11 | 14.51 | 24.40 | > 0.05 | 97.27 ± 15.53 | 14.51 | 24.40 | > 0.05 |
| 18 | 18.93 ± 0.32 | 18.41 | 19.44 | > 0.05 | 94.65 ± 1.62 | 18.41 | 19.44 | > 0.05 |
| 19 | 21.08 ± 1.75 | 18.29 | 23.86 | > 0.05 | 105.38 ± 8.75 | 18.29 | 23.86 | > 0.05 |
| 20 | 18.40 ± 2.80 | 13.94 | 22.86 | > 0.05 | 91.99 ± 14.01 | 13.94 | 22.86 | > 0.05 |
| 21 | 17.63 ± 3.58 | 11.94 | 23.32 | > 0.05 | 88.17 ± 17.88 | 11.94 | 23.32 | > 0.05 |
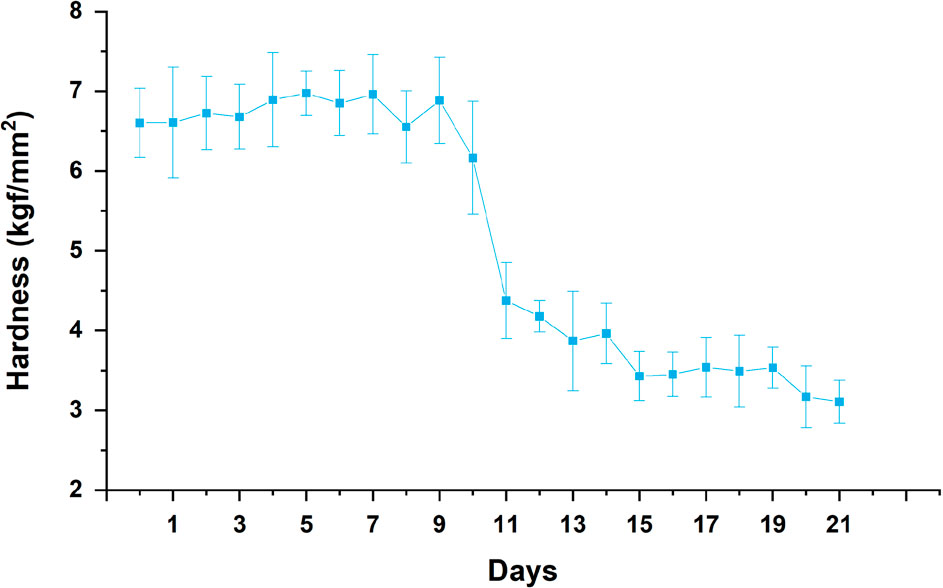
Figure 3.
Hardness of the clear aligners was significantly reduced after 10 days of the simulated aging process.