
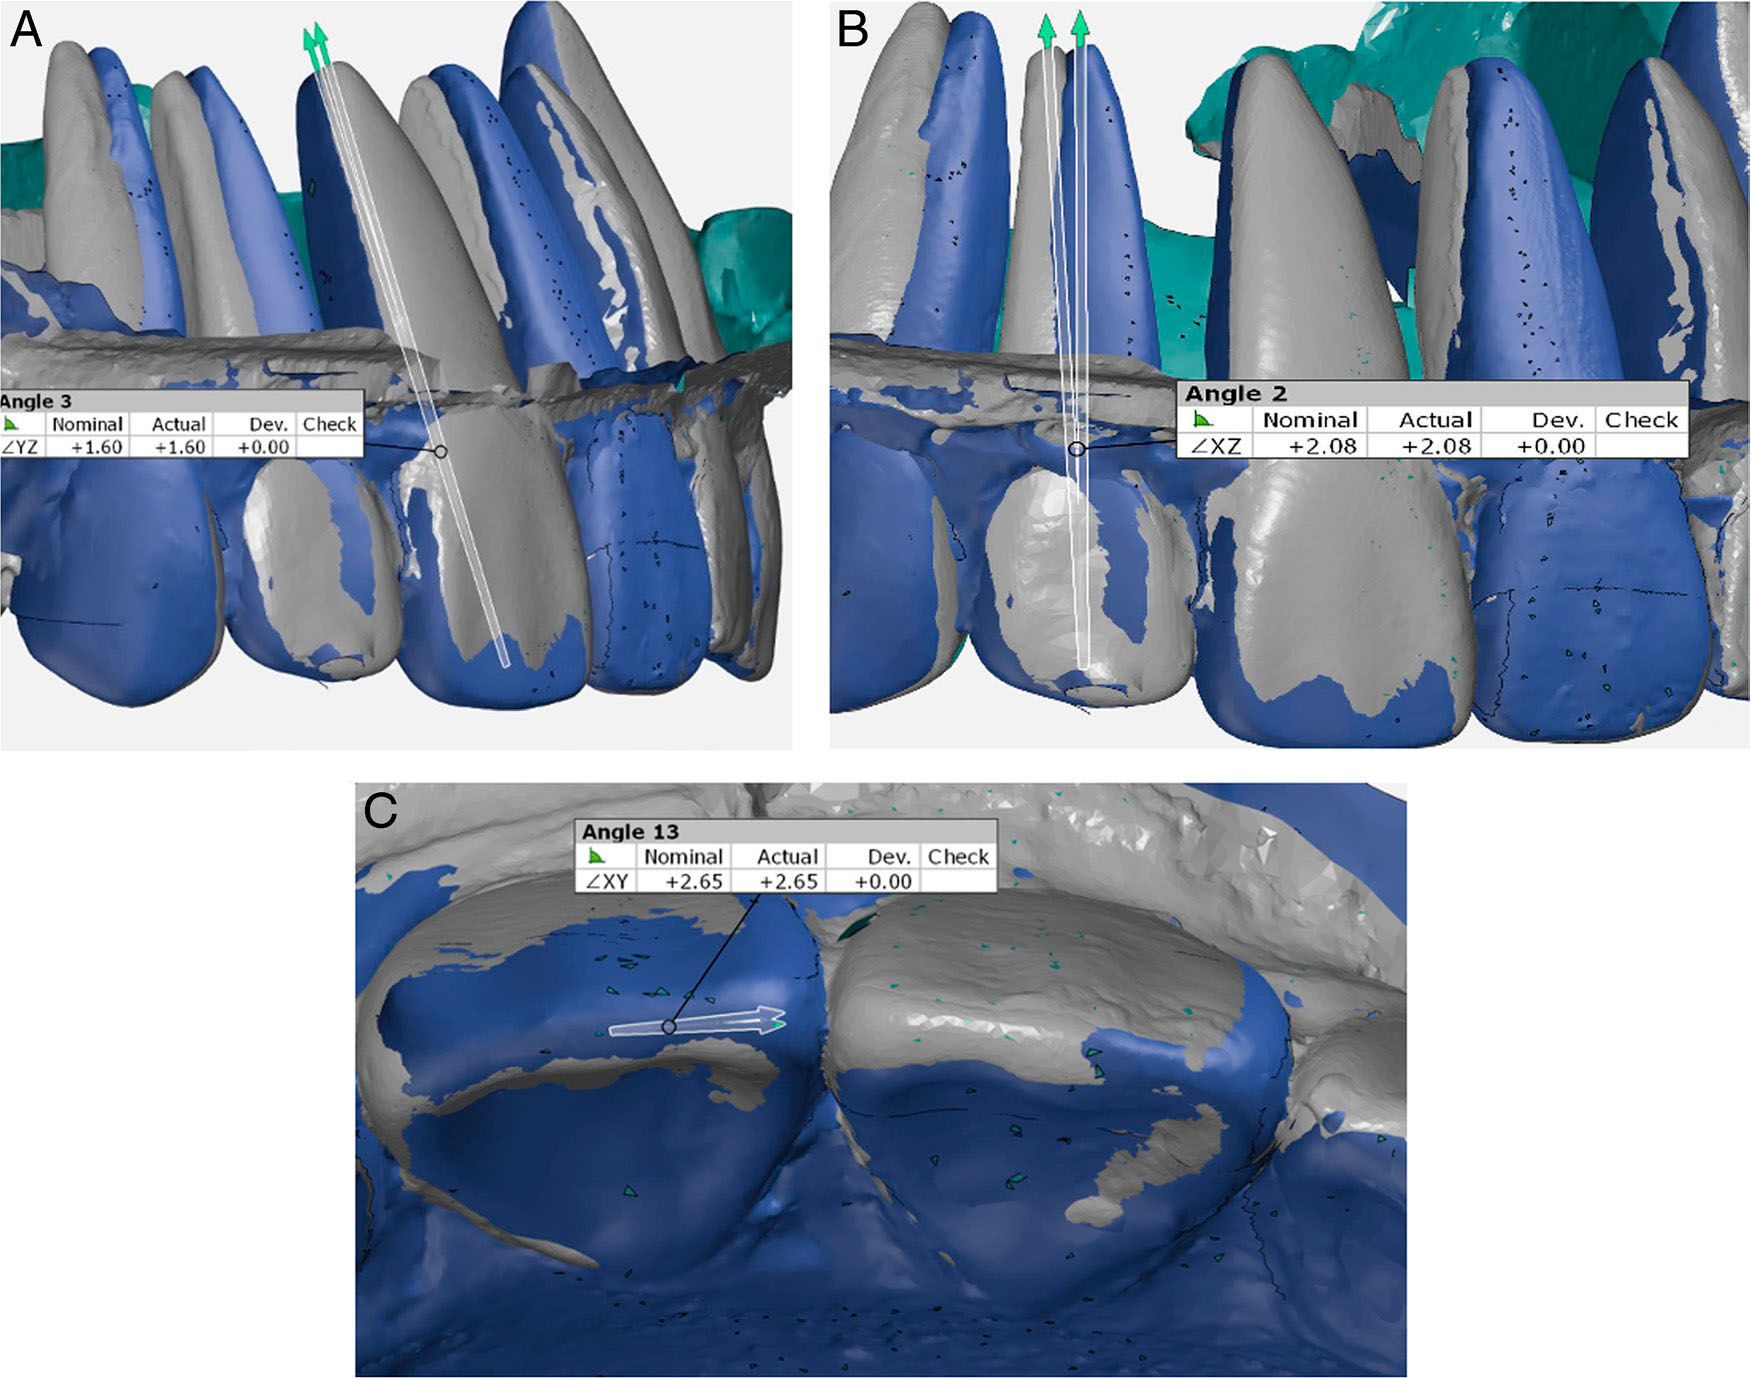
Figure 1.
A, Angle created for measuring torque movement using GOM Inspect Professional software (GOM, 2018, Braunschweig, Germany). B, Angle created for measuring tipping movement. C, Angle created for measuring rotation movement.
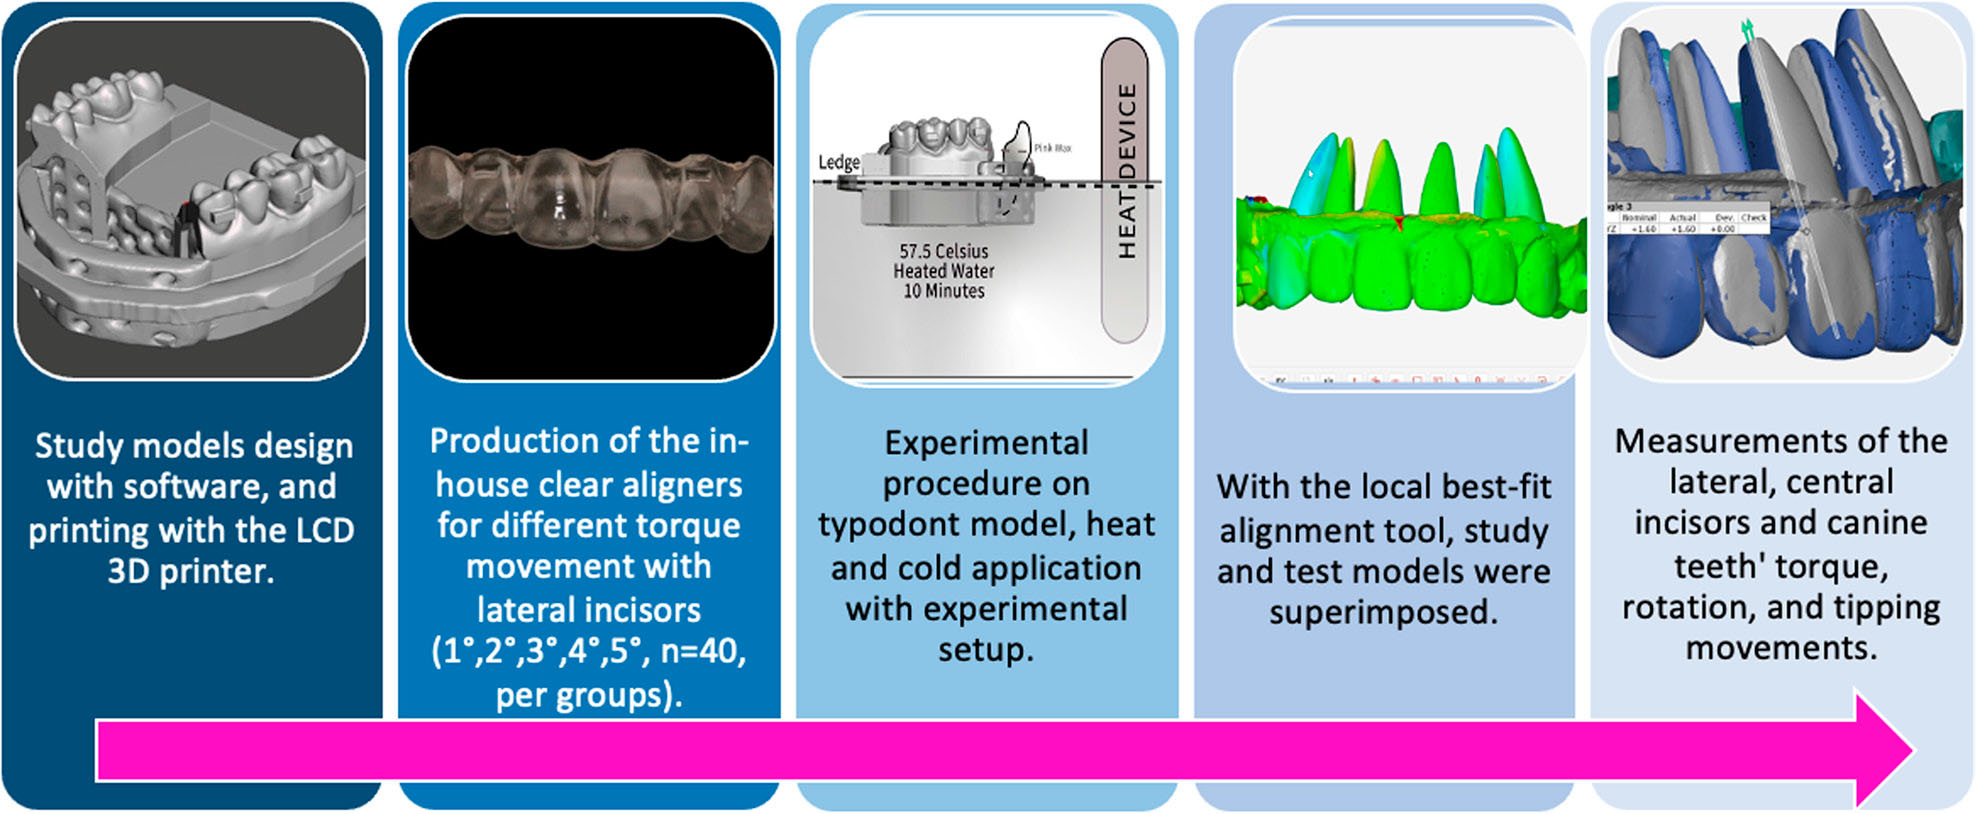
Figure 2.
The flow chart of the study.
Table I.
Descriptive statistics and post hoc comparisons of torque values (degree) of the lateral incisor teeth
| 1° | 2° | 3° | 4° | 5° | ||
|---|---|---|---|---|---|---|
| Group | Mean ± SD | Mean ± SD | Mean ± SD | Mean ± SD | Mean ± SD | p* |
| Control | 1.14 ± 0.85 | 1.66 ± 0.82 | 1.42 ± 0.74 | 1.32 ± 0.62 | 1.49 ± 0.42ab | 0.852 |
| Buccal Power Ridge | 1.40 ± 1.12 | 1.34 ± 1.02 | 1.32 ± 1.07 | 0.98 ± 0.53 | 1.07 ± 0.56a | 0.963 |
| Buccal and Palatal Power Ridge | 0.83 ± 0.40A | 1.16 ± 0.71AB | 1.49 ± 0.81AB | 2.04 ± 0.85AB | 2.15 ± 0.40Bb | 0.004* |
| Vertical Ellipsoid | 1.22 ± 0.74 | 1.43 ± 0.76 | 1.33 ± 1.18 | 1.31 ± 0.80 | 1.59 ± 0.64ab | 0.644 |
| Horizontal Ellipsoid | 0.79 ± 0.70 | 1.25 ± 0.71 | 1.88 ± 1.12 | 1.56 ± 1.15 | 2.08 ± 0.96ab | 0.072 |
| p | 0.591 | 0.732 | 0.626 | 0.145 | 0.017* |
Table II.
Descriptive statistics and post hoc comparisons of effected torque values of the central incisor teeth
| 1° | 2° | 3° | 4° | 5° | ||
|---|---|---|---|---|---|---|
| Mean ± SD | Mean ± SD | Mean ± SD | Mean ± SD | Mean ± SD | p* | |
| No Attachment | 2.00 ± 1.11 | 1.36 ± 0.92 | 1.24 ± 0.95 | 1.23 ± 0.80 | 1.24 ± 1.08 | 0.630 |
| Buccal Power Ridge | 1.14 ± 0.67 | 1.27 ± 1.31 | 0.94 ± 0.67 | 1.80 ± 1.11 | 1.24 ± 0.73 | 0.486 |
| Buccal and Palatal Power Ridge | 0.91 ± 0.86 | 1.20 ± 0.88 | 1.15 ± 0.62 | 0.94 ± 0.48 | 0.99 ± 0.51 | 0.868 |
| Vertical Ellipsoid | 1.21 ± 0.89 | 1.18 ± 1.13 | 1.16 ± 0.95 | 1.37 ± 0.74 | 1.12 ± 0.65 | 0.916 |
| Horizontal Ellipsoid | 1.05 ± 0.65 | 0.89 ± 0.49 | 0.84 ± 0.77 | 0.93 ± 0.87 | 0.87 ± 0.45 | 0.903 |
| p | 0.175 | 0.870 | 0.885 | 0.278 | 0.896 |
Table III.
Descriptive statistics and post hoc comparisons of effected torque values of the canine teeth
| 1° | 2° | 3° | 4° | 5° | ||
|---|---|---|---|---|---|---|
| Group | Mean ± SD | Mean ± SD | Mean ± SD | Mean ± SD | Mean ± SD | p* |
| No Attachment | 1.23 ± 0.69 | 2.12 ± 0.95abc | 1.64 ± 1.37 | 0.99 ± 0.60 | 1.78 ± 1.25 | 0.209 |
| Buccal Power Ridge | 1.20 ± 0.50A | 3.69 ± 1.43Ba | 2.88 ± 1.56AB | 1.86 ± 1.26AB | 3.10 ± 3.05AB | 0.015* |
| Buccal and Palatal Power Ridge | 1.78 ± 0.92 | 0.94 ± 0.57b | 1.04 ± 0.62 | 1.76 ± 1.90 | 1.21 ± 1.15 | 0.506 |
| Vertical Ellipsoid | 0.90 ± 0.62 | 1.83 ± 1.34abc | 0.85 ± 0.76 | 1.86 ± 1.78 | 1.33 ± 1.31 | 0.278 |
| Horizontal Ellipsoid | 1.52 ± 1.00 | 1.24 ± 0.63c | 1.57 ± 0.89 | 1.10 ± 0.77 | 1.51 ± 1.30 | 0.870 |
| p | 0.297 | <0.001* | 0.034 | 0.698 | 0.324 |
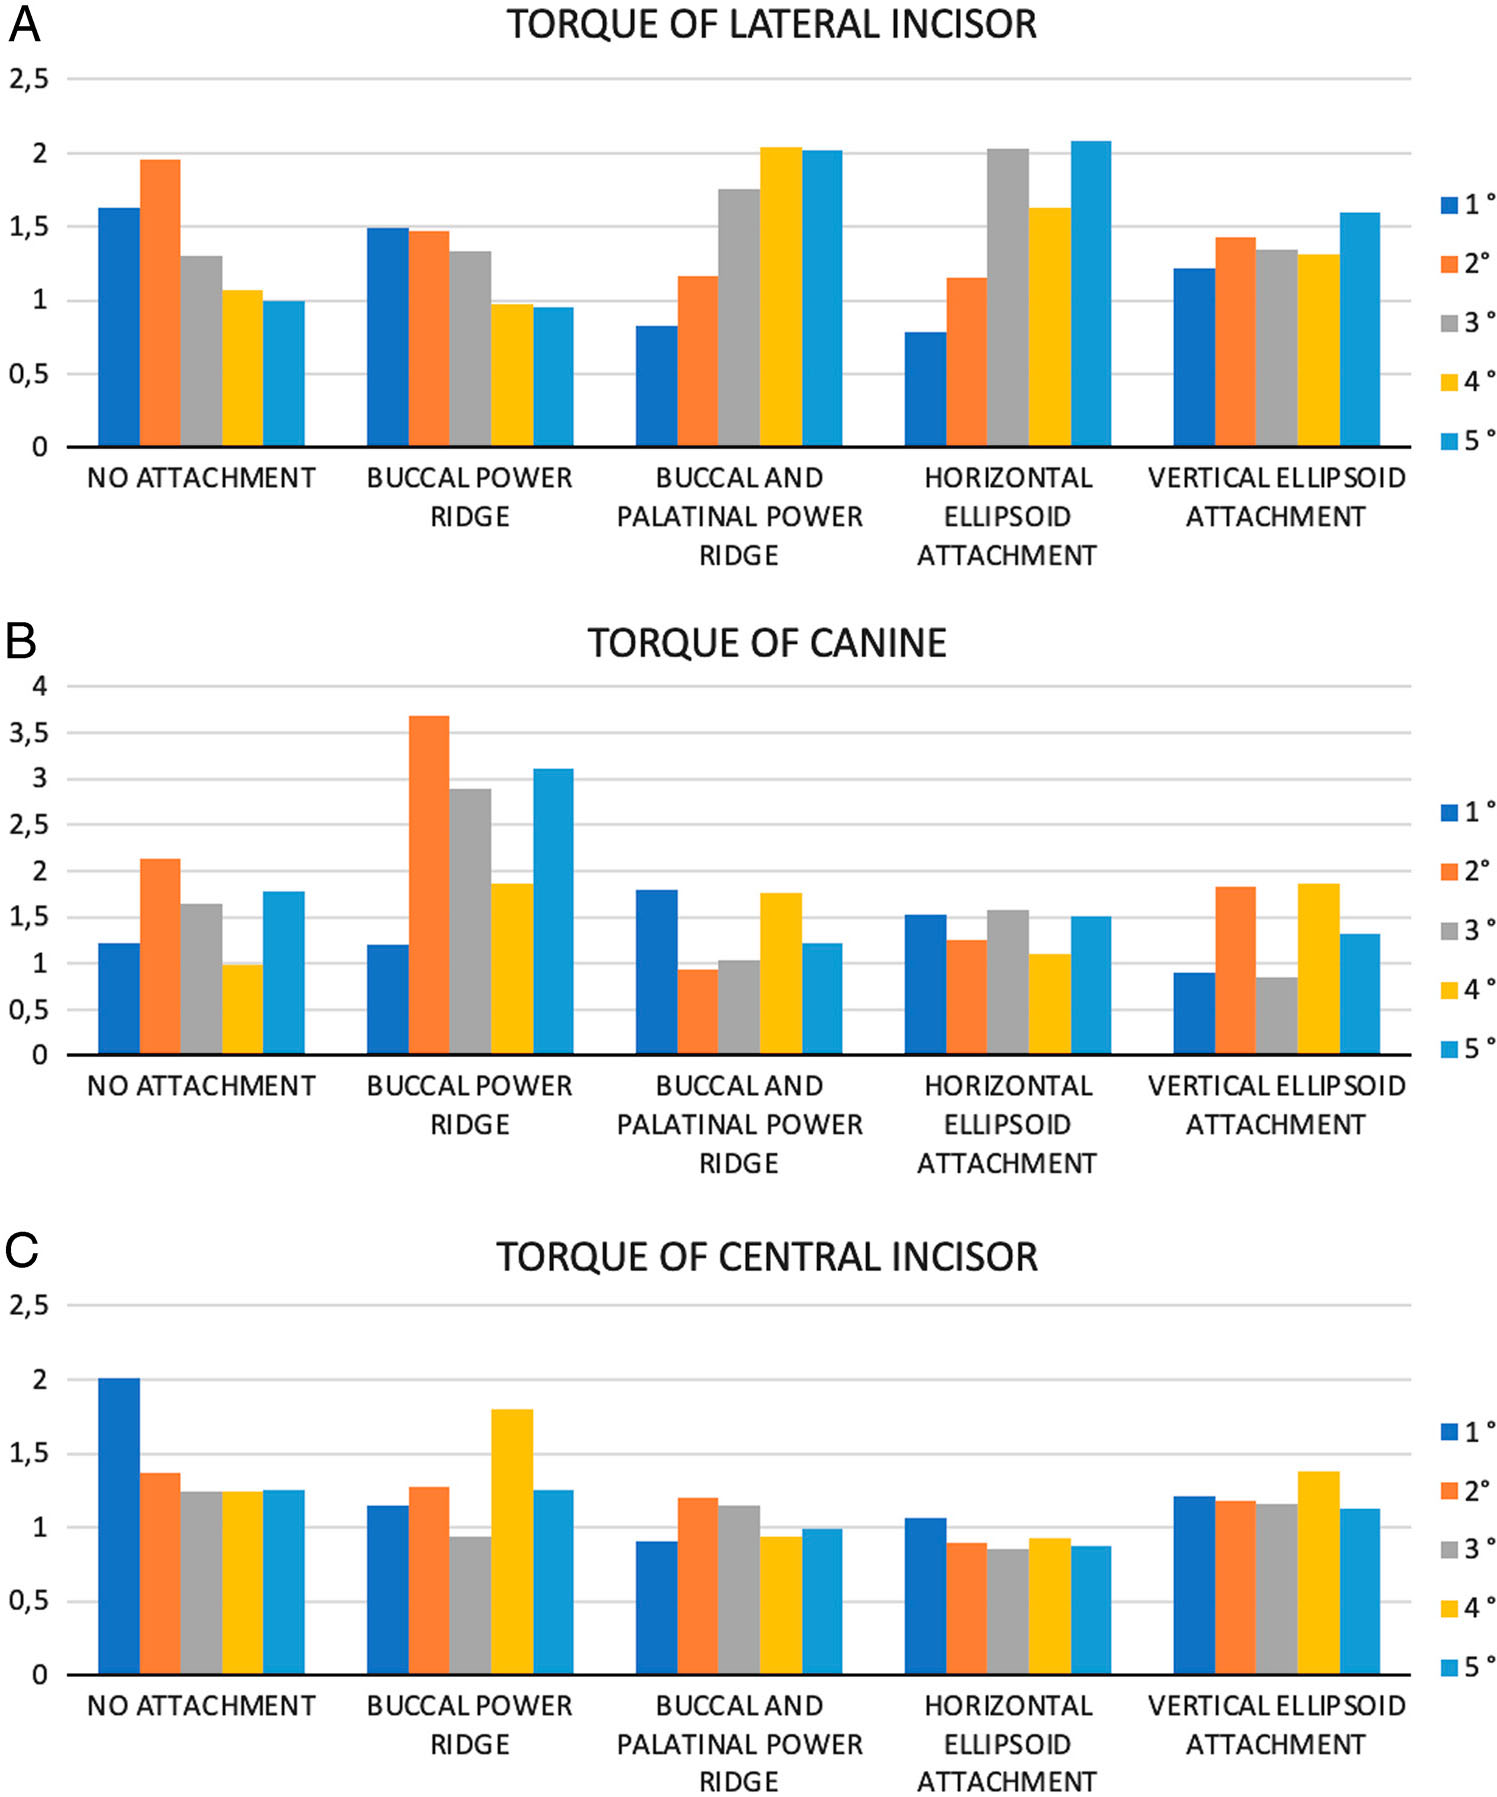
Figure 3.
Column chart showing the effectiveness of torque movement at different degrees. A, Distribution of torque values in lateral incisor teeth based on degree and mechanism type. B, Distribution of torque values in canine teeth based on degree and mechanism type. C, Distribution of torque values in central incisor teeth based on degree and mechanism type.
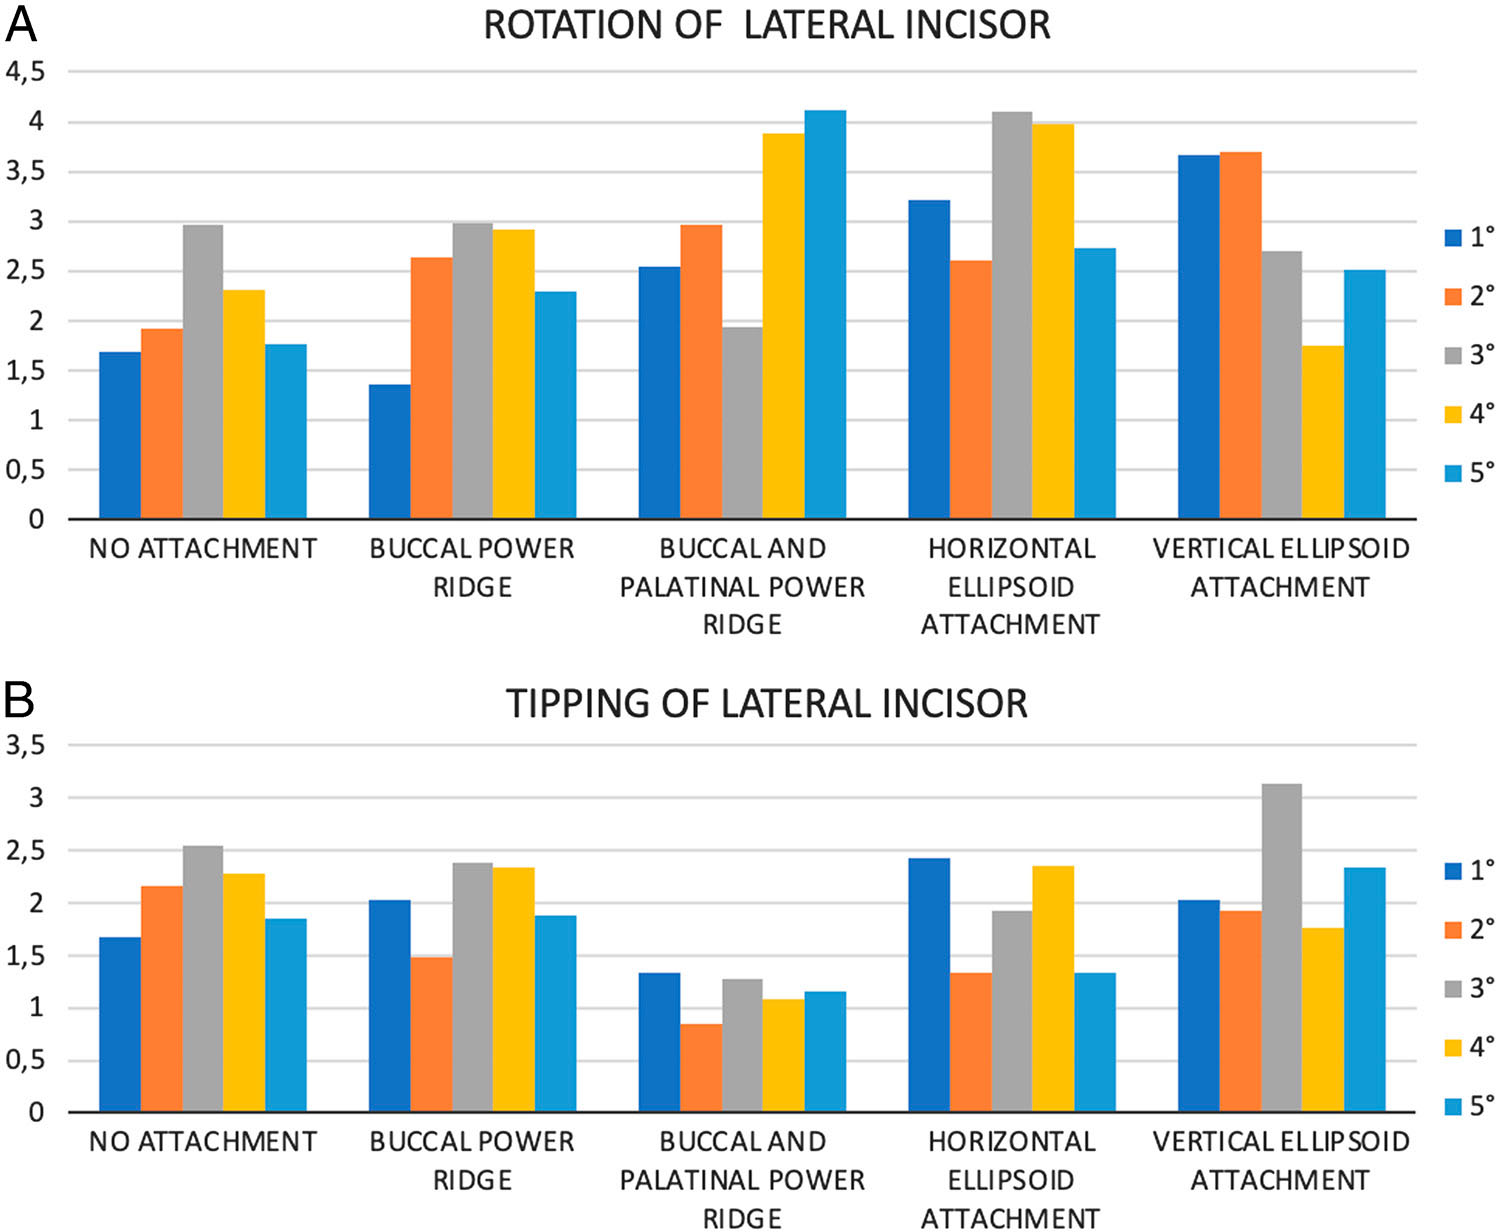
Figure 4.
The table presents side effects resulting from applying torque movement at different degrees to the lateral incisor teeth. A, Distribution of rotation values in the lateral incisor teeth based on degree and mechanism type. B, Distribution of tipping values in the lateral incisor teeth based on degree and mechanism type.
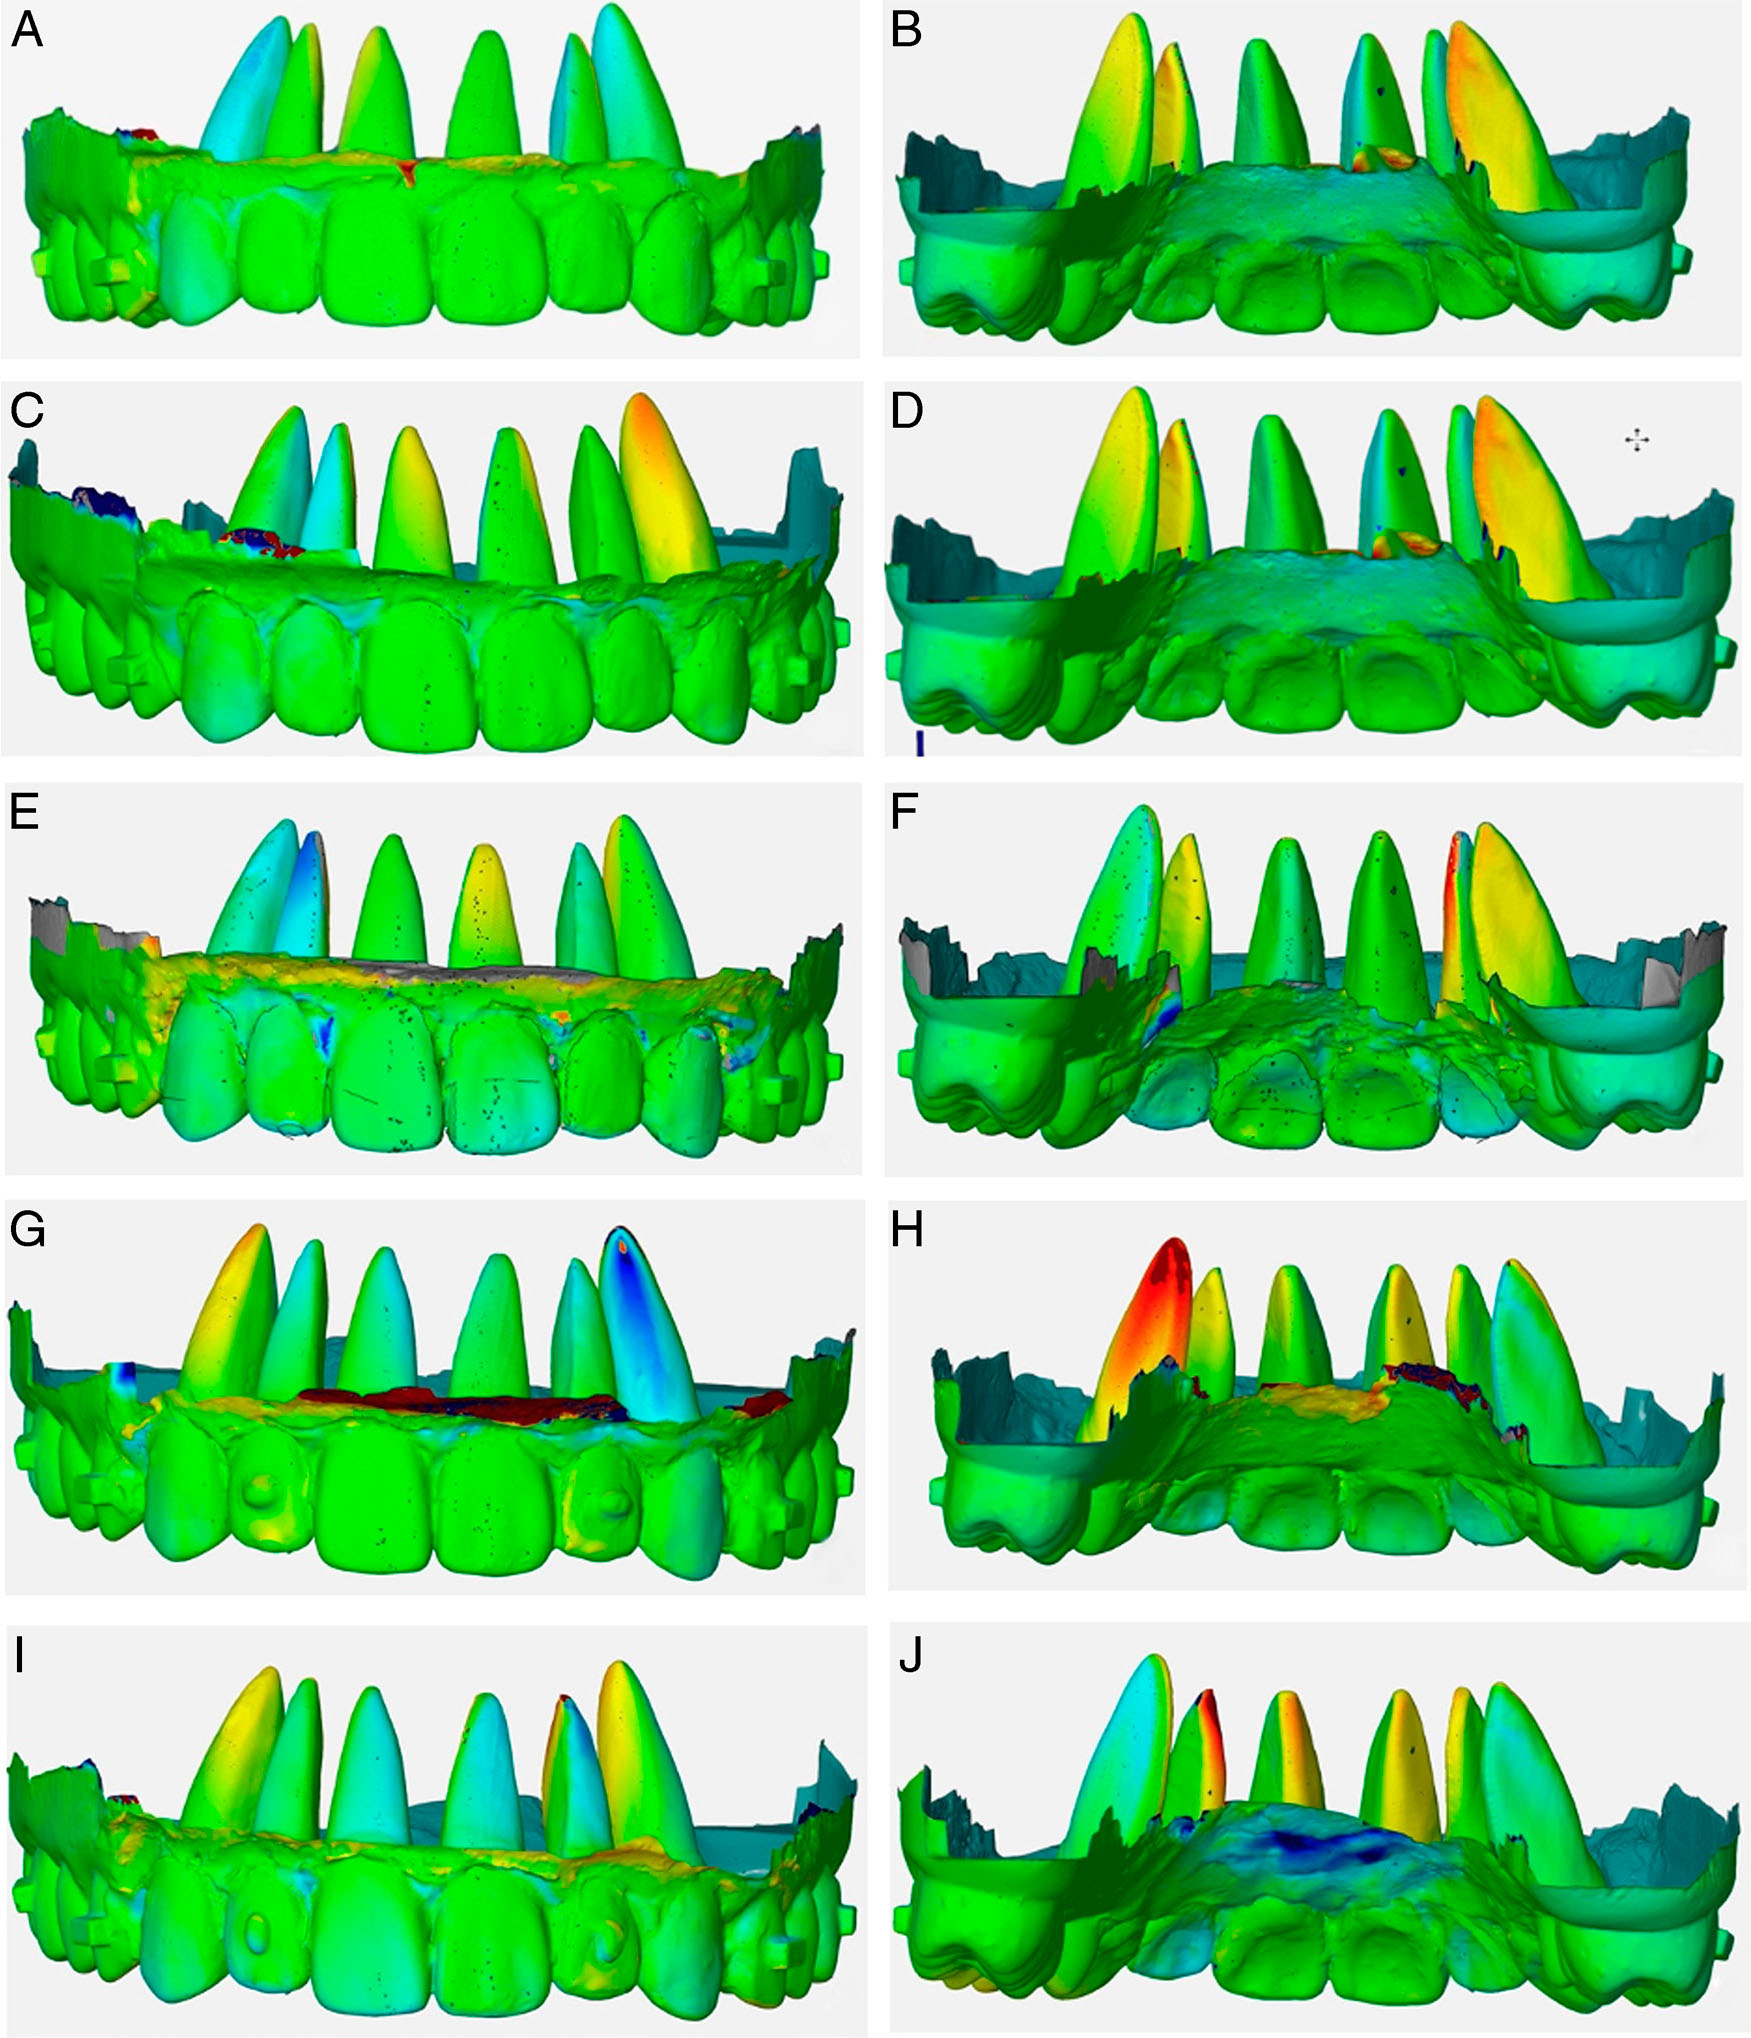
Figure 5.
Examples of buccal and palatal interferences in models with 5° torque movement. A-B, Image of buccal and palatal interference in the group without attachments. C-D, Image of buccal and palatal interference in the buccal power ridge group. E-F, Image of buccal and palatal interference in the buccal and palatal power ridge group. G-H, Image of buccal and palatal interference in the horizontal ellipsoid attachment group. I-J, Image of interference in the vertical ellipsoid attachment group.
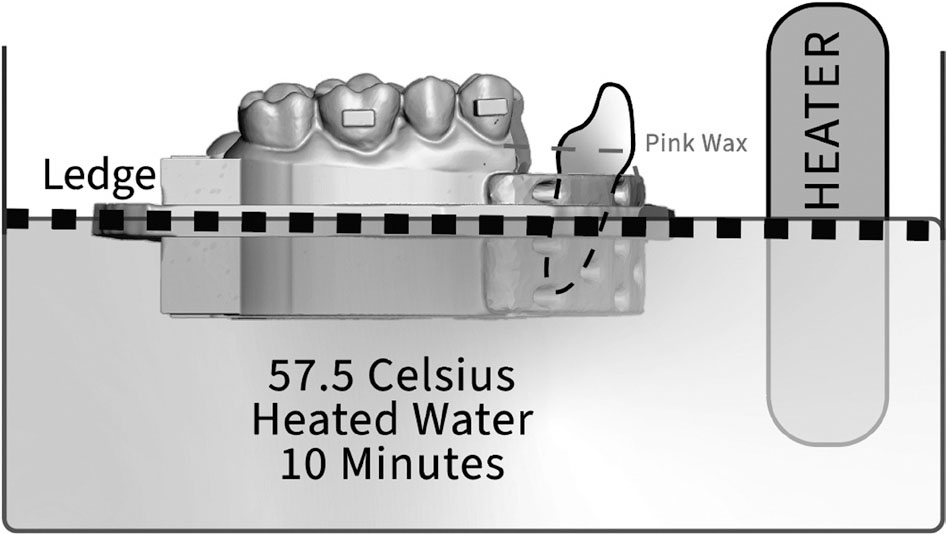
Schematic view of the created experimental setup.