
Table I.
Demographic data of the patients
| Class II | Class I | Class III | post-hoc p-value | ||||
|---|---|---|---|---|---|---|---|
| Variables | mean ± sd | mean ± sd | mean ± sd | p-value | I-II | II-III | I-III |
| Age | 30.08 ± 5.9 | 26.46 ± 6.1 | 26.21 ± 5.3 | 0.18 | |||
| Sex | |||||||
| Female | 28 (90.3 %) | 24 (85.7 %) | 22 (84.6 %) | 0.63 | |||
| Male | 3 (9.6 %) | 4 (14.2 %) | 4 (15.3 %) | ||||
| Upper Third Molar | |||||||
| Present | 20 | 18 | 16 | 0.72 | |||
| Absent | 11 | 10 | 10 | ||||
| Lower Third Molar | |||||||
| Present | 18 | 16 | 20 | 0.81 | |||
| Absent | 13 | 12 | 6 | ||||
| SNA° | 82.7 ± 4.6 | 82.8 ± 5.6 | 79.3 ± 3.4 | 0.09 | |||
| SNB° | 75.8 ± 4.6 | 80.6 ± 5.9 | 83.3 ± 3.5 | 0.001 | 0.04 | 0.001 | NS |
| ANB° | 6.8 ± 2.4 | 2.1 ± 1.1 | -4 ± 3.5 | <0.001 | <0.001 | <0.001 | <0.001 |
| SN-GoMe° | 35.2 ± 7.5 | 31.2 ± 4.4 | 32.5 ± 5.5 | 0.26 |
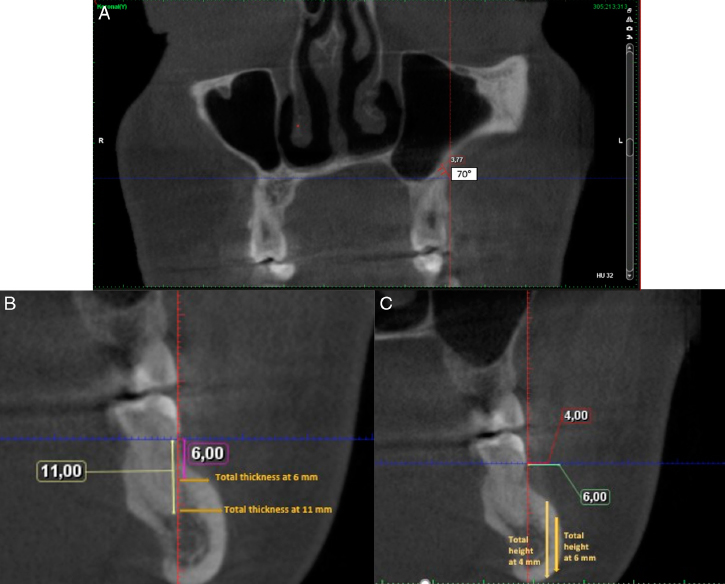
Figure 1.
A, Bone thickness measurement in the infrazygomatic crest at the apex of the root at 70° angulation. B, Total bucco-lingual bone thickness measurement in the mandibular buccal shelf. Two different horizontal reference lines positioned apically at 6 mm and 11 mm from the cemento-enamel junction were used. Total thickness at 6 mm; bucco-lingual thicknesses of bone on a horizontal reference line positioned apically at 6 mm from the cemento-enamel junction, Total thickness at 11 mm; total bucco-lingual thicknesses of bone on horizontal reference lines positioned apically at 11 mm from the cemento-enamel junction. C, Total inciso-apical bone height measurement in the mandibular buccal shelf. Two different vertical reference lines buccally positioned at 4 mm and 6 mm from the cemento-enamel junction, were used. Total height at 4 mm; total inciso-apical height thicknesses of bone on vertical reference line buccally positioned at 4 mm from the cemento-enamel junction, Total height at 6 mm; total inciso-apical height thicknesses of bone on a vertical reference line buccally positioned at 6 mm from the cemento-enamel junction.
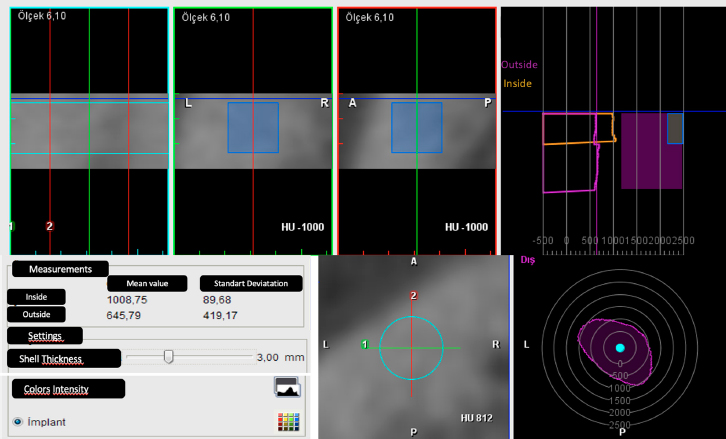
Figure 2.
Bone density measurements (mean value of Hounsfield units-HU) from outside the 2 mm isometric voxel.
Table II.
Comparison of the quantitative bone characteristics in IZC and MBS among Class I, II and III groups
| M1mr | M1dr | M2mr | M2dr | |||||||||||||||||||
|---|---|---|---|---|---|---|---|---|---|---|---|---|---|---|---|---|---|---|---|---|---|---|
| Class II | Class I | Class III | Class II | Class I | Class III | Class II | Class I | Class III | post-hoc pvalue | Class II | Class I | Class III | post-hoc p-value | |||||||||
| mean ± sd | mean ± sd | mean ± sd | p-value | mean ± sd | mean ± sd | mean ± sd | p-value | mean ± sd | mean ± sd | mean ± sd | p-value | I-II | II-III | I-III | mean ± sd | mean ± sd | mean ± sd | p-value | I-II | II-III | I-III | |
| IZC Thickness (rnrnļ | ||||||||||||||||||||||
| Total_thick at 70° | 2.5 ± 1.5 | 3.5 ± 1.9 | 3 ± 2.1 | NS | 2.6 ± 1.5 | 3.2 ± 1.7 | 2.9 ± 1.9 | NS | 2.2 ± 1.3 | 3.3 ± 1.8 | 3 ± 1.5 | 0.04 | 0.04 | NS | NS | 2.4 ± 1.5 | 3.7 ± 1.9 | 3.3 ± 1.9 | 0.04 | 0.03 NS NS | ||
| MBS Thickness (mm) | ||||||||||||||||||||||
| Total thickness at 6 mm | 4.2 ± 3.2 | 2.6 ± 2 | 2.8 ± 2 | NS | 5 ± 3.4 | 4 ± 3.1 | 4.4 ± 2.4 | NS | 6.5 ± 2.2 | 5.8 ± 2.3 | 7.1 ± 1.9 | NS | 7.5 ±2.3 | 7.2 ±2.3 | 8.5 ± 2 | NS | ||||||
| Total thickness at 11 mm | 5.2 ± 2.6 | 4.2 ± 2.6 | 5 ± 2.6 | NS | 6.3 ± 3.1 | 6 ± 2.5 | 6.7 ± 1.8 | NS | 7.2 ± 1.9 | 6.6 ± 2.4 | 7.9 ± l.6 | NS | 8 ±2.2 | 7.4 ±2.4 | 8.6 ± 1.9 | NS | ||||||
| Total height at 4 mm | 18.4 ± 7.1 | 17.7 ± 9.7 | 17 ± 5.1 | NS | l9.9± 6.5 | 20 ± 7.7 | 19.6 ± 4 | NS | 22.7 ± 2.9 | 19.8 ±7.3 | 20.1 ± 3.1 | NS | 23.8 ± 2.9 | 20.9 ±6.l | 20.4 ± 2.9 | 0.01 | 0.04 | 0.01 | NS | |||
| Total height at 6 mm | 14.6 ± 7.4 | 15.3 ± 9.4 | 13.1 ± 6.7 | NS | 16.5 ± 6.4 | 17.2 ± 8.5 | 17 ± 5.1 | NS | 20.4 ± 3.6 | 17.6 ± 8.1 | 17.9 ± 3.9 | NS | 22.1 ± 3.7 | 19 ± 7.6 | 19.7 ± 3.8 | 0.04 | 0.01 | NS | NS | |||
| HU Value | ||||||||||||||||||||||
| Class II | Class I | Class III | ||||||||||||||||||||
| mean ± sd | mean ± sd | mean ± sd | p-value | |||||||||||||||||||
| Maxilla | 681.7± 221.3 | 676 ± 185.6 | 728 ± 127.8 | NS | ||||||||||||||||||
| Mandible | 1187.5 ± 400.6 | 902.2 ± 473.3 | 902.7 ± 294.5 | NS | ||||||||||||||||||
1 HU value, mean value of Hounsfield Unit; IZC, infrazygomatic crest; L, left side; MBS, mandibular buccal shelf area; M1mr, first molar’s mesial root, M1dr, first molar’s distal root, M2mr, second molar’s mesial root; M2dr, second molar’s distal root; NS, nonsignificant; R, right side; Sd, standard deviation.
Table III.
Comparison of the quantitative bone characteristics between different sites in IZC and MBS on right side for each group
| M1mr (I) | M1dr (II) | M2mr (III) | M2dr (IV) | post hoc pvalue | |||||||
|---|---|---|---|---|---|---|---|---|---|---|---|
| Class II | mean ± sd | mean ± sd | mean ± sd | mean ± sd | p-value | I-II | I-III | I-IV | II-III | II-IV | III-IV |
| IZC (mm) | |||||||||||
| Total thickness at 70° | 2.5 ± 1.5 | 2.6 ± 1.5 | 2.2 ± 1.3 | 2.4 ±1.5 | 0.85 | ||||||
| MBS (mm) | |||||||||||
| Total thickness at 6 mm | 4.2 ± 3.2 | 5 ± 3.4 | 6.5 ± 2.2 | 7.5 ±2.3 | <0.001 | NS | 0.04 | 0.001 | NS | 0.01 | NS |
| Total thickness at 11 mm | 5.2 ± 2.9 | 6.3 ± 3.1 | 7.2 ± 1.9 | 8 ±2.2 | 0.002 | NS | 0.04 | 0.002 | NS | NS | NS |
| Total height at 4 mm | 18.4 ±7.1 | 19.9 ± 6.5 | 22.7 ± 2.9 | 23.8 ±2.9 | 0.002 | NS | 0.03 | 0.003 | NS | NS | NS |
| Total height at 6 mm | 14.6 ±7.4 | 16.5 ± 6.4 | 20.4 ± 3.6 | 22.1 ±3.7 | <0.001 | NS | 0.003 | <0.001 | NS | 0.005 | NS |
| Class I | |||||||||||
| IZC (mm) | |||||||||||
| Total thickness at 70° | 3.5 ± 1.9 | 3.2 ± 1.7 | 3.3 ± 1.8 | 3.71 ±1.9 | 0.75 | ||||||
| MBS (mm) | |||||||||||
| Total thickness at 6 mm | 2.6 ± 2 | 4 ± 3.1 | 5.8 ± 2.3 | 7.2 ±2.3 | <0.001 | NS | <0.001 | <0.001 | 0.04 | <0.001 | NS |
| Total thickness at 11 mm | 4.2 ± 2.6 | 6 ± 2.5 | 6.6 ± 2.4 | 7.4 ±2.4 | <0.001 | 0.03 | 0.002 | <0.001 | NS | NS | NS |
| Total height at 4 mm | 17.7 ±9.7 | 20 ± 7.7 | 19.8 ± 7.3 | 20.9 ±6.1 | 0.46 | ||||||
| Total height at 6 mm | 15.3 ±9.4 | 17.2 ± 8.5 | 17.6 ± 8.1 | 19 ±7.6 | 0.4 | ||||||
| Class III | |||||||||||
| IZC (mm) | |||||||||||
| Total thickness at 70° | 3 ± 2.1 | 2.9 ± 1.9 | 3 ± 1.5 | 3.3 ± 1.9 | 0.89 | ||||||
| MBS (mm) | |||||||||||
| Total thickness at 6 mm | 2.8 ± 2 | 4.4 ± 2.4 | 7.1 ±1.9 | 8.5 ± 2 | <0.001 | 0.03 | <0.001 | <0.001 | <0.001 | <0.001 | NS |
| Total thickness at 11 mm | 5 ± 2.6 | 6.7 ± 1.8 | 7.9 ± 1.6 | 8.6 ± 1.9 | <0.001 | 0.01 | <0.001 | <0.001 | NS | 0.004 | NS |
| Total height at 4 mm | 17 ± 5.1 | 19.6 ±4 | 20.1 ± 3.1 | 20.4 ± 2.9 | 0.007 | NS | 0.02 | 0.01 | NS | NS | NS |
| Total height at 6 mm | 13.1 ± 6.7 | 17 ± 5.1 | 17.9 ± 3.9 | 19.7 ± 3.8 | <0.001 | 0.02 | 0.003 | <0.001 | NS | NS | NS |
Table IV.
Correlation between cephalometric parameters and quantitative bone characteristics
| SNA | SNB | Maxillary Length | Mandibular Length | |||||
|---|---|---|---|---|---|---|---|---|
| r | p-Value | r | p-Value | r | p-Value | r | p-Value | |
| M1mr | ||||||||
| Total thickness at 70° | 0.070 | 0.66 | 0.048 | 0.76 | -0.186 | 0.24 | 0.238 | 0.13 |
| Total thickness at 6 mm | 0.202 | 0.2 | -0.034 | 0.83 | 0.295 | 0.06 | 0.207 | 0.19 |
| Total thickness at 11 mm | 0.301 | 0.05 | 0.328 | 0.03 | 0.212 | 0.18 | 0.331 | 0.03 |
| Total height at 4 mm | 0.174 | 0.27 | 0.140 | 0.38 | 0.124 | 0.44 | 0.440 | 0.004 |
| Total height at 6 mm | 0.284 | 0.07 | 0.246 | 0.12 | 0.220 | 0.16 | 0.357 | 0.02 |
| M1dr | ||||||||
| Total thickness at 70° | 0.032 | 0.84 | 0.035 | 0.83 | -0.120 | 0.45 | 0.267 | 0.09 |
| Total thickness at 6 mm | 0.131 | 0.41 | 0.031 | 0.84 | 0.164 | 0.3 | 0.268 | 0.09 |
| Total thickness at 11 mm | 0.293 | 0.06 | 0.346 | 0.02 | 0.030 | 0.85 | 0.375 | 0.01 |
| Total height at 4 mm | 0.028 | 0.86 | 0.059 | 0.71 | 0.018 | 0.90 | 0.504 | 0.001 |
| Total height at 6 mm | 0.139 | 0.38 | 0.211 | 0.18 | 0.087 | 0.58 | 0.450 | 0.003 |
| M2mr | ||||||||
| Total thickness at 70° | -0.088 | 0.58 | 0.089 | 0.57 | -0.001 | 0.99 | 0.210 | 0.08 |
| Total thickness at 6 mm | 0.189 | 0.23 | 0.358 | 0.02 | -0.059 | 0.71 | 0.508 | 0.001 |
| Total thickness at 11 mm | 0.085 | 0.59 | 0.358 | 0.02 | -0.023 | 0.88 | 0.346 | 0.02 |
| Total height at 4 mm | 0.059 | 0.71 | -0.092 | 0.56 | 0.155 | 0.33 | 0.384 | 0.01 |
| Total height at 6 mm | 0.089 | 0.57 | 0.002 | 0.99 | 0.124 | 0.44 | 0.508 | 0.001 |
| M2dr | ||||||||
| Total thickness at 70° | -0.190 | 0.23 | -0.044 | 0.78 | -0.069 | 0.66 | 0.233 | 0.14 |
| Total thickness at 6 mm | 0.042 | 0.79 | 0.355 | 0.02 | -0.043 | 0.79 | 0.523 | <0.001 |
| Total thickness at 11 mm | 0.150 | 0.34 | 0.281 | 0.07 | 0.051 | 0.73 | 0.431 | 0.005 |
| Total height at 4 mm | 0.035 | 0.82 | -0.208 | 0.19 | 0.132 | 0.41 | 0.293 | 0.03 |
| Total height at 6 mm | -0.012 | 0.94 | -0.115 | 0.47 | 0.081 | 0.61 | 0.430 | 0.005 |