Have a personal or library account? Click to login
A new torquing method for anterior tooth inclination control: a clinical report with a 7-year follow-up Cover

A new torquing method for anterior tooth inclination control: a clinical report with a 7-year follow-up

Open Access
|Jun 2023

Figures & Tables

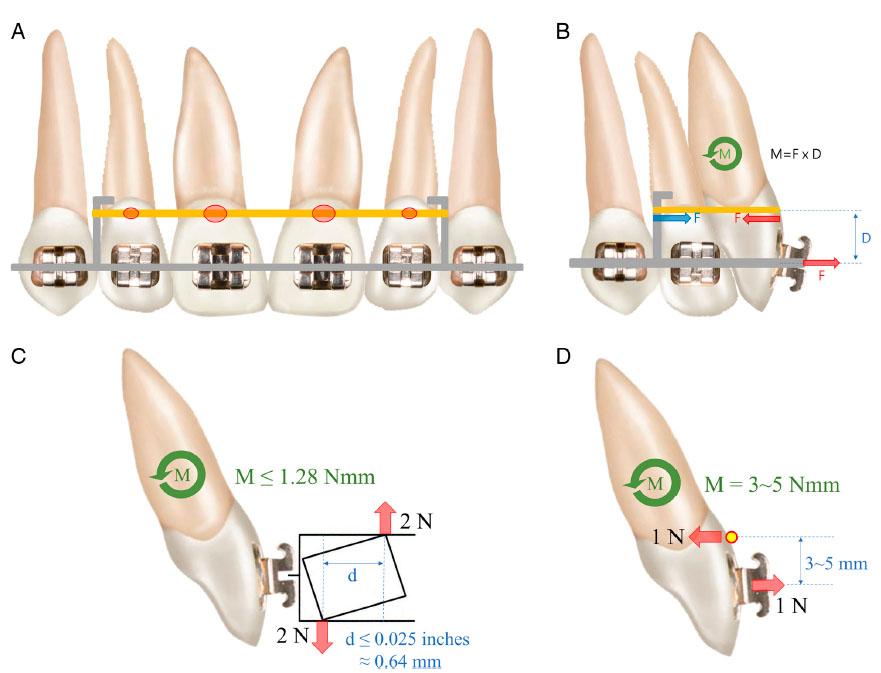
Figure 1.

The configuration of mechanics. (A) Frontal view. The red circles represent the tooth surface with which the thread is in contact. (B) Force diagram. The red arrows indicate the force vectors acting on the incisor, and the blue arrow denotes the force vector working on the archwire. The green circular arrow represents the couple force acting on the incisor. (C) Quantitative analysis of wire twisting technique. The red arrows denote orthodontic force generated from twisted wire. Due to the bracket play, the moment arm is less than the wire dimension. Despite high orthodontic force, the obtainable moment is rather limited. (D) Quantitative analysis of Park’s cervical torque tie. The red arrows demonstrate forces from the elastic thread. The moment arm is adjustable between 3 and 5 mm. With small orthodontic force, a large moment is obtainable.

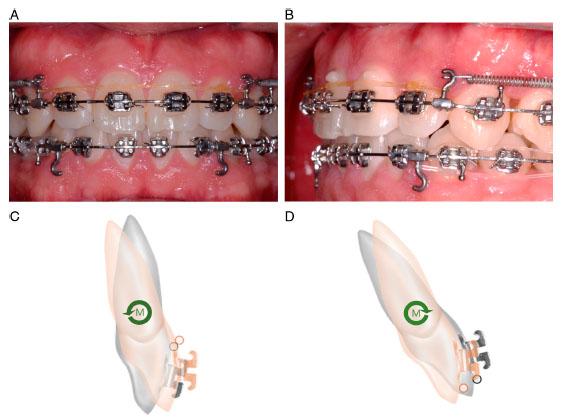
Figure 2.

(A, B) The cervical torque tie’s intraoral view. The composite resins on the cervical area prevent the gingival damage which can be caused by the gingivally displaced thread. (C, D) Diagrams showing the couple force direction. The grey tooth indicates the initial position, and the orange tooth represents the latter position. Depending on whether the thread is on the cervical or incisal area, palatal or labial root moment can be obtained.

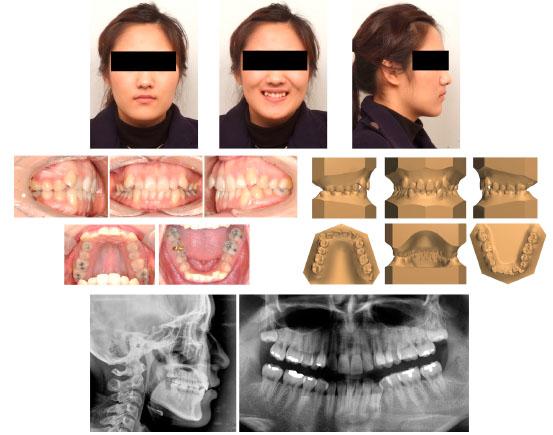
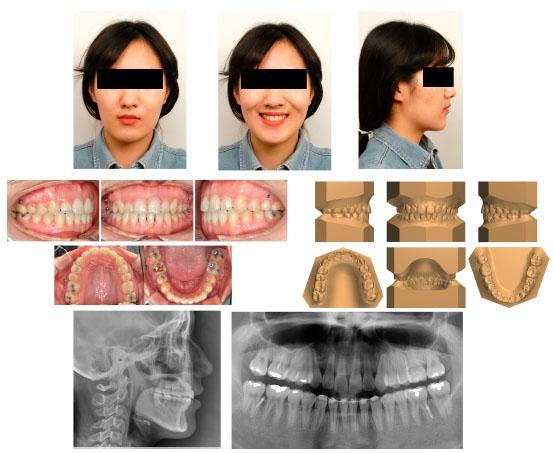
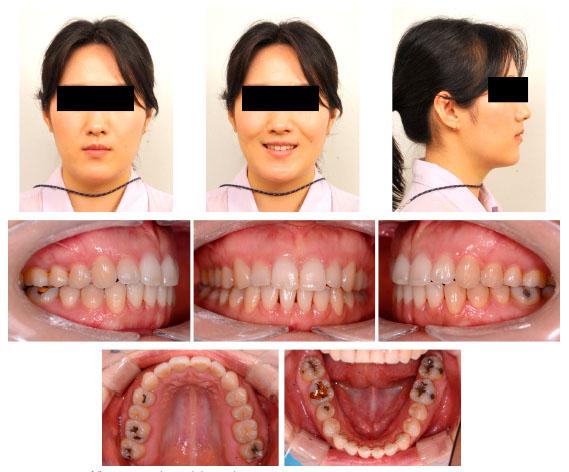
Figure 3.

Pretreatment extra-, intraoral photographs, cephalogram, panoramic radiographs and 3-dimensional virtual model.

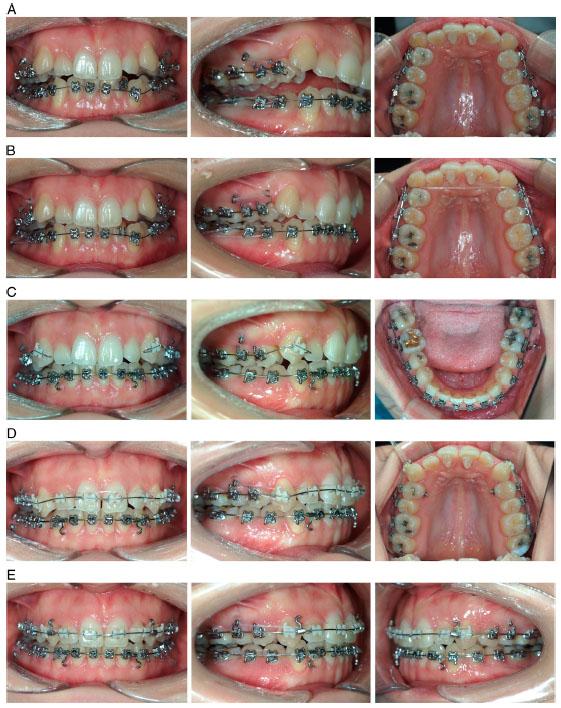
Figure 4.

Treatment progress. (A) Initiation of treatment. (B) Three-month intraoral photograph. (C) 10-month intraoral photograph. (D) 16-month intraoral photograph. (E) 18-month intraoral photograph.

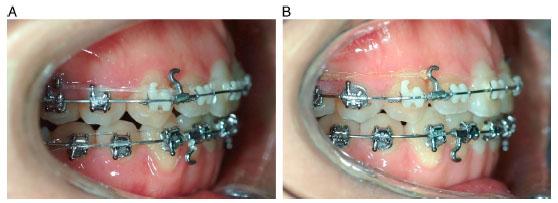
Figure 5.

Change in the incisors’ inclination. (A) 18-month intraoral photograph. (B) 29-month intraoral photograph.

Figure 6.

Post-treatment extra-, intraoral photographs, cephalogram, panoramic radiographs and three-dimensional virtual model.

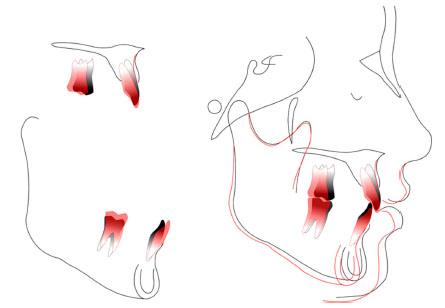
Figure 7.

Cephalogram superimposition between pre- (black) and post-treatment (red).

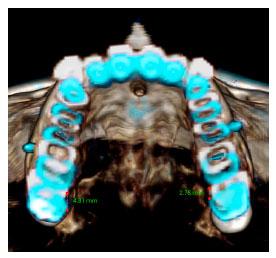
Figure 8.

CBCT superimposition between pre- (white) and post-treatment (blue).

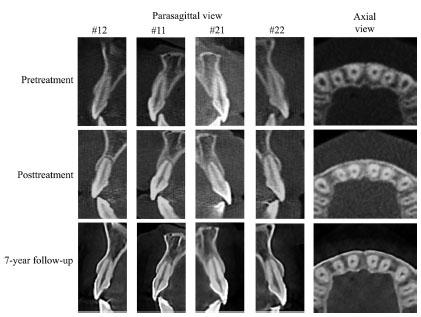
Figure 9.

CBCT images’ sections at pretreatment, post-treatment and 7-year follow-up. The dehiscence on the palatal side, discovered after treatment, was recovered to the cortical bone 7 years later.

Figure 10.

Seven-year follow-up extra- and intraoral photographs.

Cephalometric measurements

PretreatmentPosttreatment
SNA (degree)80.480.2
SNB (degree)77.175.8
ANB (degree)3.34.4
Wits appraisal (mm)0.741.2
FMA (degree)20.722.1
U1 to FH (degree)102.6107.1
IMPA (degree)87.893.2
Interincisal Angle (degree)148.9137.6
Upper lip to E-line (mm)–3.6–3.8
Lower lip to E-line (mm)–1.1–1.9
DOI: https://doi.org/10.2478/aoj-2023-0016 | Journal eISSN: 2207-7480 | Journal ISSN: 2207-7472
Language: English
Page range: 183 - 194
Submitted on: Mar 1, 2022
Accepted on: Apr 1, 2023
Published on: Jun 17, 2023
Published by: Australian Society of Orthodontists Inc.
In partnership with: Paradigm Publishing Services
Publication frequency: 1 times per year

© 2023 Hyung-Kyu Noh, Ho-Jin Kim, Hyo-Sang Park, published by Australian Society of Orthodontists Inc.
This work is licensed under the Creative Commons Attribution 4.0 License.